. 2024 Jun 18;43(1):170.
doi: 10.1186/s13046-024-03088-7.

Intravesical instillation-based mTOR-STAT3 dual targeting for bladder cancer treatment

Affiliations

Intravesical instillation-based mTOR-STAT3 dual targeting for bladder cancer treatment

Dae Hoon Lee et al. J Exp Clin Cancer Res. .

Erratum in

Abstract

Background: Recent intravesical administration of adenoviral vectors, either as a single injection or in combination with immune checkpoint inhibitors, exemplified by cretostimogene grenadenorepvec and nadofaragene firadenovec, has demonstrated remarkable efficacy in clinical trials for non-muscle invasive bladder cancer. Despite their ability to induce an enhanced immune reaction within the lesion, the intracellular survival signaling of cancer cells has not been thoroughly addressed.

Methods: An analysis of the prognostic data revealed a high probability of therapeutic efficacy with simultaneous inhibition of mTOR and STAT3. Considering the challenges of limited pharmaco-accessibility to the bladder due to its pathophysiological structure and the partially undruggable nature of target molecules, we designed a dual siRNA system targeting both mRNAs. Subsequently, this dual siRNA system was encoded into the adenovirus 5/3 (Ad 5/3) to enhance in vivo delivery efficiency.

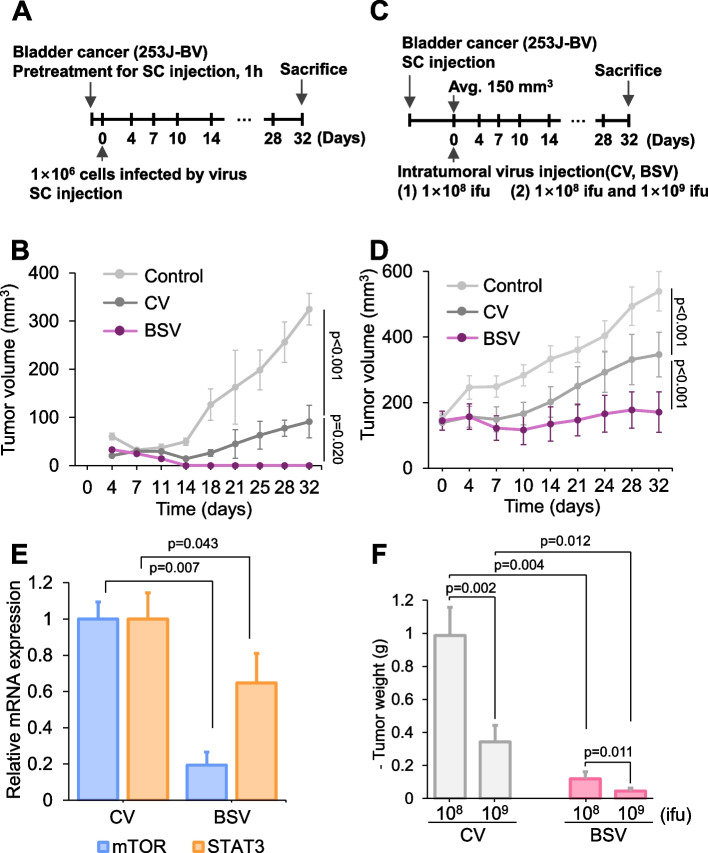
Results: Gene-targeting efficacy was assessed using cells isolated from xenografted tumors using a single-cell analysis system. Our strategy demonstrated a balanced downregulation of mTOR and STAT3 at the single-cell resolution, both in vitro and in vivo. This approach reduced tumor growth in bladder cancer xenograft and orthotopic animal experiments. In addition, increased infiltration of CD8+ T cells was observed in a humanized mouse model. We provided helpful and safe tissue distribution data for intravesical therapy of siRNAs coding adenoviruses.

Conclusions: The bi-specific siRNA strategy, encapsulated in an adenovirus, could be a promising tool to augment cancer treatment efficacy and overcome conventional therapy limitations associated with "undruggability." Hence, we propose that dual targeting of mTOR and STAT3 is an advantageous strategy for intravesical therapy using adenoviruses.

Keywords: Bladder cancer; Cancer therapy; STAT3; mTOR; siRNA.


Conflict of interest statement

D.H.L., J.K.Y., K.H.U., W.H., and M.J.K. have partially received the research grant from Curigin. Ltd. S.M.L., J.P., J.S., and J.W.C. declare no competing interests associated with this manuscript.

Figures

Fig. 1
Fig. 1
mTOR and STAT3: a synergistic alliance in patients with bladder cancer. A-B Overall survival in patients with bladder cancer. Among 407 bladder cancer samples, patients with an upper 20% (79 patients) and lower 20% (79 patients) expression of mTOR (A) or patients with an upper 20% (81 patients) and lower 20% (81 patients) expression of STAT3 (B) were selected and their survival rate was analyzed using the Kaplan–Meyers curve. C Survival of patients with commonly high (24 patients) or low (26 patients) expression coindex of mTOR and STAT3. D-E Disease-free survival (DFS) in patients with lung squamous cell carcinoma (LUSC). Among 487 LUSC samples, patients with an upper 20% (77 patients) and lower 20% (65 patients) expression of mTOR (D) or patients with an upper 20% (71 patients) and lower 20% (68 patients) expression of STAT3 (E) were selected and their survival rate was analyzed in a Kaplan-Meyers curve. F DFS of patients with commonly high (27 patients) or low (23 patients) expression coindex of mTOR and STAT3. Refer to survival data analysis in methods for detail method about (A-F). G-O The transfection of si-mTOR and si-STAT3 was performed in A549 cells (G-I), C4-2B cells (J-L), and 253 J-BV cells (MO) in strict accordance with the concentration defined in the associated plot. A PCR assay was used to evaluate the mRNA expression of mTOR (G, J, and M) and STAT3 (H, K, and N). Finally, cell viability was analyzed using an appropriate cell viability assay (I, L, and O). To ensure uniformity in the total RNA content across all samples, a negative siRNA control was introduced to each, up to a concentration of 200 nM. Subsequently, all samples were collected for analysis 48 h post-transfection
Fig. 2
Fig. 2
Efficacy of combined suppression between mTOR and STAT3. A To evaluate the synergistic effect, the viabilities of 253 J-BV and RT-4 cells were measured following individual or combined treatment with mTOR and STAT3 siRNAs (+ : siRNA 50 nM, +  + : siRNA 100 nM). B Viability of cisplatin-resistant 253 J-BV cells in the presence of cisplatin (10 μM) with siRNA treatment (+ : siRNA 50 nM, +  + : siRNA 100 nM). C Western blotting to evaluate the downstream targets of mTOR and STAT3. Downstream target molecules were evaluated after treatment with Torin1 and STATTIC in 253 J-BV cells (Torin-1; + : 1 μM, +  + : 2 μM, STATTIC; + : 5 μM, +  + : 10 μM). D RT-4 cells were transfected with mTOR and STAT3 siRNAs. Next, mTOR- and STAT3-related molecules were analyzed (+ : siRNA 50 nM, +  + : siRNA 100 nM). E The 253 J-BV and A549 cell lines were subjected to transfection procedures with siRNAs targeted at mTOR and STAT3. Subsequent to this manipulation, a detailed analysis was conducted focusing on molecular entities related to both mTORC1 and mTORC2 complexes (+ : siRNA 50 nM, +  + : siRNA 100 nM) (for statistics, two-tailed t-test for A and B)
Fig. 3
Fig. 3
Balanced knockdown strategy for mTOR/STAT3 via an shRNA-mediated expression system. A Graphic illustration of the structure of the bispecific shRNA (bs_shRNA) compared with that of the conventional tandem shRNA system (t_shRNA). This system allows the encoding of two target sequences in a short coding length and decreases the off-target effect. B qPCR detection of mTOR and STAT3 expression of 253 J-BV for knock-down efficacy of t_shRNA and bs_shRNA in 253 J-BV transfected with t_shRNA and bs_shRNA. C The number of shRNA production of t_shRNA and bs_shRNA in 253 J-BV at a single cell level. Relative quantification is used through qPCR to calculate the copy number of the shRNA product. Refer to copy number calculation of shRNA in methods for detail method. D qPCR analysis at the single-cell level to compare the efficacy of knock-down between t_shRNA and bs_shRNA in each 253 J-BV transfected plasmid vector. Refer to RNA preparation and qPCR from a single cell in methods for detail method. (For statistics, two-tailed t-test for B and C, NS = non-significant)
Fig. 4
Fig. 4
Incorporation of bispecific shRNA into replication-competent adenovirus. A Genetic construction of bispecific shRNA (bs_shRNA)-expressing adenovirus (BSV). The human telomerase promoter was encoded in the front of E1A-IRES-E1B, and the U6 promoter was used for the shRNA expression in E3. In the CV construct, the shRNA cassette under the U6 promoter was replaced with a GFP cassette driven by the CMV promoter. Refer to preparation of replication-competent adenovirus in methods for detail method. B Normal cells (PrEC and HUEpC) and cancer cells (C4-2B and 253 J-BV) were infected by 20 MOI of CV for 72 h. C Viral vector concentration (MOI)-based cell viability test: HUEpC and 253 J-BV cells were treated with 5 MOI of CV and BSV for 72 h. D Suppression of the expression of mTOR and STAT3 as indicated by real-time PCR. For this analysis, 253 J-BV cells were treated with 5 MOI CV and BSV for 72 h. E Western blotting revealing the changes between BSV- and CV-induced mTOR and STAT3 downregulation following the treatment of 253 J-BV cells with 5 MOI CV and BSV for 72 h. F, G Viral vector concentration (MOI)-based cell viability test using crystal violet staining (F) and cell viability assay (G). The 253 J-BV cells were treated with viruses for 72 h in a concentration-dependent manner (for statistics, two-tailed t-test for C, D)
Fig. 5
Fig. 5
Transcriptome analysis to ascertain the impact of BSV on cellular signaling pathways. A-D An oncolytic adenovirus-armed bs_shRNA system was constructed and its potency was confirmed using RNA seq. Cells were analyzed after 72 h of 5 MOI virus infection. A Analysis of RNA sequencing-based signaling pathways affected by CV and BSV in A549 cells. B RNA sequencing results of (A), BSV-affected pathways were aligned using a volcano plot based on the log squared p-value. The pink dot refers to the representative significant-signaling pathway in cancer prognosis. C The seven most significant cancer pathways were selected and imaged to display every gene in each pathway. D The number of up- and down-regulated genes was counted in the selected pathways (C). E 253 J-BV cells were harvested after 72 h of 5 MOI virus infection (CV and BSV). Next, scRNA-seq was performed using the BD rhapsody platform. Single cells are displayed in the UMAP plot colored by clusters. F Bar plots showing the proportions of clusters according to the clusters. G Dot plot showing the average expression of representative markers for each cluster. H Single-cell trajectory colored by pseudotime. Refer to RNA sequencing and data analysis, and single-cell RNA seq and data processing in methods for detail method
Fig. 6
Fig. 6
Evaluation of in vivo effectiveness of BSV within a xenograft mouse model. A Experimental schedule evaluating the efficacy of BSV ex vivo. B Tumor growth was recorded. 253 J-BV cells were infected at 2 MOI and subsequently injected subcutaneously in BALB/c nude mouse (1 × 106 cells). Next, 1 × 106 253 J-BV cells were infected at 2 MOI of each virus and subsequently injected subcutaneously in BALB/c nude mouse (n = 6 mice for each group) at day 0. From day 4, tumor size was measured twice a week until day 32. C Experimental schedule evaluating the efficacy of BSV in vivo. Briefly, 1 × 106 253 J-BV cells were injected subcutaneously in mice. Viruses were injected intratumorally with 150 mm3 volume following the number of virus on the number 1 (as (1) 1 × 108 IFUs, for (D)) and the number 2 (as (2) 1 × 108 IFUs and 1 × 109 IFUs, for (F)). D Tumor growth was recorded. A total of 1 × 106 253 J-BV cells were injected subcutaneously in mice (n = 6 mice for each group). Viruses (1 × 108 IFUs) were injected intratumorally with 150 mm3 volume at day 0. Tumor size was measured twice a week for 32 days. E The mRNA levels of mTOR and STAT3 were measured using qPCR in the isolated tumors of (B) at day 32. F Based on (C), viruses (1 × 108 and 1 × 109 IFUs) were injected intratumorally and the tumors were established with 253 J-BV (1 × 10.6 cells). At day 32, tumor volume was measured after animal sacrifice (n = 6 mice for each group) (for statistics, two-tailed t-test for B, D, E, and F)
Fig. 7
Fig. 7
Confirmation of potential as a novel therapeutic candidate for bladder cancer treatment. A Schematic of the timeline for multiple virus treatments at the upper panel. A total of 1 × 106 253 J-BV cells were injected subcutaneously in mice (n = 6 mice for each group). When the tumor volume reached 100 mm3 (day 0), BSV (1 × 108 IFUs) and CV (1 × 108 IFUs) were intratumorally multi-injected (only BSV, 1, 3, or 5 times) in the initial 3 or 5 days (1 time: day 1; 3 times: days 1, 2 and 3; 5 times: days 1, 2, 3, 4, and 5). At the under panel, tumor volume was measured twice a week for 7 weeks. B A total of 1 × 106 253 J-BV cells were injected subcutaneously in mice (n = 6 mice for each group). When the tumor volume reached 50 mm3 (day 0), BSV (1 × 108 IFUs) were intratumorally injected from days 1 to 3 daily. Mice were treated daily with a combination of cisplatin (10 mg/kg, intraperitoneal injection) from days 0 to 9. The tumor was measured once every week. Tumor volume curve at the under panel. C-D A total of 1 × 106 253 J-BV cells were subcutaneously injected into BALB/c nude mice. When the tumor reached a volume of 100 mm3, an intratumoral injection of 1 × 108 IFUs of CV was administered (designated as day 0). On the first, third, and seventh days subsequent to the CV injection, both the tumors and other organs (including the spleen, lungs, liver, kidneys, testis, and heart) were harvested to assess viral distribution. C GFP (green) and nuclei (blue) were visualized using an anti-GFP antibody and DAPI, respectively, during immunofluorescence staining. The tumors were harvested on days 0, 1, 3, and 7. E1A gene, known as a viral gene, was analyzed within the tumor and each organ (spleen, lungs, liver, kidneys, testis, and heart) to evaluate the distribution of distribution. Refer to biodistribution analysis for intravesical BSV instillation in methods for detail method. E–G A total of 1 × 106 253 J-BV cells were injected subcutaneously in BALB/c nude mice. When the tumor volume reached 100 mm3, 1 × 10.8 IFUs of CV and BSVwere injected intratumorally. After 7 days for (E) and 14 days for (F and G), mice were euthanized and tumors were harvested for analysis. E Hexon (green) and cleaved caspase-3 (red) were stained by immunofluorescence staining for these expressions. F Vasculature was visualized using an anti-CD31 antibody for immunofluorescence staining. G Vimentin (green) and smooth muscle actin (red), known as epithelial–mesenchymal transition (EMT) markers, were stained to evaluate the inhibitory effect of metastasis of BSV (for statistics, two-tailed t-test for A and B)
Fig. 8
Fig. 8
Evaluation of the in vivo effectiveness of BSV within an orthotopic bladder cancer mouse model. A A schedule scheme for intravesical instillation based orthotopic animal experiment. Seven days after the instillation of 5 × 106 253 J-BV-Luc cells, viruses (1 × 108 IFUs) were injected on days 1, 2, and 3. Viruses were injected into the mice in BSV 2Tx group at days 1 and 2, and in BSV 3Tx group at days 1, 2, and 3. At day 43, tumor growth was visualized using bioluminescence imaging, and tumor samples were harvested after sacrifice (n = 5 mice for control, n = 6 mice for BSV 2Tx and BSV 3Tx). B Tumor size of (A) was visualized by bioluminescence imaging. C Isolated tumors (A) were weighed (for statistics, two-tailed t-test for C). D The biodistribution analysis for intravesical BSV instillation within internal organs was investigated over time using a hamster model that received intravesical instillation of BSV
Fig. 9
Fig. 9
BSV facilitates CD8+ T-cell recruitment into the tumor in a humanized mouse model. A-E The population of immune cells was analyzed following a viral treatment; CD34 + hu-NSG (n = 6, each group) humanized animals were used. 253 J-BV cells were subcutaneously inoculated. The virus was intratumorally injected at the 60 mm3 tumor volume. The population of immune cells was monitored at 21 days after viral injection. A Representative plot of flow cytometry for determining T-cell population. B Representative plot of flow cytometry for determining CD4+ or CD8+ T-cell population. C T-cell populations were compared using CD45+/CD3+ by flow cytometry based on (A). D CD4+ T-cell populations were compared using CD45+/CD3+/CD4+/CD8 by flow cytometry based on (B). E CD8+ T-cell populations were compared using CD45+/CD3+/CD4/CD8.+ by flow cytometry based on (B) (for statistics, two-tailed t-test for C, D, F-test for E, NS = non-significant)

References

    1. Morales A, Eidinger D, Bruce AW. Intracavitary Bacillus Calmette-Guerin in the treatment of superficial bladder tumors. J Urol. 1976;116(2):180–3. - PubMed
    1. Balar AV, Milowsky MI, O’Donnell PH, Alva AS, Kollmeier M, Rose TL, Pitroda S, Kaffenberger SD, Rosenberg JE, Francese K, Hochman T, Goldberg JD, Griglun S, Leis D, Steinberg GD, Wysock J, Schiff PB, Sanfilippo NJ, Taneja S, Huang WC. Pembrolizumab (pembro) in combination with gemcitabine (Gem) and concurrent hypofractionated radiation therapy (RT) as bladder sparing treatment for muscle-invasive urothelial cancer of the bladder (MIBC): A multicenter phase 2 trial. J Clin Oncol. 2021;39((15_suppl)):4504.
    1. Shore ND, Palou RJ, Robert G, Hutson TE, Cesari R, Hariharan S, Rodríguez FÓ, Briganti A, Steinberg GD. Non-muscle-invasive bladder cancer: an overview of potential new treatment options. Urol Oncol. 2021;39(10):642–63. - PubMed
    1. Miodonski AJ, Litwin JA. Microvascular architecture of the human urinary bladder wall: a corrosion casting study. Anat Rec. 1999;254(3):375–81. - PubMed
    1. Uchio EM, Lamm DL, Shore ND, Kamat AM, Tyson M, Tran B, Anderson P, Grandi P, Burke JM. A phase 3, single-arm study of CG0070 in subjects with nonmuscle invasive bladder cancer (NMIBC) unresponsive to Bacillus Calmette-Guerin (BCG). J Clin Oncol. 2022;40(6_suppl):TPS598–TPS598.

MeSH terms