. 2024 Jun 18;15(1):171.
doi: 10.1186/s13287-024-03785-2.

Standardized generation of human iPSC-derived hematopoietic organoids and macrophages utilizing a benchtop bioreactor platform under fully defined conditions

Affiliations

Standardized generation of human iPSC-derived hematopoietic organoids and macrophages utilizing a benchtop bioreactor platform under fully defined conditions

Mania Ackermann et al. Stem Cell Res Ther. .

Abstract

Background: There is a significant demand for intermediate-scale bioreactors in academic and industrial institutions to produce cells for various applications in drug screening and/or cell therapy. However, the application of these bioreactors in cultivating hiPSC-derived immune cells and other blood cells is noticeably lacking. To address this gap, we have developed a xeno-free and chemically defined intermediate-scale bioreactor platform, which allows for the generation of standardized human iPSC-derived hematopoietic organoids and subsequent continuous production of macrophages (iPSC-Mac).

Methods: We describe a novel method for intermediate-scale immune cell manufacturing, specifically the continuous production of functionally and phenotypically relevant macrophages that are harvested on weekly basis for multiple weeks.

Results: The continuous production of standardized human iPSC-derived macrophages (iPSC-Mac) from 3D hematopoietic organoids also termed hemanoids, is demonstrated. The hemanoids exhibit successive stage-specific embryonic development, recapitulating embryonic hematopoiesis. iPSC-Mac were efficiently and continuously produced from three different iPSC lines and exhibited a consistent and reproducible phenotype, as well as classical functionality and the ability to adapt towards pro- and anti-inflammatory activation stages. Single-cell transcriptomic analysis revealed high macrophage purity. Additionally, we show the ability to use the produced iPSC-Mac as a model for testing immunomodulatory drugs, exemplified by dexamethasone.

Conclusions: The novel method demonstrates an easy-to-use intermediate-scale bioreactor platform that produces prime macrophages from human iPSCs. These macrophages are functionally active and require no downstream maturation steps, rendering them highly desirable for both therapeutic and non-therapeutic applications.

Keywords: Bioreactor; Cell manufacturing; Drug screening; Hematopoiesis; Macrophages; Organoids; Up-scaling; hiPSC.


Conflict of interest statement

M.A. and N.L. are authors of the patent application (European patent application number PCT/EP2018/061574) entitled ‘Stem-cell derived myeloid cells, generation and use thereof’. The priority date of the application is 4 May 2017. N.L. and S.A. are authors on the patent application (European patent application number PCT/EP2021/083371) entitled ‘Application of stem cell derived monocytes in a Monocyte Activation Test (MAT) for the assessment of pyrogenicity and inflammatory potential’. The priority date of the application is 29 November 2021. All other authors declare no competing interests.

Figures
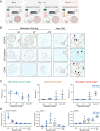
Fig. 1
Fig. 1
Organoid-based production of iPSC-Mac in intermediate-scale bioreactors recapitulates embryonic hematopoietic development. A Schematic representation of the manufacturing process in an intermediate-scale benchtop bioreactor to produce hemanoids and the continuous generation of iPSC-derived macrophages. B Immunohistochemical analysis of VE-Cadherin/CD144, VEGFR and CD45 expression in hemanoids derived from day 4, 7 and 10 of mesoderm priming as well as from hemanoids during hematopoietic differentiation after they initiated production of iPSC-derived Mac (day 7–10). Arrows indicate characteristic regions (scale bar = 200 µm, data shown for iPSC line#1, representative of n = 2). C Flow cytometric analysis of CD34, CD144, CD43 and CD45 expression to identify different hemato-endothelial progenitor populations. Hemanoids were dissociated and analyzed on day 4, 7 and 10 of mesoderm priming as well as during hematopoietic differentiation after they initiated production of hiPSC-derived Mac. Populations were pre-gated for single cells, CD34+ cells and viable cells. Subsequently, the frequency of CD144+/CD45 Hemato-endothelial progenitors, CD144-/CD43+ early hematopoietic progenitors and CD144-/CD45+ hematopoietic progenitors was analyzed in the CD34+ population (individual values with mean ± SD, iPSC line#1: dark blue dots, n = 2 and iPSC line#2: blue squares, n = 3. Gating strategy and representative plots can be found in Supplementary Fig. S1). D Gene expression analysis of key genes for pluripotency (POU5F1 (OCT4)), hemato-endothelial progenitors (SOX17), and hematopoietic progenitors (RUNX1) at different stages of differentiation as well as in hiPSC-derived macrophages (iPSC-Mac) by qRT-PCR. Values are represented as relative RNA expression to GAPDH (housekeeping gene) (individual values with mean ± SD, iPSC line#1: dark blue dots, and iPSC line#2: blue squares, n = 2–3 per line, n.d. indicates detection limit of the target gene)
Fig. 2
Fig. 2
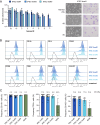
Phenotypic characterization of iPSC-derived macrophages continuously produced in intermediate scale bioreactors. A Number of viable cells harvested from the intermediate scale bioreactor for three different iPSC lines (iPSC line#1: n = 2, iPSC line#2: n = 2, iPSC line#3: n = 1, all individual values with mean +/− SD) over a time span of 7 weeks. Representative brightfield images and cytospin staining for iPSC-derived macrophages (iPSC-Mac) derived from harvest #1b, 3 and 5 for iPSC line#1. B Representative flow cytometry analysis of CD45, CD11b, CD14, CD163, CD206, CD86, HLA-DR and CD66b expression on iPSC-Mac from harvest #5. Histograms represent unstained iPSC-Mac (black line), and stained iPSC-Mac derived from iPSC line#1 (dark blue filled), iPSC line#2 (blue filled) and iPSC line#3 (light blue filled). Cells were pre-gated for viable cells according to FSC/SSC properties as well as single cells using SSC-A/SSC-H (see Fig S2B for gating strategy). C Frequency of CD11b+, CD14+ and CD163+ cells derived from different harvests/differentiations of the three different hiPSC lines as well as primary monocyte-derived macrophages. Individual values with mean ± SD, n = 5–15). Coefficient of variation (CV) is given for all values
Fig. 3
Fig. 3
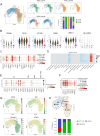
Single Cell transcriptomic analysis of iPSC-Mac from different hiPSC lines. A Uniform Manifold Approximation and Projection (UMAP) representing unsupervised clustering overlaying hiPSC lines #1, #2, and #3. Additional UMAP representation for each iPSC line. Bar chart representation demonstrating the ratios of each cluster in each line independently. B Violin plots demonstrating expression of ITGAM, CD14, CD163, CD86, MRC1/CD206, HLA-DRA for each cluster. C Expression of conserved lineage markers specific to macrophages (adapted from [40]) within the different clusters. D Heatmap representing the predicted probabilities of cell types. Cluster annotations were predicted using logistic regression classifiers trained on publicly available data [56]. E Gene list of macrophage polarization state M1, M2a, M2b and M2d (adapted from [57]). F Gene list of IFNγ fingerprint (adapted from [52]). G UMAP demonstrating global expression of pro and anti-inflammatory genes (APOE, MX1, RNASE1, STAB1) H Paga plot velocity graph annotate clusters M1, interim, and M2 cell states of macrophages. Bar chart representation demonstrating the ratios of M1, M2 and interim population produced from each line independently
Fig. 4
Fig. 4
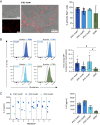
iPSC-Mac demonstrate important pro-inflammatory functionality. A Phagocytosis of pHrodo™ Red E. coli BioParticles. Different iPSC-Mac as well as primary Mac were incubated with pHrodo™ Red E. coli BioParticles for 2 h at 37 °C. Subsequently, phagocytosis was evaluated by the induction of a red fluorescent signal after acidification of the pH-sensitive pHrodo™ Red in the phagolysosome. Left: Representative fluorescence microscopy of iPSC-Mac derived from iPSC line#1 incubated for 2 h with pHrodo™ Red E. coli BioParticles (fluorescence only, brightfield as well as overlay, scale bar = 100 µm). Right: Frequency of pHrodo Red+ cells derived from different harvests/differentiations of the three different hiPSC lines as well as primary monocyte-derived macrophages analyzed by flow cytometry (Individual values with mean ± SD, n = 5–15). B Production of reactive oxygen species (ROS) by macrophages from the different sources. Different iPSC-Mac as well as monocyte derived macrophages (MDM) were incubated with PMA for 5 min and subsequently stained with Dihydrorhodamine (DHR). Left: Representative flow cytometry data for iPSC-Mac derived from the different iPSC lines#1–3 as well as primary Mac (grey: unstimulated; stained and colored filled: respective macrophages stimulated with PMA and stained). Right: Fold change of Rhodamine mean fluorescence intensity (MFI) for iPSC-Mac derived from different harvests/differentiations of the three different hiPSC lines as well as primary monocyte-derived macrophages analyzed by flow cytometry (Individual values with mean ± SD, n = 4–11, dotted line indicates “1”), C Secretion of IL-6 after stimulation with Lipopolysaccharide (LPS). Different iPSC-Mac as well as primary Mac were stimulated with 500 ng/ml LPS for 4 h and supernatants were analyzed for secretion of IL-6 by ELISA. Left: IL-6 levels secreted by iPSC-Mac from the three different iPSC lines for the individual harvests. Right: IL-6 secretion for iPSC-Mac derived from different harvests/differentiations of the three different hiPSC lines as well as primary monocyte-derived macrophages (Individual values with mean ± SD, n = 3–15). Statistical analysis was performed using one-way ANOVA with Tukey’s multi comparisons test (*p < 0.05, **p < 0.01, ***p < 0.001, ****p < 0.0001, ns denotes not significant)
Fig. 5
Fig. 5
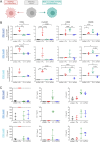
Polarization of iPSC-Mac into different pro- and anti-inflammatory activation stages. A Schematic representation of the experimental layout. iPSC-Mac from the three iPSC-lines were polarized in vitro by the stimulation with 25 ng/ml IFNy into pro-inflammatory M1(IFNy) macrophages or with 10 ng/mL IL-4 or IL-10/TGFb into anti-inflammatory M2(IL-4) or M2 (IL10/TGFb) iPSC-Mac. B Changes in surface marker expression of CD64, HLA-DR, CD86 and CD206 24 h after polarization analyzed by flow cytometry. Values are given as fold change in the median fluorescence intensity (MFI) compared to non-stimulated cells (Individual values with mean ± SD, n = 4 for iPSC line#1, n = 3 for iPSC line#2 and 3). Statistical analysis was performed using one-way ANOVA with Tukey’s multi comparisons test (*p < 0.05, **p < 0.01, ***p < 0.001, ****p < 0.0001, ns denotes not significant). C Secretion of IP10, CCL17 and IL10 24 h after polarization analyzed by Legendplex technology (Individual values with mean ± SD, n = 4 for iPSC line#1, n = 3 for iPSC line#2 and 3, dotted lines depict upper (IP10) or lower (CCL17) detection limits)
Fig. 6
Fig. 6
iPSC-Mac as a model system for the testing of immunodulatory drugs. Different iPSC-Mac as well as primary Mac were stimulated with increasing concentrations of LPS (0, 1, 10, 100 and 500 ng/ml) with or without the simultaneous addition of 1 ug/ml Dexamethasone for 4 h. Levels of IL-6 secretion were determined in supernatants using ELISA. (Individual values with mean ± SD, n = 3. Statistical Analysis was performed using two-way ANOVA with Sidak’s multi comparisons test (*p < 0.05, **p < 0.01, ***p < 0.001, ****p < 0.0001, ns denotes not significant)

References

    1. Deinsberger J, Reisinger D, Weber B. Global trends in clinical trials involving pluripotent stem cells: a systematic multi-database analysis. NPJ Regen Med. 2020;5:15. doi: 10.1038/s41536-020-00100-4. - DOI - PMC - PubMed
    1. Yamanaka S. Pluripotent stem cell-based cell therapy-promise and challenges. Cell Stem Cell. 2020;27(4):523–531. doi: 10.1016/j.stem.2020.09.014. - DOI - PubMed
    1. Saleh F, Mondeh-Lowor R, de Peppo GM. Xeno-free cultivation of human induced pluripotent stem cells for clinical applications. Methods in iPSC Technology. Elsevier; 2021. p. 309–41.
    1. Vandana JJ, Manrique C, Lacko LA, Chen S. Human pluripotent-stem-cell-derived organoids for drug discovery and evaluation. Cell Stem Cell. 2023;30(5):571–591. doi: 10.1016/j.stem.2023.04.011. - DOI - PMC - PubMed
    1. Dutta D, Heo I, Clevers H. Disease modeling in stem cell-derived 3D organoid systems. Trends Mol Med. 2017;23(5):393–410. doi: 10.1016/j.molmed.2017.02.007. - DOI - PubMed

Publication types