. 2024 Aug;11(30):e2309712.
doi: 10.1002/advs.202309712. Epub 2024 Jun 17.

Helicobacter Pylori-Enhanced hnRNPA2B1 Coordinates with PABPC1 to Promote Non-m6A Translation and Gastric Cancer Progression

Affiliations

Helicobacter Pylori-Enhanced hnRNPA2B1 Coordinates with PABPC1 to Promote Non-m6A Translation and Gastric Cancer Progression

Yi Yu et al. Adv Sci (Weinh). 2024 Aug.

Abstract

Helicobacter pylori (H. pylori) infection is the primary risk factor for the pathogenesis of gastric cancer (GC). N6-methyladenosine (m6A) plays pivotal roles in mRNA metabolism and hnRNPA2B1 as an m6A reader is shown to exert m6A-dependent mRNA stabilization in cancer. This study aims to explore the role of hnRNPA2B1 in H. pylori-associated GC and its novel molecular mechanism. Multiple datasets and tissue microarray are utilized for assessing hnRNPA2B1 expression in response to H. pylori infection and its clinical prognosis in patients with GC. The roles of hnRNPA2B1 are investigated through a variety of techniques including glucose metabolism analysis, m6A-epitranscriptomic microarray, Ribo-seq, polysome profiling, RIP-seq. In addition, hnRNPA2B1 interaction with poly(A) binding protein cytoplasmic 1 (PABPC1) is validated using mass spectrometry and co-IP. These results show that hnRNPA2B1 is upregulated in GC and correlated with poor prognosis. H. pylori infection induces hnRNPA2B1 upregulation through recruiting NF-κB to its promoter. Intriguingly, cytoplasm-anchored hnRNPA2B1 coordinated PABPC1 to stabilize its relationship with cap-binding eIF4F complex, which facilitated the translation of CIP2A, DLAT and GPX1 independent of m6A modification. In summary, hnRNPA2B1 facilitates the non-m6A translation of epigenetic mRNAs in GC progression by interacting with PABPC1-eIF4F complex and predicts poor prognosis for patients with GC.

Keywords: Helicobacter pylori; gastric cancer; hnRNPA2B1; non‐m6A; translation.


Conflict of interest statement

The authors declare no conflict of interest.

Figures

Figure 1
Figure 1
The expression and clinical prognosis of hnRNPA2B1 in patients with GC. A) Analyses of each 2 GEO datasets from tumor versus normal (TN) and H. pylori (HP) cohorts. Hierarchical clustering heatmap and volcano plots of differentially expressed genes (DEGs) between TN and HP cohorts. Overlapping TN cohorts and HP cohorts initially identified 28 DEGs including 18 up‐regulated DEGs. B,C) Kaplan‐Meier plotter analysis of the association of hnRNPA2B1 expression with overall survival (OS, B) and post‐progression survival (PPS, C) in patients with GC, respectively. D) Analyses of TCGA pan‐cancer database displayed diverse mRNA expression patterns of hnRNPA2B1 across multiple cancer types. E) Analyses of multiple public GEO datasets showed the increased mRNA levels of hnRNPA2B1 in GC samples. F) GEO datasets showed the mRNA expression levels of hnRNPA2B1 in paired tumor and adjacent normal tissues. G) Representative IHC staining of hnRNPA2B1 in human GC and normal tissues from TMA analysis, and the histogram depicting the distribution of hnRNPA2B1 staining scores in TMA cohort. H) Kaplan‐Meier survival analysis of the association of hnRNPA2B1 with OS in GC patients from TMA cohort. * p < .05, ** p < .01, *** p < .001, **** p < .0001.
Figure 2
Figure 2
H. pylori infection enhanced the transcriptional expression of hnRNPA2B1 via recruiting NF‐κB. A) Representative IHC staining and scores of hnRNPA2B1 in H. pylori‐negative (HP−; n = 20) and H. pylori‐positive (HP+; n = 20) GC patients. B) GSEA analysis of the downstream signaling of H. pylori infection, such as NF‐κB signaling according to hnRNPA2B1 expression in TCGA dataset. NES, normalization enrichment score; FDR, false discovery rate. C) The transcription factor binding sites were predicted by the UCSC and PROMO websites using a 2000‐bp conserved segment of the hnRNPA2B1 promoter. D,E) Western blot and RT‐qPCR analysis in MKN45 and AGS cells following H. pylori SS1 infection; F,G) Western blot and RT‐qPCR analysis in MKN45 and AGS cells following H. pylori TN2GF4 infection; (H) A scheme and a table showing 2 putative NF‐κB transcription factor binding sites on the hnRNPA2B1 promoter (P1 and P2). I) CUT&Tag assays using NF‐κB antibody were performed and quantified by RT‐qPCR on primers covering P1 and p2 region. J,K) Western blots and RT‐qPCR analysis in MKN45 and AGS cells treated with LPS (J) or SC75741 (K). * p < .05, ** p < .01, *** p< .001.
Figure 3
Figure 3
hnRNPA2B1 remodeled metabolic reprogramming in GC cells under H. pylori infection. A) GSVA analysis of genes divided into hnRNPA2B1‐high group versus hnRNPA2B1‐low group in the TCGA. (B‐E) The effects of hnRNPA2B1 KD on glucose uptake B), pyruvate C) and lactate production(D), and NADP+/NADPH ratio E) in MKN45 and AGS cells uninfected or infected with H. pylori (SS1 and TN2GF4) were determined, respectively. F) Representative 18F‐FDG PET/CT images in GC patients exhibiting varying expression of hnRNPA2B1. * p < .05, ** p < .01, *** p < .001, **** p < .0001.
Figure 4
Figure 4
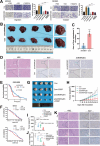
hnRNPA2B1 KD reduced GC invasion and metastasis and favored CDDP chemosensitivity. A) Transwell analysis of the effects of hnRNPA2B1 KD on cell migration (left) and invasion (right) abilities in uninfected or H. pylori (SS1 and TN2GF4) infected MKN45 cells. B) Images (left) and representative images (right) of metastatic liver tumors from mice receiving spleen injection with MKN45‐Con and MKN45‐shhnRNPA2B1 cells (n = 4 per group). C) The percentages of liver surfaces occupied by macro‐metastatic nodules were quantified (n = 4 per group). D) Representative images of H&E staining and Ki67, hnRNPA2B1 IHC staining for metastatic liver tumors. E) A negative correlation of hnRNPA2B1 high expression with the OS of GC patients undergoing cisplatin‐based chemotherapy in GEO datasets. (F) Effects of hnRNPA2B1 KD on the viability of MKN45 and AGS cells treated with CDDP were detected by CCK8 assays. (G) The effects of shhnRNPA2B1 combined with CDDP treatment on tumor growth of MKN45 cells (n = 4 per group). H–J) Tumor growth curve H) Tumor volume I) and weight J) were measured. K) Representative images of H&E staining and Ki‐67 IHC staining for xenograft tumors. * p < .05, ** p < .01, *** p < .001.
Figure 5
Figure 5
hnRNPA2B1 functioned as an oncogenic regulator of mRNA translation independent of m6A modification. A) Comparison between m6A‐modified genes regulated by hnRNPA2B1 and hnRNPA2B1‐bound genes identified by hnRNPA2B1 RIP–seq. B) GO analysis of the enriched signaling pathways in “hnRNPA2B1‐only” group (deleting the m6A modified genes from hnRNPA2B1‐RIP–seq). C) Schematic diagram of the hnRNPA2B1‐WT and m6A catalytically inactive (hnRNPA2B1‐Mut) constructs. (D‐I) The effects of hnRNPA2B1‐WT and hnRNPA2B1‐Mut transduced on glucose uptake D), pyruvate E) and lactate production F), NADP+/NADPH ratio (G), cellular proliferation rates (H), migration and invasion I) in MKN45 cells. J) Schematic of polysome profiling. K) Representative polysome profiling analyses in MKN45 cells transfected with Con, hnRNPA2B1‐WT, and hnRNPA2B1‐Mut. L) Representative polysome profiling analyses in MKN45 cells transfected with Con and shhnRNPA2B1. M) Cumulative‐distribution‐function plot depicting log2fold changes of translation efficiency between shhnRNPA2B1 and control groups. N) GO analysis of the enriched signaling pathways in hnRNPA2B1 translationally activated genes. ** p < .01, *** p < .001, **** p < .0001.
Figure 6
Figure 6
hnRNPA2B1 interacted with PABPC1 to promote the mRNA circularization and non‐m6A translation initiation in GC cells. A) List of translation‐related proteins in hnRNPA2B1 interactome identified by MS. B) Immunofluorescence of hnRNPA2B1 (red) colocalized with PABPC1 (green) in MKN45 and AGS. Nuclei were stained with DAPI (blue). C) hnRNPA2B1 Co‐IP with PABPC1 (up) and PABPC1 Co‐IP with hnRNPA2B1 (down) in MKN45 cells. D) hnRNPA2B1 Co‐IP with PABPC1 (up) and PABPC1 Co‐IP with hnRNPA2B1 (down) in MKN45 cells with or without RNase A treatment. E) hnRNPA2B1 Co‐IP with PABPC1 and eIF4F complex. F) Schematic diagram of hnRNPA2B1‐induced translational activation of mRNAs coupled with PABPC1. G) hnRNPA2B1 Co‐IP with PABPC1 and eIF4F complex in MKN45 cells, either with or without si‐PABPC1 treatment. H) PABPC1 Co‐IP with hnRNPA2B1 and eIF4F complex in MKN45‐NC and MKN45‐shhnRNPA2B1 cells. I) PABPC1 Co‐IP with hnRNPA2B1 and eIF4F complex in hnRNPA2B1‐WT or hnRNPA2B1‐Mut transduced hnRNPA2B1 knockdown MKN45 cells.
Figure 7
Figure 7
hnRNPA2B1 interacted with PABPC1 to promote the non‐m6A translation of oncogenic mRNAs in GC cells. A) Venn diagram depicting the overlap of translationally regulated genes mediated by hnRNPA2B1 through “hnRNPA2B1‐only” and Ribo‐seq and those mediated by PABPC1 by PABPC1‐RIP–seq and Ribo‐seq. B) MeRIP–qPCR analysis of the m6A levels of GPX1, DLAT, and CIP2A in MKN45 and AGS cells. C) RIP–qPCR analysis of the enrichment levels of GPX1, DLAT, and CIP2A by hnRNPA2B1 and PABPC1 proteins in MKN45 and AGS cells. D,E) Western blot analysis of GPX1, DLAT, and CIP2A expression in shhnRNPA2B1 (D, left), or hnRNPA2B1‐WT/ hnRNPA2B1‐Mut (D, right) or siPABPC1 E) transfected MKN45 and AGS cells. F) Schematic diagram of the H. pylori‐enhanced hnRNPA2B1 promoting the oncogenic mRNA translation by coordinating with PABPC1‐eIF4F complex independent of m6A modification in GC progression. * p < .05, ** p < .01, *** p < .001. ns, not significant.

References

    1. Joshi S. S., Badgwell B. D., Ca‐Cancer J. Clin. 2021, 71, 264. - PMC - PubMed
    1. Smyth E. C., Nilsson M., Grabsch H. I., van Grieken N. C. T., Lordick F., Lancet 2020, 396, 635. - PubMed
    1. Alsina M., Arrazubi V., Diez M., Tabernero J., Nat. Rev. Gastroenterol. Hepatol. 2022, 20, 155. - PubMed
    1. Chen X.‐Y., Zhang J., Zhu J.‐S., Mol. Cancer 2019, 18, 103. - PMC - PubMed
    1. Jiang X., Liu B., Nie Z., Duan L., Xiong Q., Jin Z., Yang C., Chen Y., Signal Transduction Targeted Ther. 2021, 6, 74. - PMC - PubMed

MeSH terms

LinkOut - more resources