. 2024 Jun;30(6):e14806.
doi: 10.1111/cns.14806.

GIP attenuates neuronal oxidative stress by regulating glucose uptake in spinal cord injury of rat

Affiliations

GIP attenuates neuronal oxidative stress by regulating glucose uptake in spinal cord injury of rat

Beibei Guo et al. CNS Neurosci Ther. 2024 Jun.

Abstract

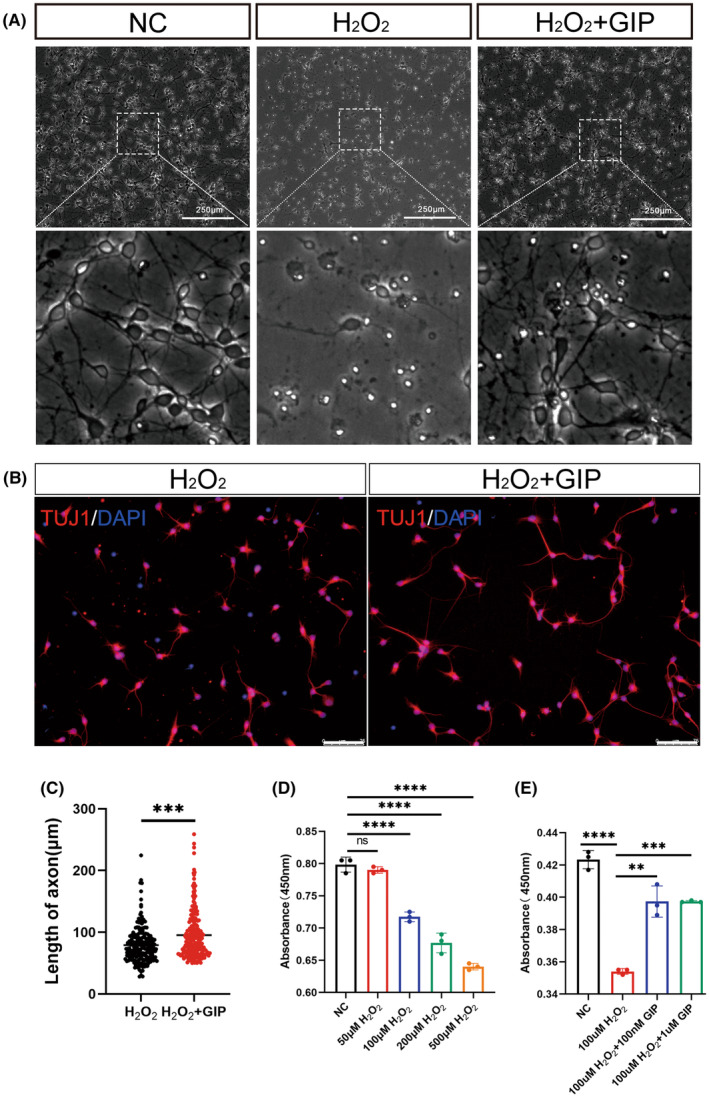
Aim: Glucose-dependent insulinotropic polypeptide (GIP) is a ligand of glucose-dependent insulinotropic polypeptide receptor (GIPR) that plays an important role in the digestive system. In recent years, GIP has been regarded as a hormone-like peptide to regulate the local metabolic environment. In this study, we investigated the antioxidant role of GIP on the neuron and explored the possible mechanism.

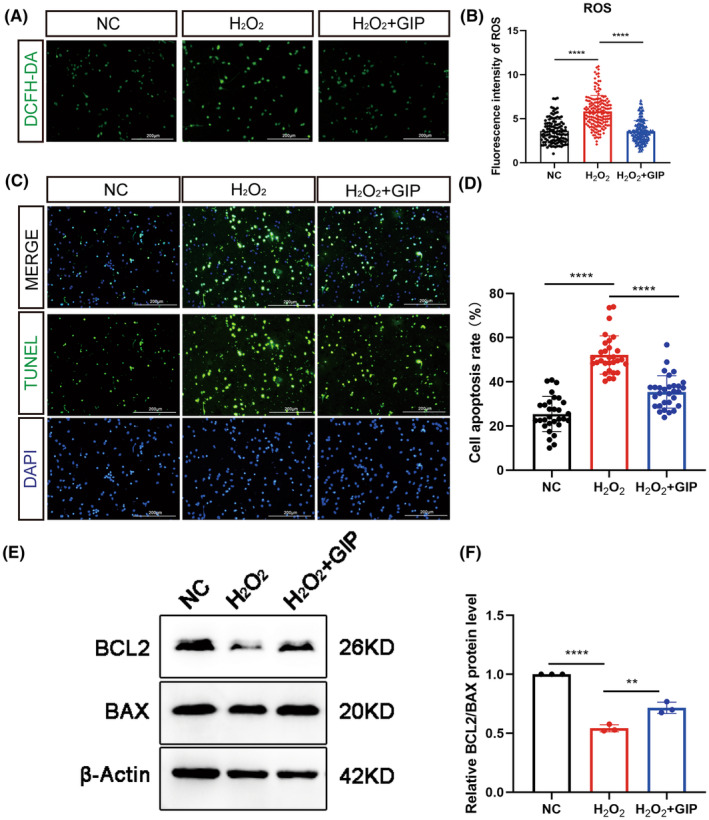
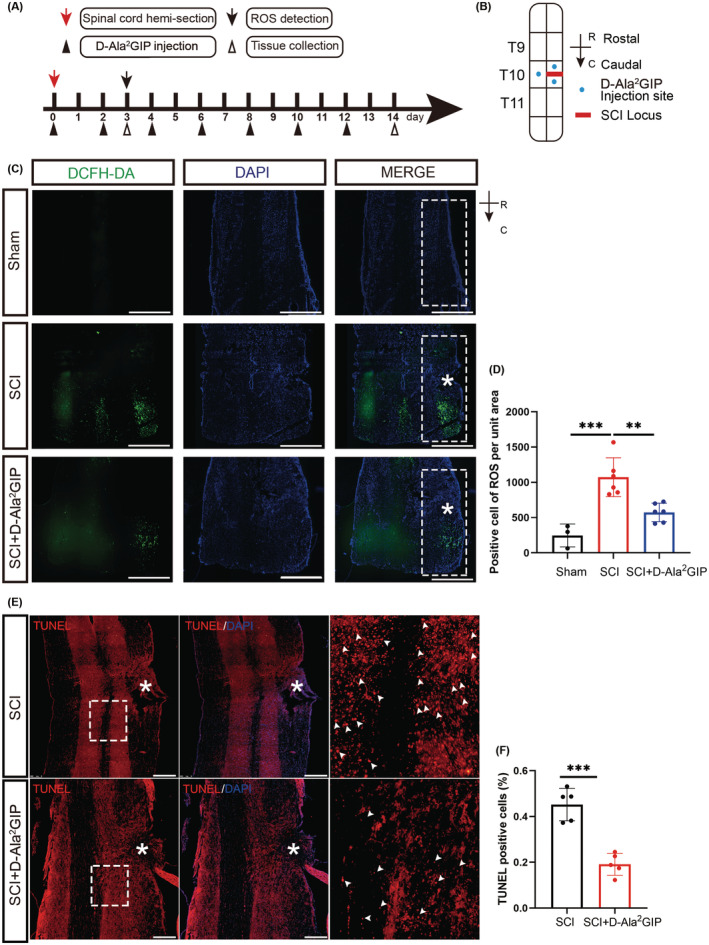
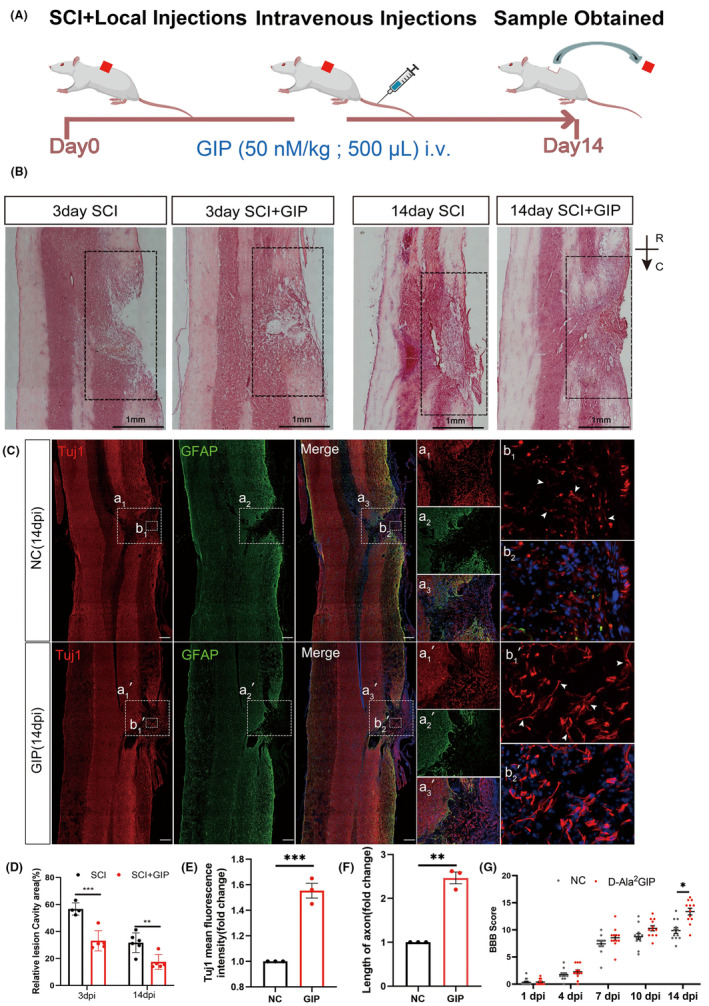
Methods: Cell counting Kit-8 (CCK-8) was used to measure cell survival. TdT-mediated dUTP Nick-End Labeling (TUNEL) was used to detect apoptosis in vitro and in vivo. Reactive oxygen species (ROS) levels were probed with 2', 7'-Dichloro dihydrofluorescein diacetate (DCFH-DA), and glucose intake was detected with 2-NBDG. Immunofluorescence staining and western blot were used to evaluate the protein level in cells and tissues. Hematoxylin-eosin (HE) staining, immunofluorescence staining and tract-tracing were used to observe the morphology of the injured spinal cord. Basso-Beattie-Bresnahan (BBB) assay was used to evaluate functional recovery after spinal cord injury.

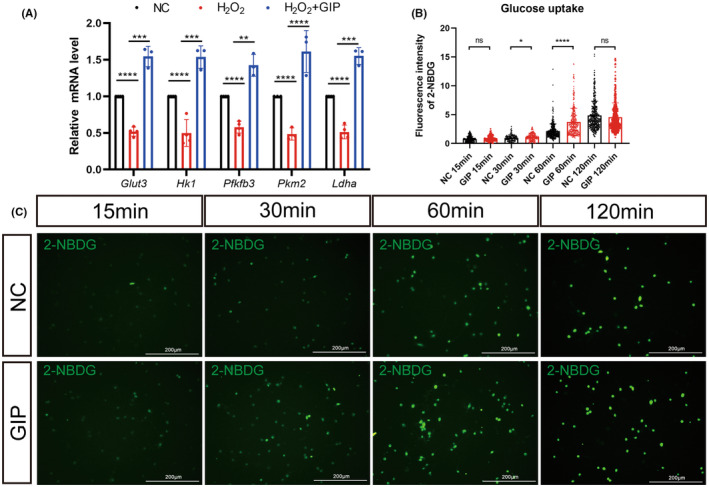
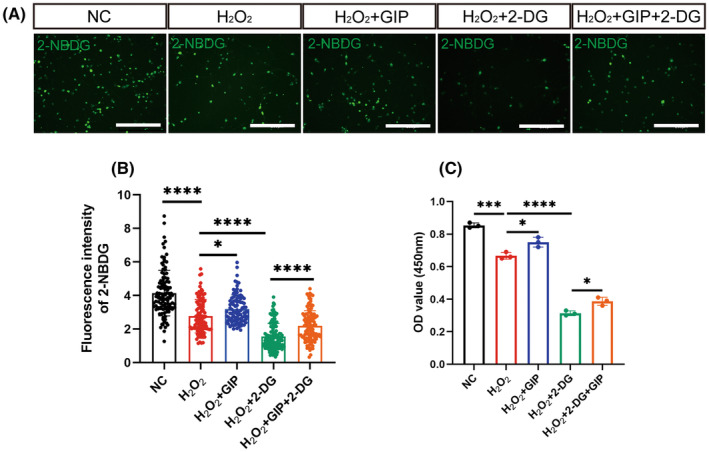
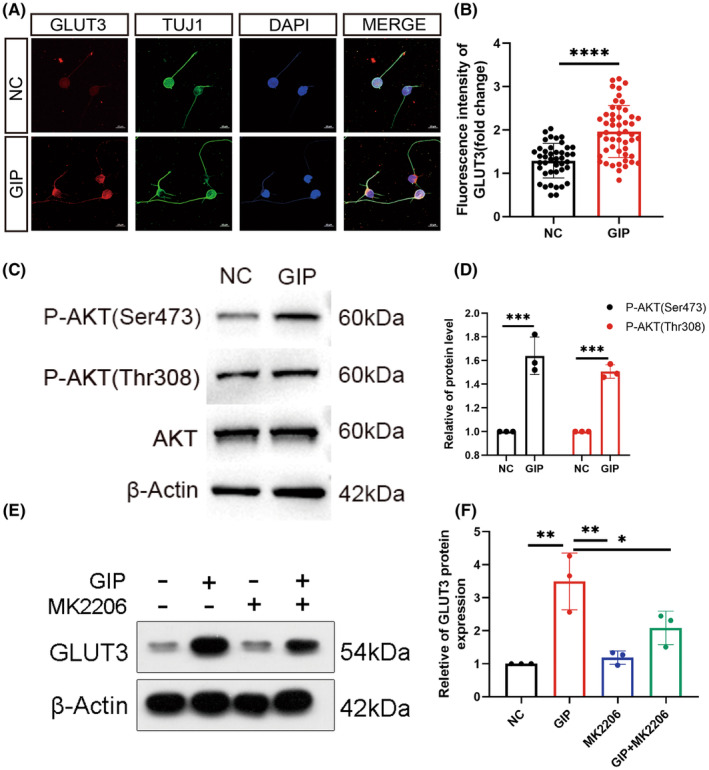
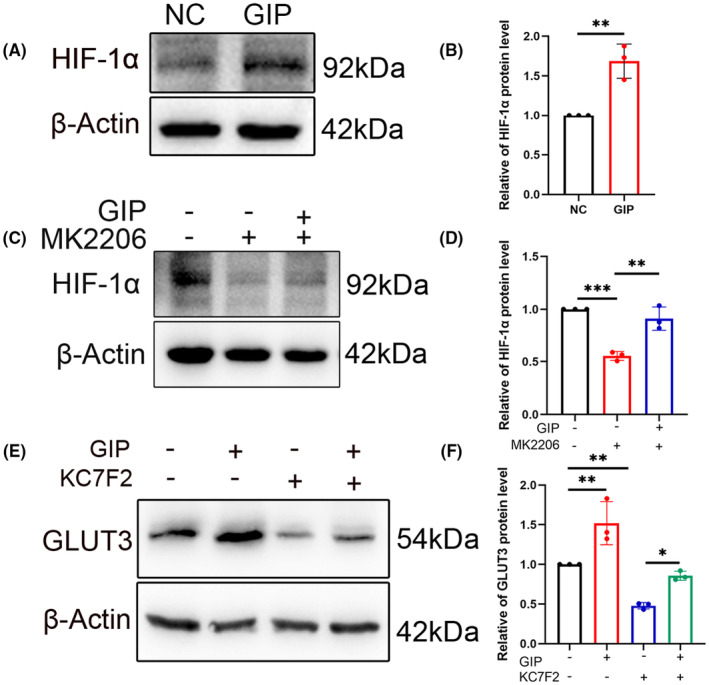
Results: GIP reduced the ROS level and protected cells from apoptosis in cultured neurons and injured spinal cord. GIP facilitated wound healing and functional recovery of the injured spinal cord. GIP significantly improved the glucose uptake of cultured neurons. Meanwhile, inhibition of glucose uptake significantly attenuated the antioxidant effect of GIP. GIP increased glucose transporter 3 (GLUT3) expression via up-regulating the level of hypoxia-inducible factor 1α (HIF-1α) in an Akt-dependent manner.

Conclusion: GIP increases GLUT3 expression and promotes glucose intake in neurons, which exerts an antioxidant effect and protects neuronal cells from oxidative stress both in vitro and in vivo.

Keywords: Akt; GIP; HIF‐1α; glucose transporter; oxidative stress; spinal cord injury.


Conflict of interest statement

The authors declared that they have no conflicts of interest with the contents of this article.

Figures

FIGURE 1
FIGURE 1
GIP restored the cell viability of primary cultured E18 cortical neurons after oxidative damage. (A) Representative images of neurons after 3 h of H2O2 injury and 24 h of GIP treatment. The enlarged views of dotted boxes were shown in the down panel. Scale Bar = 250 μm. (B) Representative images of neurons stained with anti‐TUJ1 (red), DAPI (blue) after 3 h of H2O2 injury and 24 h of GIP treatment. Scale Bar = 75 μm. (C) GIP increased the length of the axon. The data were shown as mean ± SE, and were analyzed by Student's t‐test, n = 200–220 neurons for each group per test, N = 3 (cells were from rats interpedently). ***p < 0.001. (D) Cell viability was evaluated by CCK8 assay after treatment with different concentrations of H2O2. The data were shown as mean ± SE, and were analyzed by one‐way ANOVA, n = 3, ns represents no statistical difference, ****p < 0.0001. (E) GIP attenuates the detrimental effect of H2O2 on cultured neurons. Neurons were treated with 100 μM H2O2 for 3 h and treated with 100 nM or 1 μM GIP for 24 h. The data were shown as mean ± SE, and were analyzed by one‐way ANOVA, n = 3. **p < 0.01, ***p < 0.001, ****p < 0.0001.
FIGURE 2
FIGURE 2
Effect of GIP on the ROS level in neurons under oxidative stress. (A, B) GIP decreased ROS level after H2O2 treatment. ROS signals were probed by DCFH‐DA. Scale Bar = 200 μm. n = 100–150 neurons for each group per test, N = 3 (cells were from rats interpedently). The data were shown as mean ± SE, and were analyzed by one‐way ANOVA, ****p < 0.0001. (C, D) GIP decreased the number of apoptotic cells. The cell apoptosis was determined by TUNEL assay. n = 30 for each group per test, N = 3. The data were shown as mean ± SE, and were analyzed by one‐way ANOVO, ***p < 0.001, ****p < 0.0001. Scale Bar = 200 μm. (E, F) GIP increased the ratio of BCL2/BAX protein after treatment of H2O2. The data were normalized by negative ctrl (NC) group. n = 3. The data were shown as mean ± SE, and were analyzed by one‐way ANOVA, **p < 0.01, ****p < 0.0001.
FIGURE 3
FIGURE 3
Effect of GIP on oxidative stress in rats with spinal cord hemisection injury. (A) Timeline of spinal cord hemisection injury, D‐Ala2GIP administration, and tissue collection. (B) Model of GIP injection in spinal cord injury. Spinal cord hemisection was conducted at T10. For saline and D‐Ala2GIP treatments, each rat was injected with 3 μL saline or D‐Ala2GIP at three sites. R: Rostral, C: Caudal. (C, D) D‐Ala2GIP decreased ROS level after spinal cord hemisection injury for 3 days. The white “*” shows the injury sites and the white box shows the area for statistics of ROS signal. Scale Bar = 500 μm. Statistical results of ROS‐positive cells were shown. n = 3 for sham group, n = 6 for SCI group and SCI + GIP group. The data were shown as mean ± SE, and were analyzed by one‐way ANOVA, **p < 0.01, ***p < 0.001. (E, F) D‐Ala2GIP decreased the number of apoptotic cells after spinal cord hemisection injury for 14 days. The white “*” shows the injury sites, the white arrows are representative TNUEL‐positive signals, and the images on the right are magnified views of the boxed area. Scale Bar = 250 μm, Statistical result of TUNEL mean fluorescence intensity after spinal cord hemisection injury for 14 days. n = 5 for each group. The data were shown as mean ± SE, and were analyzed by Student's t‐test, ***p < 0.001.
FIGURE 4
FIGURE 4
Effect of D‐Ala2GIP on locomotor function and histomorphology recovery in spinal cord injured rats. (A) Schematic diagram of experiment. D‐Ala2GIP was injected at a dose of 50 nmol/kg. (B, D) GIP reduced the area of the cavity of the injured spinal cord. Representative HE staining and statistical result. The box showed the area of injury. Scale Bar = 1 mm; R: Rostal, C: Caudal. n = 6 for each group. The data were shown as mean ± SE, and were analyzed by two‐way ANOVA post hoc Bonferroni's test, **p < 0.01, ***p < 0.001. (C, E, F) GIP increased the number neurites grown into injured area. Representative immunostaining staining and statistical results of Tuj1 (in red), GFAP (in green) at 14 dpi. Spinal cord was treated with NC or D‐Ala2GIP. Neurons were labeled with Tuj1. The white box shows the injury area and the magnified views are shown in the right panel. Scale Bar = 250 μm. The data were normalized by NC. n = 3 for each group. The data were shown as mean ± SE, and were analyzed by Student's t‐test, **p < 0.01, ***p < 0.001. (G) BBB scores at 1, 4, 7, 10, and 14 days after spinal cord injury. n = 12 for each group. The data were shown as mean ± SE, and were analyzed by two‐way ANOVA post hoc Bonferroni's test, *p < 0.05.
FIGURE 5
FIGURE 5
Effect of GIP on glucose uptake in neurons. (A) GIP increased the mRNA level of Glut3, Hk1, Pfkfb3, Pkm2, and Ldha in neurons after H2O2 treatment. n = 3. The data were normalized by NC and shown as mean ± SE, analyzed by one‐way ANOVA, **p < 0.01, ***p < 0.001, ****p < 0.0001. (B, C) GIP augmented glucose uptake in cultured neurons. Statistical results and representative images were shown in B and C. n = 150 neurons, N = 3 rats, the experiment repeated three times independently. The data were shown as mean ± SE, analyzed by Student's t‐test vs. NC 15 min, NC 30 min, NC 60 min, and NC 120 min, ns represents no statistical difference, *p < 0.05, ****p < 0.0001. C: Scale Bar = 200 μm.
FIGURE 6
FIGURE 6
GIP‐protected neurons from oxidative damage by regulating glucose transport. (A) Representative immunostaining result of 2‐NBDG (Green) after GIP and 2‐DG treatment. Scale Bar = 200 μm. (B) Statistical result of 2‐NBDG fluorescence intensity. n = 100–150 neurons, N = 3 rats. The data were shown as mean ± SE, and were analyzed by one‐way ANOVA, *p < 0.05, ****p < 0.0001. (C) Statistical result of OD value at 450 nm. n = 3. The data were shown as mean ± SE, and were analyzed by one‐way ANOVA, *p < 0.05, ***p < 0.001, ****p < 0.0001.
FIGURE 7
FIGURE 7
GIP up‐regulated GLUT3 expression via Akt pathway. (A, B) GIP increased GLUT3 level in neurons. Representative immunostaining results and statistical result were shown in A and B. Scale Bar = 10 μm. n = 20–50 neurons for each group per test, N = 3 (cells were from 3 rats). The data were normalized by NC and shown as mean ± SE, analyzed by Student's t‐test, ****p < 0.0001. (C, D) GIP treatment resulted in enhanced activation of Akt. The phosphorylation of both Ser473 and Thr308 site was increased. n = 3. The data were normalized by NC and shown as mean ± SE, analyzed by Student's t‐test, ***p < 0.001. (E, F) Akt inhibitor attenuated GIP‐induced upregulation of GLUT3. n = 3. The data were shown as mean ± SE, analyzed by one‐way ANOVA, *p < 0.05, **p < 0.01.
FIGURE 8
FIGURE 8
GIP increased GLUT3 expression via HIF‐1α/Akt pathways in neurons. (A, B) GIP treatment increased HIF‐1α level. n = 3. The data were shown as mean ± SE, analyzed by Student's t‐test, **p < 0.01. (C, D) Akt inhibitor MK2206 reduced HIF‐1α level both in the presence and absence of GIP. n = 3. The data were shown as mean ± SE, analyzed by one‐way ANOVA, **p < 0.01, ***p < 0.001. (E, F) HIF‐1α inhibitor attenuated GIP‐induced upregulation of GLUT3. n = 3. The data were shown as mean ± SE, analyzed by one‐way ANOVA. *p < 0.05, **p < 0.01.

References

    1. Wang HL, Zheng ZL, Han W, et al. Metformin promotes axon regeneration after spinal cord injury through inhibiting oxidative stress and stabilizing microtubule. Oxidative Med Cell Longev. 2020;2020:1‐20. - PMC - PubMed
    1. Wang JY, Chen P, Han GJ, et al. Rab32 facilitates Schwann cell pyroptosis in rats following peripheral nerve injury by elevating ROS levels. J Transl Med. 2024;22(1):194. - PMC - PubMed
    1. Venditti P, Di Meo S. The role of reactive oxygen species in the life cycle of the mitochondrion. Int J Mol Sci. 2020;21(6):2173. - PMC - PubMed
    1. Simmons EC, Scholpa NE, Schnellmann RG. Mitochondrial biogenesis as a therapeutic target for traumatic and neurodegenerative CNS diseases. Exp Neurol. 2020;329:113309. - PMC - PubMed
    1. Gasbjerg LS, Gabe MBN, Hartmann B, et al. Glucose‐dependent insulinotropic polypeptide (GIP) receptor antagonists as anti‐diabetic agents. Peptides. 2018;100:173‐181. - PubMed

Publication types

MeSH terms

Substances