Insight from expression profiles of FT orthologs in plants: conserved photoperiodic transcriptional regulatory mechanisms
- PMID: 38887456
- PMCID: PMC11180818
- DOI: 10.3389/fpls.2024.1397714
Insight from expression profiles of FT orthologs in plants: conserved photoperiodic transcriptional regulatory mechanisms
Abstract
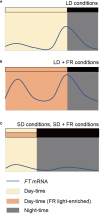
Floral transition from the vegetative to the reproductive stages is precisely regulated by both environmental and endogenous signals. Among these signals, photoperiod is one of the most important environmental factors for onset of flowering. A florigen, FLOWERING LOCUS T (FT) in Arabidopsis, has thought to be a major hub in the photoperiod-dependent flowering time regulation. Expression levels of FT likely correlates with potence of flowering. Under long days (LD), FT is mainly synthesized in leaves, and FT protein moves to shoot apical meristem (SAM) where it functions and in turns induces flowering. Recently, it has been reported that Arabidopsis grown under natural LD condition flowers earlier than that grown under laboratory LD condition, in which a red (R)/far-red (FR) ratio of light sources determines FT expression levels. Additionally, FT expression profile changes in response to combinatorial effects of FR light and photoperiod. FT orthologs exist in most of plants and functions are thought to be conserved. Although molecular mechanisms underlying photoperiodic transcriptional regulation of FT orthologs have been studied in several plants, such as rice, however, dynamics in expression profiles of FT orthologs have been less spotlighted. This review aims to revisit previously reported but overlooked expression information of FT orthologs from various plant species and classify these genes depending on the expression profiles. Plants, in general, could be classified into three groups depending on their photoperiodic flowering responses. Thus, we discuss relationship between photoperiodic responsiveness and expression of FT orthologs. Additionally, we also highlight the expression profiles of FT orthologs depending on their activities in flowering. Comparative analyses of diverse plant species will help to gain insight into molecular mechanisms for flowering in nature, and this can be utilized in the future for crop engineering to improve yield by controlling flowering time.
Keywords: FLOWERING LOCUS T; expression profiles; florigen; flowering plants; photoperiodic flowering.
Copyright © 2024 Lee, Shim, Kang and Kwon.
Conflict of interest statement
The authors declare that the research was conducted in the absence of any commercial or financial relationships that could be construed as a potential conflict of interest.
Figures


Similar articles
-
Enabling photoperiodic control of flowering by timely chromatin silencing of the florigen gene.Nucleus. 2015;6(3):179-82. doi: 10.1080/19491034.2015.1038000. Epub 2015 May 7. Nucleus. 2015. PMID: 25950625 Free PMC article.
-
Phytochrome mediates the external light signal to repress FT orthologs in photoperiodic flowering of rice.Genes Dev. 2002 Aug 1;16(15):2006-20. doi: 10.1101/gad.999202. Genes Dev. 2002. PMID: 12154129 Free PMC article.
-
FE, a phloem-specific Myb-related protein, promotes flowering through transcriptional activation of FLOWERING LOCUS T and FLOWERING LOCUS T INTERACTING PROTEIN 1.Plant J. 2015 Sep;83(6):1059-68. doi: 10.1111/tpj.12951. Plant J. 2015. PMID: 26239308
-
Photoperiodic flowering in Arabidopsis: Multilayered regulatory mechanisms of CONSTANS and the florigen FLOWERING LOCUS T.Plant Commun. 2023 May 8;4(3):100552. doi: 10.1016/j.xplc.2023.100552. Epub 2023 Jan 20. Plant Commun. 2023. PMID: 36681863 Free PMC article. Review.
-
Emerging insights into florigen transport.Curr Opin Plant Biol. 2013 Oct;16(5):607-13. doi: 10.1016/j.pbi.2013.06.001. Epub 2013 Jun 28. Curr Opin Plant Biol. 2013. PMID: 23810436 Review.
Cited by
-
Modeling Floral Induction in the Narrow-Leafed Lupin Lupinus angustifolius Under Different Environmental Conditions.Plants (Basel). 2024 Dec 19;13(24):3548. doi: 10.3390/plants13243548. Plants (Basel). 2024. PMID: 39771246 Free PMC article.
References
-
- Almeida de Jesus D., Batista D. M., Monteiro E. F., Salzman S., Carvalho L. M., Santana K., et al. . (2022). Structural changes and adaptative evolutionary constraints in FLOWERING LOCUS T and TERMINAL FLOWER1-like genes of flowering plants. Front. Genet. 13. doi: 10.3389/fgene.2022.954015 - DOI - PMC - PubMed
-
- Artru S., Lassois L., Vancutsem F., Reubens B., Garré S. (2018). Sugar beet development under dynamic shade environments in temperate conditions. Eur. J. Agron. 97, 38–47. doi: 10.1016/j.eja.2018.04.011 - DOI
Publication types
LinkOut - more resources
Full Text Sources
Research Materials

