BRET-based biosensors for SARS-CoV-2 oligonucleotide detection
- PMID: 38887615
- PMCID: PMC11181354
- DOI: 10.3389/fbioe.2024.1353479
BRET-based biosensors for SARS-CoV-2 oligonucleotide detection
Abstract
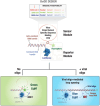
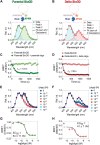
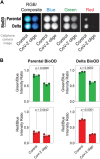
The need for the early detection of emerging pathogenic viruses and their newer variants has driven the urgent demand for developing point-of-care diagnostic tools. Although nucleic acid-based methods such as reverse transcription-quantitative polymerase chain reaction (RT-qPCR) and loop-mediated isothermal amplification (LAMP) have been developed, a more facile and robust platform is still required. To address this need, as a proof-of-principle study, we engineered a prototype-the versatile, sensitive, rapid, and cost-effective bioluminescence resonance energy transfer (BRET)-based biosensor for oligonucleotide detection (BioOD). Specifically, we designed BioODs against the SARS-CoV-2 parental (Wuhan strain) and B.1.617.2 Delta variant through the conjugation of specific, fluorescently modified molecular beacons (sensor module) through a complementary oligonucleotide handle DNA functionalized with the NanoLuc (NLuc) luciferase protein such that the dissolution of the molecular beacon loop upon the binding of the viral oligonucleotide will result in a decrease in BRET efficiency and, thus, a change in the bioluminescence spectra. Following the assembly of the BioODs, we determined their kinetics response, affinity for variant-specific oligonucleotides, and specificity, and found them to be rapid and highly specific. Furthermore, the decrease in BRET efficiency of the BioODs in the presence of viral oligonucleotides can be detected as a change in color in cell phone camera images. We envisage that the BioODs developed here will find application in detecting viral infections with variant specificity in a point-of-care-testing format, thus aiding in large-scale viral infection surveillance.
Keywords: COVID-19; SARS-CoV-2; bioluminescence; bioluminescence resonance energy transfer; biosensor; molecular beacon.
Copyright © 2024 Sultana, Geethakumari, Islam, Kolatkar and Biswas.
Conflict of interest statement
The authors declare that the research was conducted in the absence of any commercial or financial relationships that could be construed as a potential conflict of interest.
Figures


Similar articles
-
A Multiplex and Colorimetric Reverse Transcription Loop-Mediated Isothermal Amplification Assay for Sensitive and Rapid Detection of Novel SARS-CoV-2.Front Cell Infect Microbiol. 2021 Jun 29;11:653616. doi: 10.3389/fcimb.2021.653616. eCollection 2021. Front Cell Infect Microbiol. 2021. PMID: 34268131 Free PMC article.
-
Detection of SARS-CoV-2 RNA using RT-LAMP and molecular beacons.Genome Biol. 2021 Jun 3;22(1):169. doi: 10.1186/s13059-021-02387-y. Genome Biol. 2021. PMID: 34082799 Free PMC article.
-
Development and Clinical Application of a Rapid and Sensitive Loop-Mediated Isothermal Amplification Test for SARS-CoV-2 Infection.mSphere. 2020 Aug 26;5(4):e00808-20. doi: 10.1128/mSphere.00808-20. mSphere. 2020. PMID: 32848011 Free PMC article.
-
Loop-Mediated Isothermal Amplification (LAMP): A Rapid, Sensitive, Specific, and Cost-Effective Point-of-Care Test for Coronaviruses in the Context of COVID-19 Pandemic.Biology (Basel). 2020 Jul 22;9(8):182. doi: 10.3390/biology9080182. Biology (Basel). 2020. PMID: 32707972 Free PMC article. Review.
-
SARS-CoV-2 detection methods: A comprehensive review.Saudi J Biol Sci. 2022 Nov;29(11):103465. doi: 10.1016/j.sjbs.2022.103465. Epub 2022 Sep 27. Saudi J Biol Sci. 2022. PMID: 36186678 Free PMC article. Review.
References
LinkOut - more resources
Full Text Sources
Miscellaneous

