

Incorporating Inflammatory Markers and Clinical Indicators into a Predictive Model of Single Small Hepatocellular Carcinoma Recurrence After Primary Locoregional Treatments
- PMID: 38887683
- PMCID: PMC11182039
- DOI: 10.2147/JHC.S465069
Incorporating Inflammatory Markers and Clinical Indicators into a Predictive Model of Single Small Hepatocellular Carcinoma Recurrence After Primary Locoregional Treatments
Abstract
Purpose: We explored the role of tumor size and number in the prognosis of HCC patients who underwent ablation and created a nomogram based on machine learning to predict the recurrence.
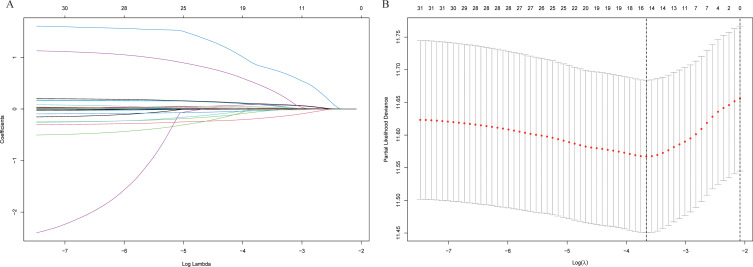
Patients and methods: A total of 990 HCC patients who underwent transcatheter arterial chemoembolization (TACE) combined ablation at Beijing Youan Hospital from January 2014 to December 2021 were prospectively enrolled, including 478 patients with single small HCC (S-S), 209 patients with single large (≥30mm) HCC (S-L), 182 patients with multiple small HCC (M-S), and 121 patients with multiple large HCC (M-L). S-S patients were randomized in a 7:3 ratio into the training cohort (N=334) and the validation cohort (N=144). Lasso-Cox regression analysis was carried out to identify independent risk factors, which were used to construct a nomogram. The performance of the nomogram was evaluated by C-index, receiver operating characteristic (ROC) curves, calibration curves, and decision curve analysis (DCA) curves. Patients in the training and validation cohorts were divided into low-risk, intermediate-risk, and high-risk groups based on the risk scores of the nomogram.
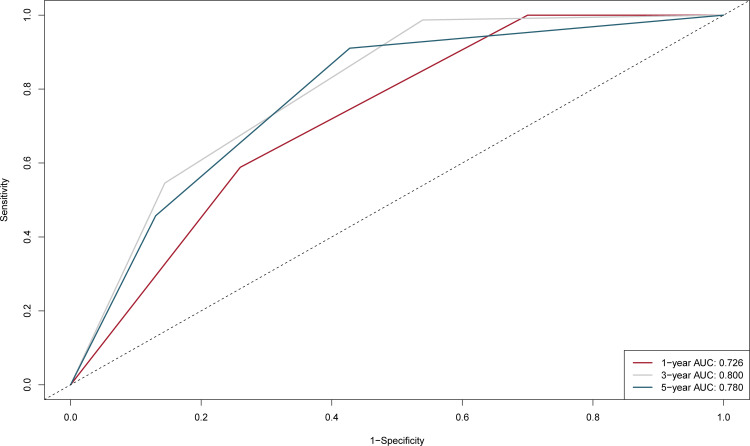
Results: The median recurrence-free survival (mRFS) in S-S patients was significantly longer than the S-L, M-S, and S-L patients (P<0.0001). The content of the nomogram includes age, monocyte-to-lymphocyte (MLR), gamma-glutamyl transferase-to-lymphocyte (GLR), International normalized ratio (INR), and Erythrocyte (RBC). The C-index (0.704 and 0.71) and 1-, 3-, and 5-year AUCs (0.726, 0.800, 0.780, and 0.752, 0.761, 0.760) of the training and validation cohorts proved the excellent predictive performance of the nomogram. Calibration curves the DCA curves showed that the nomogram had good consistency and clinical utility. There were apparent variances in RFS between the low-risk, intermediate-risk, and high-risk groups (P<0.0001).
Conclusion: S-S patients who underwent ablation had the best prognosis. The nomogram developed and validated in the study had good predictive ability for S-S patients.
Keywords: HCC; TACE; ablation; hepatocellular carcinoma; nomogram; recurrence; transcatheter arterial chemoembolization.
© 2024 Qiao et al.
Conflict of interest statement
The authors report no competing interests in this work.
Figures


Similar articles
-
Recurrence of Hepatocellular Carcinoma in Patients with Low Albumin-Bilirubin Grade in TACE Combined with Ablation: A Random Forest Cox Predictive Model.J Hepatocell Carcinoma. 2024 Jul 8;11:1375-1388. doi: 10.2147/JHC.S465962. eCollection 2024. J Hepatocell Carcinoma. 2024. PMID: 39005969 Free PMC article.
-
Construction and validation of a machine learning-based nomogram to predict the prognosis of HBV associated hepatocellular carcinoma patients with high levels of hepatitis B surface antigen in primary local treatment: a multicenter study.Front Immunol. 2024 Mar 27;15:1357496. doi: 10.3389/fimmu.2024.1357496. eCollection 2024. Front Immunol. 2024. PMID: 38601167 Free PMC article.
-
Development and validation of a nomogram to predict the recurrence of hepatocellular carcinoma patients with dynamic changes in AFP undergoing locoregional treatments.Front Oncol. 2023 Aug 28;13:1206345. doi: 10.3389/fonc.2023.1206345. eCollection 2023. Front Oncol. 2023. PMID: 37700838 Free PMC article.
-
Prognostic model for predicting recurrence in hepatocellular carcinoma patients with high systemic immune-inflammation index based on machine learning in a multicenter study.Front Immunol. 2024 Sep 9;15:1459740. doi: 10.3389/fimmu.2024.1459740. eCollection 2024. Front Immunol. 2024. PMID: 39315112 Free PMC article.
-
Development and Validation of a Nomogram to Predict the Recurrence of HCC Patients Undergoing CECT After Ablation.J Hepatocell Carcinoma. 2024 Jan 13;11:65-79. doi: 10.2147/JHC.S441540. eCollection 2024. J Hepatocell Carcinoma. 2024. PMID: 38235069 Free PMC article.
Cited by
-
Prognostic predictive value of the preoperative systemic immunoinflammatory index combined with the neutrophil-to-lymphocyte ratio in patients with primary liver cancer undergoing transarterial chemoembolization.Oncol Lett. 2025 Jun 27;30(3):414. doi: 10.3892/ol.2025.15160. eCollection 2025 Sep. Oncol Lett. 2025. PMID: 40630711 Free PMC article.
References
LinkOut - more resources
Full Text Sources
Miscellaneous
