. 2024 Jun;13(6):e12465.
doi: 10.1002/jev2.12465.

Stress-induced Rab11a-exosomes induce amphiregulin-mediated cetuximab resistance in colorectal cancer

Affiliations

Stress-induced Rab11a-exosomes induce amphiregulin-mediated cetuximab resistance in colorectal cancer

John D Mason et al. J Extracell Vesicles. 2024 Jun.

Erratum in

Abstract

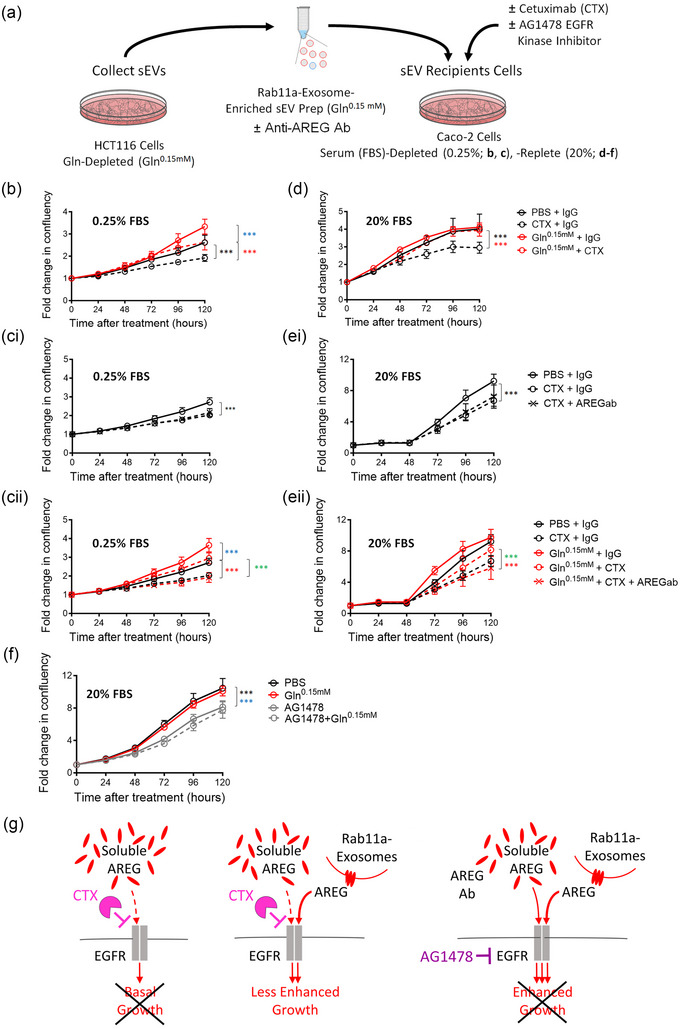
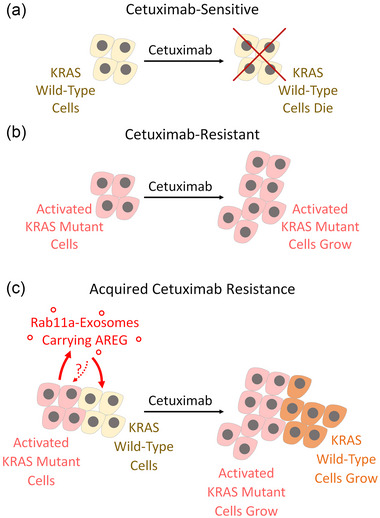
Exosomes are secreted vesicles made intracellularly in the endosomal system. We have previously shown that exosomes are not only made in late endosomes, but also in recycling endosomes marked by the monomeric G-protein Rab11a. These vesicles, termed Rab11a-exosomes, are preferentially secreted under nutrient stress from several cancer cell types, including HCT116 colorectal cancer (CRC) cells. HCT116 Rab11a-exosomes have particularly potent signalling activities, some mediated by the epidermal growth factor receptor (EGFR) ligand, amphiregulin (AREG). Mutant activating forms of KRAS, a downstream target of EGFR, are often found in advanced CRC. When absent, monoclonal antibodies, such as cetuximab, which target the EGFR and block the effects of EGFR ligands, such as AREG, can be administered. Patients, however, inevitably develop resistance to cetuximab, either by acquiring KRAS mutations or via non-genetic microenvironmental changes. Here we show that nutrient stress in several CRC cell lines causes the release of AREG-carrying Rab11a-exosomes. We demonstrate that while soluble AREG has no effect, much lower levels of AREG bound to Rab11a-exosomes from cetuximab-resistant KRAS-mutant HCT116 cells, can suppress the effects of cetuximab on KRAS-wild type Caco-2 CRC cells. Using neutralising anti-AREG antibodies and an intracellular EGFR kinase inhibitor, we show that this effect is mediated via AREG activation of EGFR, and not transfer of activated KRAS. Therefore, presentation of AREG on Rab11a-exosomes affects its ability to compete with cetuximab. We propose that this Rab11a-exosome-mediated mechanism contributes to the establishment of resistance in cetuximab-sensitive cells and may explain why in cetuximab-resistant tumours only some cells carry mutant KRAS.

Keywords: AREG; EGFR; Rab11a‐exosome; cetuximab; colorectal cancer; extracellular vesicle.


Conflict of interest statement

The authors declare that they have no conflicts of interest in relation to this work.

Figures

FIGURE 1
FIGURE 1
Inhibition of mTORC1 induces secretion of Rab11a‐exosomes in multiple CRC cell lines. (a) Classification of the four CRC cell lines investigated based on molecular pathways and mutational status in critical oncogenes and tumour suppressor genes. (b) Western blot analysis of sEVs isolated from HCT116 cells cultured in glutamine‐depleted (Gln0.15 mM) versus control glutamine‐replete (Gln2 mM) conditions. Note characteristic increase in Rab11a, AREG and Cav‐1 levels and the reduction in CD63 that are consistently observed (see histogram, where changes in protein levels, measured by densitometry and normalised to protein levels in secreting cell lysates, are plotted for three independent experiments; mean ± SD). NTA analysis reveals that the total number and size distribution of secreted particles is unchanged by this treatment. (c) Western blot of sEV proteins isolated from HCT116 cells cultured in hypoxic (1% O2) versus normoxic conditions also reveals an increase in markers of Rab11a‐exosomes (Rab11a and AREG) and other stress‐induced sEVs (Cav‐1). (d–f) Western blots of sEV proteins from Caco‐2 (d), SW480 (e) and SW620 (f) cells treated with the ATP‐competitive mTORC1 inhibitor, Torin1 (100 nM for SW480 cells and 150 nM for Caco‐2 and SW620 cells), versus treatment with vehicle alone (DMSO) also reveals a switch to secretion of increased Rab11a and AREG, and a reduction in CD63. NTA reveals that all sEV preparation have similar size distribution, but particle numbers were generally slightly reduced, ie. SW480: 41.58 ± 0.73 × 108 particles/mL (Torin1) versus 42.58 ± 1.74 × 108 (control) particles/mL: SW620: 13.71 ± 0.47 × 108 particles/mL (Torin1) versus 15.20 ± 0.37 × 108 (control) particles/mL: Caco2: 14.37 ± 0.98 × 108 particles/mL (Torin1) versus 18.11 ± 1.27 × 108 (control) particles/mL. (g) Graph showing levels of HCT116 growth after 120 h, measured as fold change in confluency, following addition of PBS, control HCT116 sEVs, or hypoxia‐induced HCT116 sEVs in the presence or absence of pre‐incubation with neutralising anti‐AREG antibodies. Note that only sEVs isolated under hypoxic conditions enhance growth and this is AREG‐dependent. *P < 0.05. Red and blue asterisks denote reduction and increase in protein levels respectively in Rab11a‐exosome‐enriched sEVs. MSI, microsatellite instability; MSS, microsatellite stability; CMS, consensus molecular subtype; n/a, not applicable. KRAS activating mutations: G13D or G12V. PI3K activating mutations: E545K D549N or H1047R. TP53 inactivating mutations: R273H P309S, or S241F, or E204X. Superscripts 1,2,3 refer to 1Ahmed et al. (2013); 2Sveen et al. (2018); 3Wang et al. (2017).
FIGURE 2
FIGURE 2
Rab11a‐exosome preparations from HCT116 and Caco‐2 cells enhance growth of HCT116 and Caco‐2 cells in an AREG‐dependent fashion. To test the effect of Rab11a‐exosome‐enriched sEV preparations (red lines on graphs) versus control sEV preparations (blue lines on graphs) on cell growth, sEVs were isolated either from HCT116 cultured in glutamine‐depleted (Gln0.15 mM) versus glutamine replete (Gln2 mM) conditions; or from Caco‐2 cells cultured in 150 nM Torin1 versus vehicle and compared to PBS addition alone (black line on graphs). They were then added to HCT116 or Caco‐2 recipient cells in reduced serum conditions (1% and 0.25% FBS respectively). (a) Diagram of experimental design. (b) Compared to control sEV preparations (blue line), Rab11a‐exosome‐enriched sEV preparations (red line) promote the growth of HCT116 recipient cells in a dose‐dependent manner (see Fig. S5b). (c) These preparations were also able to promote the growth of Caco‐2 recipient cells, but even the lowest dose of sEVs appeared to produce near‐maximal stimulation (see Fig. S5c). (d) The additional Caco‐2 cell growth stimulated by Rab11a‐exosome‐enriched sEVs isolated from HCT116 cells is blocked by pre‐incubation with an anti‐AREG antibody, which does not significantly affect growth under other conditions. (e) The anti‐AREG antibody blocks the increase in levels of activated phospho‐ERK (P‐ERK) produced in Caco‐2 cells treated with HCT116 Rab11a‐exosome preparations. (f) The additional Caco‐2 cell growth stimulated by Rab11a‐exosome‐enriched sEVs isolated from Caco‐2 cells (red solid line) is blocked by pre‐incubation with an anti‐AREG antibody (red dashed line), which does not significantly affect growth under other conditions. (g) Schematic showing the enhanced growth‐promoting effect of Rab11a‐exosomes, carrying the EGFR ligand AREG (middle), compared to free AREG in serum (left). The additional Rab11a‐exosome‐induced growth is blocked by addition of an anti‐AREG antibody (right). Eight technical repeats were employed for each condition and each experiment was repeated three times. **P < 0.01; ***P < 0.001. Black, blue and red asterisks denote significantly different from PBS control, control sEVs and anti‐AREG antibody treated sEVs respectively.
FIGURE 3
FIGURE 3
Rab11a‐exosome preparations induce AREG‐dependent cetuximab resistance in Caco‐2 cells. (a) Rab11a‐exosome‐enriched sEV preparations isolated from HCT116 cells were tested for their effects on cetuximab resistance in Caco‐2 cells, both in serum‐depleted (0.25% FBS) and serum‐replete (20% FBS) conditions, in the absence or presence of anti‐AREG antibodies and an EGFR kinase inhibitor. In b‐e, red and black lines on growth curves represent cells treated with Rab11a‐exosome‐enriched sEVs and PBS respectively, and dashed lines represent cetuximab‐treated cells. (b) HCT116 Rab11a‐exosome‐enriched sEV preparations suppress the growth inhibitory effect of cetuximab on Caco‐2 cells in serum‐depleted (0.25% FBS) conditions. (ci) Addition of anti‐AREG antibodies (AREG ab) to control Caco‐2 cells (PBS) treated with cetuximab has no further growth inhibitory effect on cetuximab‐treated cells (data points marked with crosses). (cii) In the same experiment, however, these antibodies completely suppress the growth‐promoting and cetuximab‐resistant effects of Rab11a‐exosome preparations (red lines). Control cell growth curves with and without cetuximab (black lines) are included in this graph for comparison. (d) HCT116 Rab11a‐exosome‐enriched sEV preparations suppress the growth inhibitory effect of cetuximab on Caco‐2 cells in serum‐replete (20% FBS) conditions, where in the absence of cetuximab, they have no additional growth‐promoting activity. (ei) Addition of anti‐AREG antibodies to control Caco‐2 cells has no further growth inhibitory effect on cetuximab‐treated cells. (eii) In the same experiment, however, these antibodies completely suppress the growth‐promoting and cetuximab‐resistant effects of Rab11a‐exosome preparations (red lines). Control cell growth curves with and without cetuximab are included in this graph for comparison (black lines). (f) The growth‐promoting effects of HCT116 Rab11a‐exosome preparations are completely suppressed by the EGFR kinase inhibitor AG1478. (g) Schematic models illustrating the effect of Rab11a‐exosomes, carrying the EGFR ligand AREG (middle), but not AREG in serum (left), in promoting cetuximab resistance in Caco‐2 CRC cells. Addition of either anti‐AREG antibodies (not shown) or the EGFR kinase inhibitor AG1478 (right) blocks the cetuximab resistance induced by Rab11a‐exosomes. Eight technical repeats were employed for each condition and each experiment was repeated three times. ***P < 0.001. In b–e, blue asterisks denote that sEV‐treated cell growth is significantly increased compared to PBS control. Red and green asterisks denote that sEV‐ and cetuximab‐treated cell growth is significantly increased compared to PBS control cells treated with cetuximab, and sEV‐/cetuximab‐treated cells after sEV pre‐incubation with anti‐AREG antibodies respectively. In f), black (control) and blue (sEV‐treated) asterisks denote significantly reduced cell growth after AG1478 treatment.
FIGURE 4
FIGURE 4
Schematic model highlighting the role of AREG on Rab11a‐exosomes in promoting cetuximab‐resistance in colorectal cancer. (a) The monoclonal antibody cetuximab (CTX) is typically effective in treating KRAS‐wild type colorectal cancer (CRC) cells (yellow cells). (b) Cetuximab is ineffective on other CRC cells that carry an active KRAS mutation (pink cells). These cells may produce Rab11a‐exosomes under nutrient and hypoxic stress, but they are presumably not required to maintain cetuximab resistance. (c) In heterogeneous CRC tumours, stress‐induced AREG‐loaded Rab11a‐exosomes from CTX‐resistant cells contribute to a mechanism leading to the development of drug resistance in previously CTX‐responsive cells, supporting clonal heterogeneity during tumour progression and further evolutionary change (orange cells).

References

    1. Ahmed, D. , Eide, P. W. , Eilertsen, I. A. , Danielsen, S. A. , Eknæs, M. , Hektoen, M. , Lind, G. E. , & Lothe, R. A. (2013). Epigenetic and genetic features of 24 colon cancer cell lines. Oncogenesis, 2, e71. - PMC - PubMed
    1. Allegra, C. J. , Rumble, R. B. , Hamilton, S. R. , Mangu, P. B. , Roach, N. , Hantel, A. , & Schilsky, R. L. (2016). Extended RAS gene mutation testing in metastatic colorectal carcinoma to predict response to anti‐epidermal growth factor receptor monoclonal antibody therapy: American Society of Clinical Oncology Provisional Clinical Opinion Update 2015. Journal of Clinical Oncology, 34, 179–185. - PubMed
    1. Bando, H. , Ohtsu, A. , & Yoshino, T. (2023). Therapeutic landscape and future direction of metastatic colorectal cancer. Nature Reviews Gastroenterology & Hepatology, 20, 306–322. - PubMed
    1. Bhattacharya, S. (2023). An empirical review on the resistance mechanisms of epidermal growth factor receptor inhibitors and predictive molecular biomarkers in colorectal cancer. Critical Reviews in Oncology/Hematology, 183, 103916. - PubMed
    1. Bishop, P. C. , Myers, T. , Robey, R. , Fry, D. W. , Liu, E. T. , Blagosklonny, M. V. , & Bates, S. E. (2002). Differential sensitivity of cancer cells to inhibitors of the epidermal growth factor receptor family. Oncogene, 21, 119–127. - PubMed

MeSH terms