

Plasma immune profiling combined with machine learning contributes to diagnosis and prognosis of active pulmonary tuberculosis
- PMID: 38888093
- PMCID: PMC11225635
- DOI: 10.1080/22221751.2024.2370399
Plasma immune profiling combined with machine learning contributes to diagnosis and prognosis of active pulmonary tuberculosis
Abstract
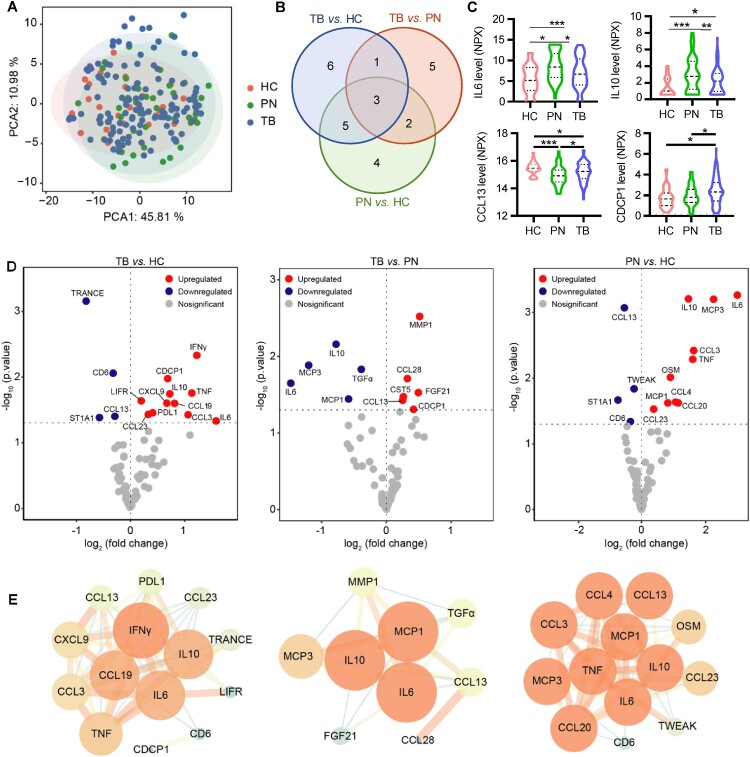
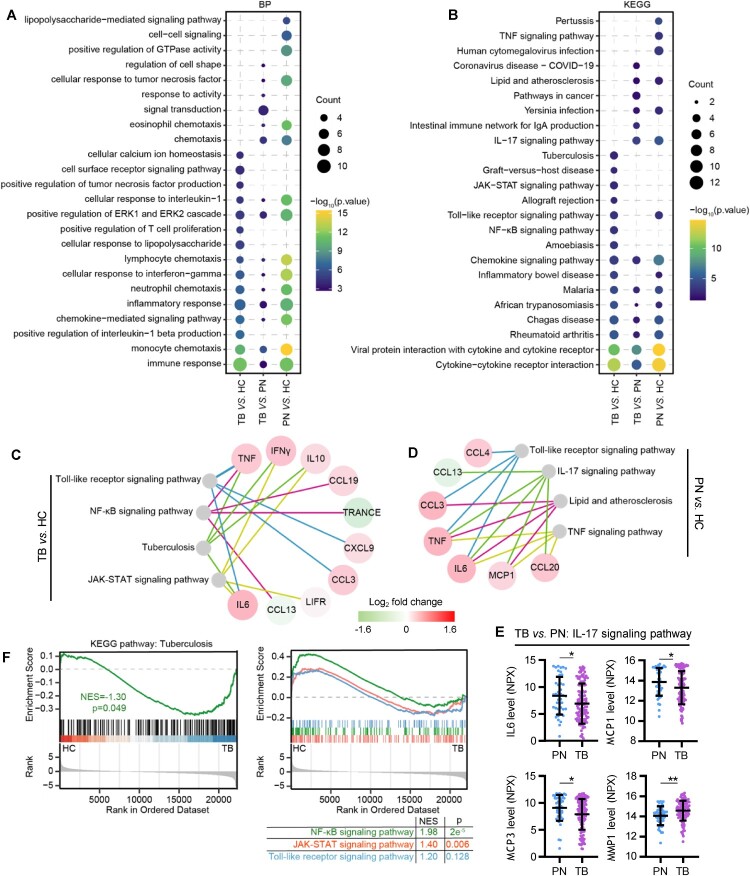
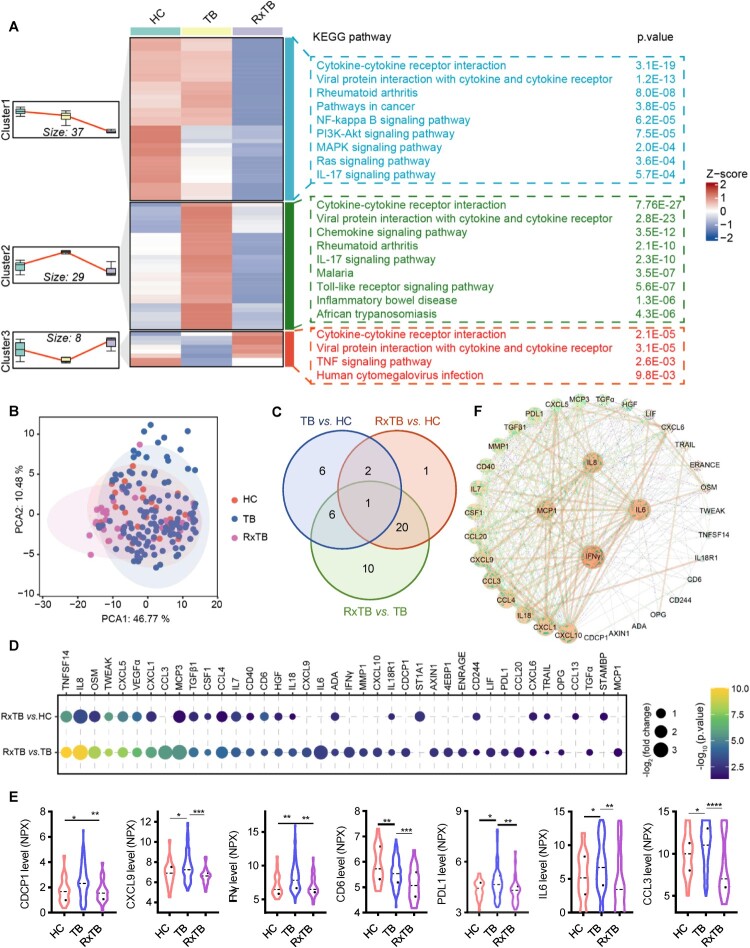
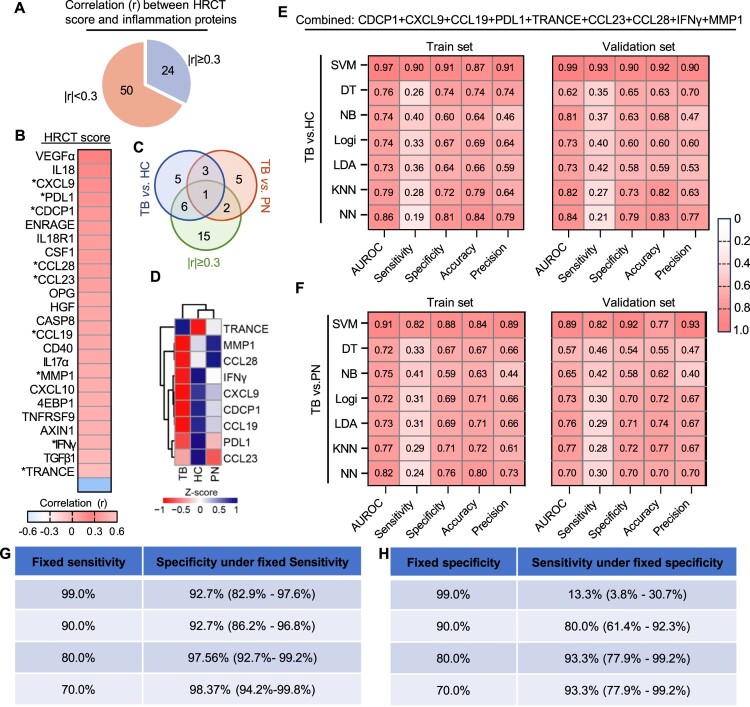
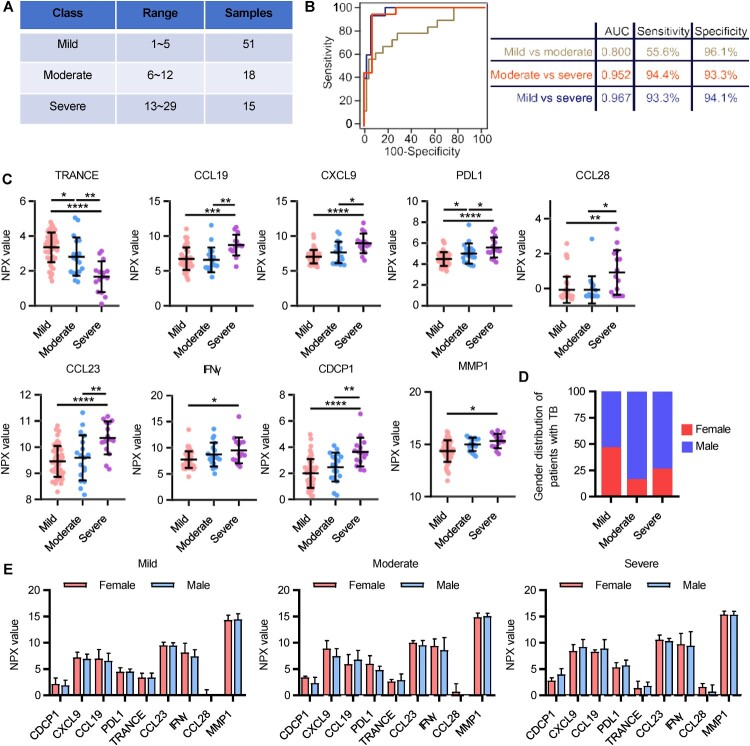
Tuberculosis (TB) remains one of the deadliest chronic infectious diseases globally. Early diagnosis not only prevents the spread of TB but also ensures effective treatment. However, the absence of non-sputum-based diagnostic tests often leads to delayed TB diagnoses. Inflammation is a hallmark of TB, we aimed to identify biomarkers associated with TB based on immune profiling. We collected 222 plasma samples from healthy controls (HCs), disease controls (non-TB pneumonia; PN), patients with TB (TB), and cured TB cases (RxTB). A high-throughput protein detection technology, multiplex proximity extension assays (PEA), was applied to measure the levels of 92 immune proteins. Based on differential analysis and the correlation with TB severity, we selected 9 biomarkers (CXCL9, PDL1, CDCP1, CCL28, CCL23, CCL19, MMP1, IFNγ and TRANCE) and explored their diagnostic capabilities through 7 machine learning methods. We identified combination of these 9 biomarkers that distinguish TB cases from controls with an area under the receiver operating characteristic curve (AUROC) of 0.89-0.99, with a sensitivity of 82-93% at a specificity of 88-92%. Moreover, the model excels in distinguishing severe TB cases, achieving AUROC exceeding 0.95, sensitivities and specificities exceeding 93.3%. In summary, utilizing targeted proteomics and machine learning, we identified a 9 plasma proteins signature that demonstrates significant potential for accurate TB diagnosis and clinical outcome prediction.
Keywords: PEA; Tuberculosis; biomarker; diagnosis; machine learning.
Conflict of interest statement
No potential conflict of interest was reported by the author(s).
Figures
Similar articles
-
Blood transcriptomic diagnosis of pulmonary and extrapulmonary tuberculosis.JCI Insight. 2016 Oct 6;1(16):e87238. doi: 10.1172/jci.insight.87238. JCI Insight. 2016. PMID: 27734027 Free PMC article.
-
Identification of potential lipid biomarkers for active pulmonary tuberculosis using ultra-high-performance liquid chromatography-tandem mass spectrometry.Exp Biol Med (Maywood). 2021 Feb;246(4):387-399. doi: 10.1177/1535370220968058. Epub 2020 Nov 11. Exp Biol Med (Maywood). 2021. PMID: 33175608 Free PMC article.
-
Biomarkers of iron metabolism facilitate clinical diagnosis in Mycobacterium tuberculosis infection.Thorax. 2019 Dec;74(12):1161-1167. doi: 10.1136/thoraxjnl-2018-212557. Epub 2019 Oct 14. Thorax. 2019. PMID: 31611342 Free PMC article.
-
[Evolution of IGRA researches].Kekkaku. 2008 Sep;83(9):641-52. Kekkaku. 2008. PMID: 18979999 Review. Japanese.
-
Unlocking the potential of miRNAs in detecting pulmonary tuberculosis: prospects and pitfalls.Expert Rev Mol Med. 2024 Dec 6;26:e32. doi: 10.1017/erm.2024.29. Expert Rev Mol Med. 2024. PMID: 39639643 Free PMC article. Review.
Cited by
-
Metabolomics and lipidomics of plasma biomarkers for tuberculosis diagnostics using UHPLC-HRMS.Front Cell Infect Microbiol. 2025 Jun 30;15:1526740. doi: 10.3389/fcimb.2025.1526740. eCollection 2025. Front Cell Infect Microbiol. 2025. PMID: 40661975 Free PMC article.
-
Plasma proteomics for novel biomarker discovery in childhood tuberculosis.medRxiv [Preprint]. 2025 Mar 20:2024.12.05.24318340. doi: 10.1101/2024.12.05.24318340. medRxiv. 2025. Update in: Nat Commun. 2025 Jul 19;16(1):6657. doi: 10.1038/s41467-025-61515-5. PMID: 39677468 Free PMC article. Updated. Preprint.
-
Multimodal machine learning-based model for differentiating nontuberculous mycobacteria from mycobacterium tuberculosis.Front Public Health. 2025 Feb 17;13:1470072. doi: 10.3389/fpubh.2025.1470072. eCollection 2025. Front Public Health. 2025. PMID: 40034169 Free PMC article.
-
Plasma proteomics for biomarker discovery in childhood tuberculosis.Nat Commun. 2025 Jul 19;16(1):6657. doi: 10.1038/s41467-025-61515-5. Nat Commun. 2025. PMID: 40683862 Free PMC article.
-
Identification of inflammatory protein biomarkers for predicting the different subtype of adult with tuberculosis: an Olink proteomic study.Inflamm Res. 2025 Apr 1;74(1):60. doi: 10.1007/s00011-025-02020-9. Inflamm Res. 2025. PMID: 40164948 Free PMC article.
References
-
- Yamasue M, Komiya K, Usagawa Y, et al. . Factors associated with false negative interferon-γ release assay results in patients with tuberculosis: a systematic review with meta-analysis. Sci Rep-Uk. 2020;10(1). doi:10.1038/s41598-020-58459-9. ARTN 1607. PubMed PMID: WOS:000562878200010. - DOI - PMC - PubMed
MeSH terms
Substances
LinkOut - more resources
Full Text Sources
Other Literature Sources
Research Materials
Miscellaneous