Review
. 2024 Jun 26;26(25):17456-17466.
doi: 10.1039/d4cp00889h.

An experimental perspective on nanoparticle electrochemistry

Affiliations
Review

An experimental perspective on nanoparticle electrochemistry

Esperanza Sedano Varo et al. Phys Chem Chem Phys. .

Abstract

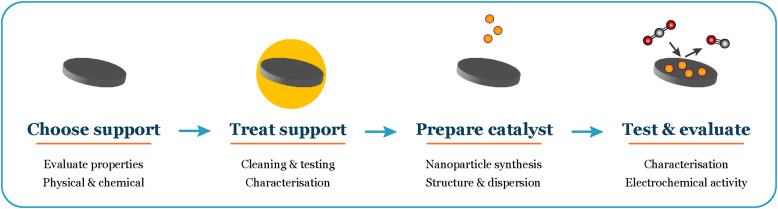
While model studies with small nanoparticles offer a bridge between applied experiments and theoretical calculations, the intricacies of working with well-defined nanoparticles in electrochemistry pose challenges for experimental researchers. This perspective dives into nanoparticle electrochemistry, provides experimental insights to uncover their intrinsic catalytic activity and draws conclusions about the effects of altering their size, composition, or loading. Our goal is to help uncover unexpected contamination sources and establish a robust experimental methodology, which eliminates external parameters that can overshadow the intrinsic activity of the nanoparticles. Additionally, we explore the experimental difficulties that can be encountered, such as stability issues, and offer strategies to mitigate their impact. From support preparation to electrocatalytic tests, we guide the reader through the entire process, shedding light on potential challenges and crucial experimental details when working with these complex systems.


Conflict of interest statement

There are no conflicts to declare.

Figures

Fig. 1
Fig. 1. Overall workflow when working with supported nanoparticles in electrochemistry.
Fig. 2
Fig. 2. Parameters to consider when choosing a support.
Fig. 3
Fig. 3. The pre-treatment of the support can influence the stabilization of nanoparticles. An example is shown here for two different samples where only the non-UHV part of the treatment of the support was changed. (a) Roughness of glassy carbon surface after cleaning it by polishing only, before deposition of nanoparticles, (b) roughness of glassy carbon surface directly after cleaning by polishing and nitric acid treatment, before deposition of nanoparticles. Line scans in (a) and (b) show that the root mean square (RMS) roughness is higher for the surface not treated with nitric acid. The same coverage of 5 nm Au nanoparticles were deposited on both supports. Panels (c) and (d) show SEM images of the samples after undergoing the same electrochemical test, depicting a difference in the agglomeration of the nanoparticles.
Fig. 4
Fig. 4. Impact of impurities in the support on the electrocatalytic activity of a sample. (a) ISS spectra of two glassy carbon supports from the same batch, but with different amounts of impurities. (b) Electrochemical performance of 3.5 nm Au nanoparticles with 5% coverage of the electrode. The sample contaminated by the support exhibits increased H2 production, overshadowing the CO2R activity.
Fig. 5
Fig. 5. Repetitions of COR of the same deposited sample (5 nm 5% coverage Cu nanoparticles), with different responses due to induced contamination from the UHV cleaning method. The results became reproducible after covering the electrode's holder with carbon. All measurements are done at the same applied potential of −0.75 VRHE.
Fig. 6
Fig. 6. (a) and (b) Schematic representation of how the contamination was induced from the support but overlooked by ISS, emphasizing that the issue was related to the detection location. (c) Partial current densities of ethylene and methane for doped Cu nanoparticles (8 nm, 3% coverage). The addition of 1 at% does not have an impact in the activity or selectivity of the nanoparticles.
Fig. 7
Fig. 7. Schematic of the nanoparticle synthesis and mass selection process in a cluster source system. The cluster formation begins in the aggregation zone, where a range of cluster sizes form. A beam of charged particles is then extracted from the aggregation zone and focused and accelerated using an array of electrostatic lenses towards the mass selection chamber, which consists of a lateral time-of-flight mass filter. With the mass filter, the desired mass/charge ratio is selected, and subsequently the particles are deposited onto the support.
Fig. 8
Fig. 8. (a) Nanoparticle synthesis schematics, combining magnetron sputtering and annealing; (b) and (c) Ni5Ga3 thin films of 0.3 (green) and 1 nm (orange), respectively, on an SiO2 (50 nm)/Si (350 μm) support annealed at 750 °C for 30 min in 10% H2 in He. SEM images were acquired at 5 kV and 0.1 nA.
Fig. 9
Fig. 9. Differences in nanoparticle distribution depending on the support. (a) SEM image of 5% coverage of 3.5 nm Au nanoparticles on glassy carbon. (b) TEM image at the same scale with 2% coverage of Au nanoparticles on graphene.
Fig. 10
Fig. 10. Decision map – electrochemical project definition.
Fig. 11
Fig. 11. Variations in the performance of 5 nm 5% coverage Cu nanoparticles for COR. The experiment consisted of several consecutive potential steps of 50 mV, measuring the current response and the generated products with a mass spectrometer. The experiment was performed in a stagnant thin-layer electrochemical cell interfaced to the mass spectrometer through a microporous aqueous chip.

References

    1. Mistry H. Behafarid F. Reske R. Varela A. S. Strasser P. Roldan Cuenya B. Tuning Catalytic Selectivity at the Mesoscale via Interparticle Interactions. ACS Catal. 2016;6(2):1075–1080. doi: 10.1021/acscatal.5b02202. - DOI
    1. Cherstiouk O. V. Simonov P. A. Savinova E. R. Model approach to evaluate particle size effects in electrocatalysis: preparation and properties of Pt nanoparticles supported on GC and HOPG. Electrochim. Acta. 2003;48(25):3851–3860. doi: 10.1016/S0013-4686(03)00519-X. - DOI
    1. Zheng Y. R. Vernieres J. Wang Z. Zhang K. Hochfilzer D. Krempl K. et al., Monitoring oxygen production on mass-selected iridium–tantalum oxide electrocatalysts. Nat. Energy. 2022;7(1):55–64. doi: 10.1038/s41560-021-00948-w. - DOI
    1. Kettner M. Stumm C. Schwarz M. Schuschke C. Libuda J. Pd model catalysts on clean and modified HOPG: Growth, adsorption properties, and stability. Surf. Sci. 2019;679:64–73. doi: 10.1016/j.susc.2018.08.022. - DOI
    1. Elgrishi N. Rountree K. J. McCarthy B. D. Rountree E. S. Eisenhart T. T. Dempsey J. L. A Practical Beginner's Guide to Cyclic Voltammetry. J. Chem. Educ. 2018;95(2):197–206. doi: 10.1021/acs.jchemed.7b00361. - DOI