. 2024 Jun 17;16(12):10512-10538.
doi: 10.18632/aging.205945. Epub 2024 Jun 17.

The crosstalk role of CDKN2A between tumor progression and cuproptosis resistance in colorectal cancer

Affiliations

The crosstalk role of CDKN2A between tumor progression and cuproptosis resistance in colorectal cancer

Xifu Cheng et al. Aging (Albany NY). .

Abstract

Background: Cuproptosis is a type of cell death characterized by excessive copper-lipid reactions in the tricarboxylic acid cycle, resulting in protein toxicity stress and cell death. Although known as a cuproptosis inhibitor through CRISPR-Cas9 screening, the role of cyclin-dependent kinase inhibitor 2A (CDKN2A) in cuproptosis resistance and its connection to tumor development remains unclear.

Methods: In this study, we combined single-cell sequencing, spatial transcriptomics, pathological image analysis, TCGA multi-omics analysis and in vitro experimental validation to comprehensively investigate CDKN2A distribution, expression, epigenetic modification, regulation and genomic features in colorectal cancer cells. We further explored the associations between CDKN2A and cellular pathway, immune infiltration and spatial signal communication.

Results: Our findings showed an increasing trend in cuproptosis in the trajectory of tumor progression, accompanied by an upward trend of CDKN2A. CDKN2A underwent transcriptional activation by MEF2D and via the SNHG7/miR-133b axis, upregulating glycolysis, copper metabolism and copper ion efflux. CDKN2A likely drives epithelial-mesenchymal transition (EMT) and progression by activating Wnt signaling. CDKN2A is associated with high genomic instability and sensitivity to radiation and chemotherapy. Tumor regions expressing CDKN2A exhibit distinctive SPP1+ tumor-associated macrophage (TAM) infiltration and MMP7 enrichment, along with unique signaling crosstalk with adjacent areas.

Conclusions: CDKN2A mediates cuproptosis resistance through regulating glycolysis and copper homeostasis, accompanied by a malignant phenotype and pro-tumor niche. Radiation and chemotherapy are expected to potentially serve as therapeutic approaches for cuproptosis-resistant colorectal cancer with high CDKN2A expression.

Keywords: CDKN2A; bioinformatics; cuproptosis; metabolism; radiation therapy.


Conflict of interest statement

CONFLICTS OF INTEREST: The authors declare that they have no conflicts of interest.

Figures

Figure 1
Figure 1
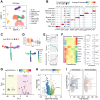
Dynamic alterations of cuproptosis characteristics. (A) UMAP dimension reduction plots showing cell clusters identified by scRNAseq. (B) Expression of marker genes of different cell clusters. (C) Evolution trajectory of tumor epithelial cells, which are divided into seven states. (D) TOP: CytoTRACE predicts the evolutionary stage of each state. Bottom: pseudotime in the evolutionary trajectory. (E) Shaded line plot indicating the resistance score, sensitivity score, and the difference between the two for cuproptosis in tumor epithelium along pseudotime. (F) Heatmap and line plot showing cuproptosis-related genes arranged in pseudotime. (G) PCA map of the cell count matrix obtained from pseudobulk analysis. (H) Differential gene expression analysis of genes obtained from pseudobulk analysis. (I) Differential gene analysis between tumor and normal samples, as well as between tumor and paired samples, using the TCGA colorectal cancer cohort.
Figure 2
Figure 2
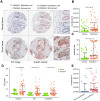
QuPath performs cell identification on immunohistochemical staining images from the Human Protein Atlas. (A) Identified CDKN2A-positive cells and cell types. (B) Comparison of CDKN2A-positive expression density between epithelial tissue and stroma. (C) Comparison of the CDKN2A-positive expression rate between epithelial tissue and stroma. (D) Comparison of CDKN2A-positive staining intensity between epithelial tissue and stroma. (E) Comparison of the positive density of CDKN2A between epithelial tissue in tumor and normal control samples using the Wilcoxon test. ***P < 0.001.
Figure 3
Figure 3
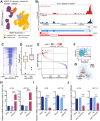
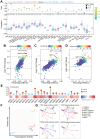
Potential regulatory mechanisms of CDKN2A. (A) UMAP dimension reduction plots showing annotated cell clusters, with different colors representing different cell types. (B) Genome accessibility trajectory around CDKN2A in tumor epithelium and normal epithelium cells, with peaks called in the scATAC data and peaks-to-gene links indicated below the tracks. (C) TSS distribution heatmap for the ATAC-seq data in the TCGA colorectal cancer cohort. (D) Peak value differences in CDKN2A sites between the CDKN2A high and low expression groups in the TCGA colorectal cancer cohort, *P < 0.05, Wilcoxon test. (E) Transcription factors predicted by Pyscenic to potentially regulate CDKN2A, ranked based on the fold difference in AUCell values for each point. (F) A ceRNA regulatory network was constructed based on differentially expressed genes, with the SNHG7/miR-133b/CDKN2A regulatory axis being the most relevant potential regulatory network. (G) Scatter plot showing the CDKN2A and SNHG7 expression levels, the Spearman rank test. (H) qRT-PCR analysis was performed to assess the influence of silencing SNHG7 on miR-133b expression levels in CRC cell lines. (I) qRT-PCR analysis was conducted to investigate the influence of SNHG7 knockout on CDKN2A expression levels in CRC cell lines. (J) qRT-PCR analysis was employed to determine the effects of miR-133b mimic and miR-133b inhibitor transfection on CDKN2A expression levels in CRC cell lines.
Figure 4
Figure 4
The impact of CDKN2A on energy metabolism, copper metabolism, and copper ion transportation. (A) UMAP dimension reduction plots of colorectal cancer epithelium cells showing the expression level of CDKN2A, with color depth representing the level of CDKN2A expression and gray indicating undetected CDKN2A expression. (B) Reactome metabolic pathways for different CDKN2A expression levels in tumor epithelium cells. (C) KEGG metabolic pathways for different CDKN2A expression levels in tumor epithelium cells. (D) Knockdown of CDKN2A leads to a decrease in the mRNA expression levels of phosphofructokinase-1 genes (PFKM, PFKL) in CRC cell lines. (E) Comparison of copper metabolism scores among different CDKN2A expression groups in tumor epithelial cells. ***P < 0.001, Wilcoxon test. (F) A scatter plot was generated to illustrate the correlation between CDKN2A expression and copper metabolism in the TCGA cohort. (G) qRT-PCR was utilized to examine the impact of CDKN2A knockdown on the mRNA transcriptional levels of copper transporters (SLC31A1, SLC31A2, ATP7B) in CRC cell lines. (H) Knocking out CDKN2A increases the intracellular copper ion concentration. ns represents no significance; *P < 0.05, **P < 0.01, ***P < 0.0001.
Figure 5
Figure 5
Association of CDKN2A with the Wnt signaling pathway and EMT. (A) Enriched Reactome pathways for differentially expressed genes in the TCGA colorectal cancer cohort, with dark green representing pathways involving upregulated genes and light green representing pathways involving downregulated genes. (B) KEGG pathways enriched for upregulated genes in the CDKN2A high-expression group, showing upregulation of the Wnt signaling pathway. (C) Comparison of Wnt signaling pathway scores between different CDKN2A expression groups in tumor epithelium cells, ***P < 0.001, Wilcoxon test. (D) Knockdown of CDKN2A leads to decreased mRNA expression levels of Wnt signaling pathway members in CRC cell lines. *P < 0.05, **P < 0.01, ***P < 0.0001. (E) Comparison of EMT scores among different CDKN2A expression groups in tumor epithelial cells. ***P < 0.001, Wilcoxon test. (F) The scatter plot shows the correlation between the expression level of CDKN2A and EMT score in the TCGA cohort.
Figure 6
Figure 6
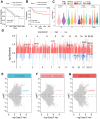
Relationship between CDKN2A expression and prognosis and treatment of colorectal cancer. (A) The Kaplan-Meier curve demonstrates a correlation between high CDKN2A expression and decreased overall survival rates in colorectal cancer patients. (B) The Kaplan-Meier curve illustrates that high CDKN2A expression is linked to reduced disease-free survival in colorectal cancer patients. (C) The association between CDKN2A and clinical pathological features, including the TNM staging and pathological stage of the tumor. (D) The differences in mutated genes between CDKN2A expression groups are shown, with red lines representing genes with increased mutation rates in the high expression group, and blue lines representing genes with increased mutation rates in the low expression group. The annotated genes are involved in DNA damage repair. The X-axis represents the genomic position coordinates, while the Y-axis represents the negative logarithm of the P-values for rate comparison. (E) Genes differentially expressed between 5-FU-S and 5-FU-R cell lines after 5-fluorouracil treatment. (F) Genes differentially expressed between 5-FU-S and 5-FU-R cell lines after 5-fluorouracil plus radiation therapy. (G) Genes differentially expressed between 5-FU-S and 5-FU-R cell lines after uracil treatment.
Figure 7
Figure 7
Regional annotation and expression of CDKN2A in spatial transcriptomic samples. (A) Malignancy scores on colorectal cancer spatial transcriptomic samples and on two types of tumor tissue stained with H&E. (B) Analysis of colorectal cancer spatial transcriptomic samples using the SpotSweeper R package. (C) Marker gene expression of all cell types in the tissues. Color depth represents the average expression level, and dot size represents the percentage of expressing cells. (D) Annotation of results from all sample regions, with different colors representing different regions. Sample numbers are listed above. (E) Expression of CDKN2A in colorectal cancer tissues. (F) Expression of CDKN2A in tumor regions and adjacent regions.
Figure 8
Figure 8
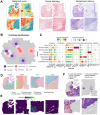
Immune cell infiltration, differential gene expression, and cellular communication networks in tumor regions and adjacent regions. (A) The ssGSEA algorithm evaluated the relationship between CDKN2A expression levels and immune cell infiltration levels in different regions of colorectal cancer. The lower box plot shows the difference in immune cell infiltration between the different regions, and the upper bar chart shows the fold change. Statistical significance was determined using the Wilcoxon test (***P < 0.001). (B) Within the TCGA cohort, high CDKN2A expression was associated with increased infiltration of SPP1 in TAMs. The Wilcoxon test was utilized for statistical analysis (**P < 0.01). (C) Differential gene analysis of CDKN2A+ tumor spots and CDKN2A- tumor spots in the spatial transcriptomics analysis. The x-axis represents the difference in the proportion of gene expression between the two groups, and the y-axis represents the fold change. (D) Differential gene analysis of nearby CDKN2A+ and nearby CDKN2A- regions in spatial transcriptomics analysis. (E) Differential gene analysis of tumor epithelial cells expressing CDKN2A and those not expressing CDKN2A in the scRNAseq cohort. (F) Heatmap showing the correlation between the expression levels of CDKN2A and MMPs in TCGA the cohort. The bar chart above represents the significance of P-values, with different colors indicating statistical significance. The statistical method used was the Spearman rank test. (G) Transcriptional heterogeneity and expression rate of CDKN2A in all samples, where the x-axis represents the inverse of the transcriptional heterogeneity score, and the y-axis represents the expression rate of CDKN2A. (H) Cell communication network diagram between tumor spots and adjacent spots.
Figure 9
Figure 9
CDKN2A enhances colorectal cancer cell viability and migration through suppressing cuproptosis. (A) Western blot analysis was performed to examine the expression changes of FDX1 in HT-29 and HCT116 cells following knockdown of CDKN2A and addition of a cuproptosis inhibitor (*P<0.05, **P<0.01, ***P<0.001). (B) The CCK8 assay was utilized to assess alterations in cell proliferation ability in HT-29 and HCT116 cells upon CDKN2A knockdown and cuproptosis inhibitor treatment (*P <0.05, **P <0.01, ***P <0.001). (C) Transwell assay was employed to evaluate changes in cell invasion ability in HT-29 and HCT116 cell lines following CDKN2A knockdown and cuproptosis inhibitor supplementation (*P <0.05, ** P <0.01, *** P <0.001).

Similar articles

Cited by

References

    1. Spaander MCW, Zauber AG, Syngal S, Blaser MJ, Sung JJ, You YN, Kuipers EJ. Young-onset colorectal cancer. Nat Rev Dis Primers. 2023; 9:21. 10.1038/s41572-023-00432-7 - DOI - PMC - PubMed
    1. Provenzale D, Ness RM, Llor X, Weiss JM, Abbadessa B, Cooper G, Early DS, Friedman M, Giardiello FM, Glaser K, Gurudu S, Halverson AL, Issaka R, et al.. NCCN Guidelines Insights: Colorectal Cancer Screening, Version 2.2020. J Natl Compr Canc Netw. 2020; 18:1312–20. 10.6004/jnccn.2020.0048 - DOI - PMC - PubMed
    1. Kim YS, Choi J, Lee SH. Single-cell and spatial sequencing application in pathology. J Pathol Transl Med. 2023; 57:43–51. 10.4132/jptm.2022.12.12 - DOI - PMC - PubMed
    1. Chen L, Min J, Wang F. Copper homeostasis and cuproptosis in health and disease. Signal Transduct Target Ther. 2022; 7:378. 10.1038/s41392-022-01229-y - DOI - PMC - PubMed
    1. Erratum for the Research Article “Copper induces cell death by targeting lipoylated TCA cycle proteins,” by P. Tsvetkov et al. Science. 2022; 378:eadf5804. 10.1126/science.adf5804 - DOI - PubMed

Publication types

MeSH terms