. 2024 Aug;11(31):e2401905.
doi: 10.1002/advs.202401905. Epub 2024 Jun 18.

Nanobody-Engineered Biohybrid Bacteria Targeting Gastrointestinal Cancers Induce Robust STING-Mediated Anti-Tumor Immunity

Affiliations

Nanobody-Engineered Biohybrid Bacteria Targeting Gastrointestinal Cancers Induce Robust STING-Mediated Anti-Tumor Immunity

Xiaolong Xu et al. Adv Sci (Weinh). 2024 Aug.

Abstract

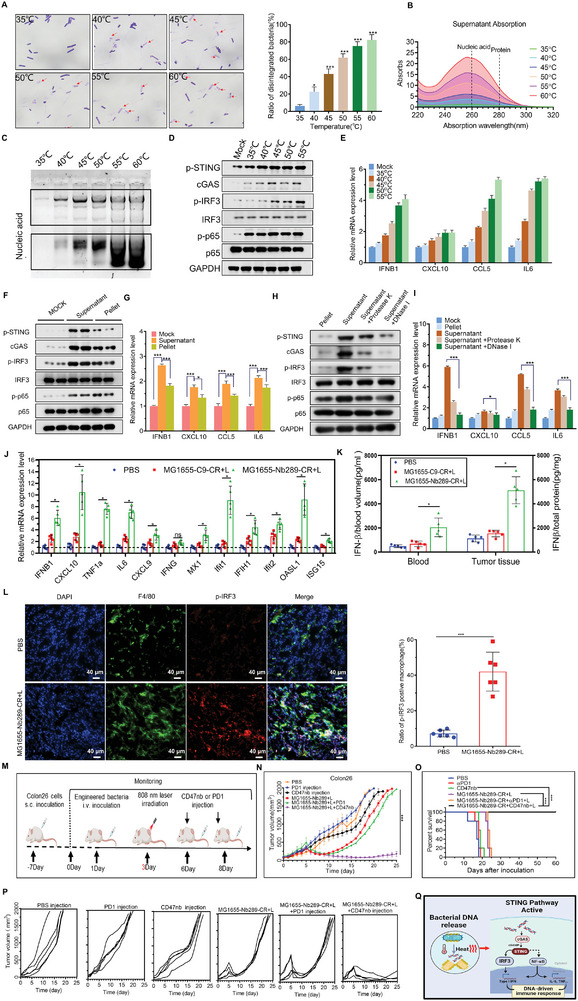
Bacteria can be utilized for cancer therapy owing to their preferential colonization at tumor sites. However, unmodified non-pathogenic bacteria carry potential risks due to their non-specific targeting effects, and their anti-tumor activity is limited when used as monotherapy. In this study, a biohybrid-engineered bacterial system comprising non-pathogenic MG1655 bacteria modified with CDH17 nanobodies on their surface and conjugated with photosensitizer croconium (CR) molecules is developed. The resultant biohybrid bacteria can efficiently home to CDH17-positive tumors, including gastric, pancreatic, and colorectal cancers, and significantly suppress tumor growth upon irradiation. More importantly, biohybrid bacteria-mediated photothermal therapy (PTT) induced abundant macrophage infiltration in a syngeneic murine colorectal model. Further, that the STING pathway is activated in tumor macrophages by the released bacterial nucleic acid after PTT is revealed, leading to the production of type I interferons. The addition of CD47 nanobody but not PD-1 antibody to the PTT regimen can eradicate the tumors and extend survival. This results indicate that bacteria endowed with tumor-specific selectivity and coupled with photothermal payloads can serve as an innovative strategy for low-immunogenicity cancers. This strategy can potentially reprogram the tumor microenvironment by inducing macrophage infiltration and enhancing the efficacy of immunotherapy targeting macrophages.

Keywords: STING; bacteria; immunotherapy; nanobody; photothermal therapy.


Conflict of interest statement

The authors declare no conflict of interest.

Figures

Scheme 1
Scheme 1
Schematic illustration of engineered biohybrid bacteria MG1655 targeting CDH17‐positive tumors to suppress tumor growth through photothermal effect and STING activation in macrophages. The CDH17 nanobodies applied in biohybrid bacteria were screened using phage display and deep sequencing technology. Bacteria were engineered to display nanobodies on the surface and further conjugated with CR dye. The resultant biohybrid bacteria can specifically home to tumor mass (gastric, colorectal, and pancreatic tumors) overexpressing CDH17 protein. Laser irradiation at 808 nm can directly kill tumor cells through the photothermal effect and simultaneously activate the STING pathway in tumor‐associated macrophages via the release of internal nucleic acid from bacteria and cancer cells. Therefore, macrophage infiltration is further induced, and the addition of CD47 nanobody based on biohybrid bacteria plus irradiation eliminates tumors.
Figure 1
Figure 1
Phage display combined with deep sequencing technology to screen potential high‐affinity CDH17 nanobodies. A) The flow chart of phage display biopanning combined with deep sequencing analysis to screen CDH17 nanobodies. B) Ten CDH17 nanobody candidate sequences obtained by deep sequencing; the vertical axis represents the sequence counts, and the percentage of nanobody sequence frequencies is marked on the bar graph. C) SDS‐PAGE analysis of nanobodies after purification. D) Western blot of nanobodies detected with anti‐VHH antibody; the size of the nanobodies is ≈15 kDa. E) Western blot of nanobodies detected with anti‐HA tag antibody. HA tag was integrated at the C‐terminal of nanobody sequences. F) Analysis of the binding activity of candidate nanobodies to human CDH17 protein using ELISA (n = 4). G) Analysis of the binding activity of candidate nanobodies to murine CDH17 protein with ELISA (n = 4). H) Affinity determination of Nb289 against human and murine CDH17 proteins using surface plasmon resonance (SPR) assay. I) Affinity determination of Nb535 against human and murine CDH17 proteins using SPR assay.
Figure 2
Figure 2
Nb289 nanobody can target gastric, colorectal, and pancreatic cancers with CDH17 expression. A) Cell ELISA to detect the binding of Nb289 to various cancer cells. Nb289 and control nanobody C9 were serially diluted from 250 nM and incubated with CDH17 positive and negative cells (n = 3). Data are representative of three duplicates. B) Cell ELISA to detect the binding of Nb535 to each cell as described in A (n = 3). C) Western blot determination of CDH17 knockdown in MKN45 cells. D) Immunofluorescence staining (left) and quantification (right) for the specificity determination of Nb289 against CDH17 in MKN45 cells with/without CDH17 knockdown. Scale bars, 20 µm. E) Western blot determination of CDH17 knockdown in IM95 cells. F) Immunofluorescence staining (left) and quantification (right) for the specificity determination of Nb289 against CDH17 in IM95 cells with/without CDH17 knockdown. Scale bars, 20 µm. G) In vivo imaging analysis of Nb289 in MKN45 tumor model. C9 and Nb289 labeled with Cy5 fluorescent molecules, imaging was performed at different time points (12, 24, 48, and 72 h) after nanobody injection (1 mg kg−1 body weight, n = 3 per group). H) Ex vivo imaging analysis of the major organs of mice that received nanobody injection. The organs were collected from mice for in vivo imaging analysis after 72 h circulation (n = 3 per group). I) Immunohistochemical detection of nanobody distribution in major organs from H by anti‐VHH antibody (n = 3 per group). Scale bars, 20 µm. *P < 0.05, **P < 0.01, and ***P < 0.001.
Figure 3
Figure 3
Construction of nanobody‐engineered bacteria and assessment in vitro. A) Schematic diagram of nanobody‐displayed bacteria. B) Western blot detection of the nanobody expression in the engineered bacteria MG1655. The nanobody fused to the C‐terminal fragment of EHEC intimin protein was ≈90 kDa, and the lower band was a non‐specific signal. C) Bacterial flow cytometry assay to determine nanobody display efficiency on the bacterial outer membrane surface with anti‐VHH and HA tag antibodies. Unmodified MG1655 bacteria were used as a negative control. D) Immunofluorescence staining for detection of the nanobody displayed on the bacterial outer membrane. The antibodies targeting nanobody frames and HA tags were used for nanobody identification. Scale bars, 20 µm. E) ELISA assay with nanobody‐engineered bacteria MG1655 to examine the binding activity to human CDH17 protein. Engineered bacteria were labeled with Cy5 dye and co‐incubated with purified human CDH17 with serial diluted MG1655 (n = 4 per concentration). F) Cell immunostaining and quantification of MKN45 cells with or without CDH17 knockdown through incubation with Nb289 nanobody‐engineered bacteria labeled by Cy5. The green fluorescence was derived from the lentiviral vector expressed GFP, and the red fluorescence was produced from the engineered bacteria labeled with Cy5. Scale bars left 40 µm, right 10 µm. G) Cell immunostaining (left) and quantification (right) of MKN45 cells with or without CDH17 knockdown through incubation with control nanobody‐engineered bacteria labeled by Cy5. Scale bars, 40 µm (left), 10 µm (right). * P < 0.05, **P < 0.01, and ***P < 0.001.
Figure 4
Figure 4
Nb289 nanobody enhances the homing ability of bacteria to tumors with high CDH17 expression in vivo. A) In vivo imaging analysis of Nb289‐engineered bacteria in MKN45 gastric cancer model. C9‐ and Nb289‐engineered bacteria were labeled with Cy5 dye; imaging was performed at different time points (12, 24, 48, and 72 h) after bacterial injection (5 × 10⁶ CFU per mouse, n = 4 per group). B) Ex vivo organ imaging analysis after administration of C9‐ and Nb289‐engineered bacteria. Organs were collected from in vivo imaged mice 72 h after circulation (n = 4 per group). C) Immunofluorescence staining analysis of bacteria enriched in tumors. Tumors were dissected from in vivo imaged mice bearing MKN45 gastric cancer (n = 4 per group). Scale bars, 100 µm (left), 20 µm (right). D) Quantification analysis of bacterial staining in tumor tissues; nine high magnification fields of each sample were analyzed. E) Bacterial colony analysis in various tissues after treatment with engineered bacteria. The tissues were collected from mice receiving bacteria administration for 72 (n = 3 per group). F) Quantification of bacterial colony number in various tissues from E (n = 3 per group); three duplicates were conducted for each sample to calculate the average colony number. G) In vivo imaging analysis of Nb289‐engineered bacteria in ASPC1 pancreatic cancer model. C9‐ and Nb289‐engineered bacteria were labeled with Cy5 dye; imaging was performed at different time points (12, 24, 48, and 72 h) after bacterial injection (5 × 10⁶ CFU per mouse, n = 3 per group). H) Ex vivo imaging analysis of the major organs 72 h after treatment with C9‐ and Nb289‐engineered bacteria. The organs were dissected from in vivo imaged mice from G (n = 3 per group), *P < 0.05, **P < 0.01, and ***P < 0.001.
Figure 5
Figure 5
Construction and characterization of biohybrid bacteria through CR coupling with engineered bacteria. A) Schematic illustration of CR photothermal molecules conjugated with engineered bacteria MG1655. B) Images of MG1655‐CR visualized using an optical microscope. Scale bars, 5 µm. C) Concentration determination of CR molecules modified onto bacteria; 10 CFU of bacteria were used in 1 ml PBS for the conjugation in different concentrations of CR‐NHS. Quantity of CR‐NHS was determined based on the absorption of the solution at 780 nm. D) UV–vis absorption spectra of CR and MG1655‐CR. E) Thermal images and temperature quantification of PBS, MG1655, CR, and MG1655‐CR under irradiation with 0.8 W/cm2 808 nm laser for 5 min. F) Cell viability detection of MKN45 gastric cancer cells under treatment with different concentrations of MG1655‐CR with or without 808 nm laser irradiation for 5 min via CCK‐8 assay (n = 4). G) Cell viability examination of MKN45 gastric cancer cells under treatment with PBS, MG1655, CR, and MG1655‐CR with or without 808 nm laser irradiation for 5 min via CCK‐8 assay (n = 4). H) Live and dead cell staining for MKN45 gastric cancer cells after treatment with PBS, MG1655, CR, and MG1655‐CR with or without 808 nm laser irradiation for 5 min via calcein AM/PI staining (n = 3). Scale bars, 100 µm. I) Apoptosis detection of MKN45 gastric cancer cells following treatment with PBS, MG1655, CR, and MG1655‐CR with or without 808 nm laser irradiation for 5 min via Annexin V/PI staining and flow cytometry (n = 3). *P < 0.05. J) Cell viability detection of MKN45 gastric cancer cells following treatment with different concentrations of MG1655, MG1655‐C9‐CR, and MG1655‐Nb289‐CR with 808 nm laser irradiation for 5 min via CCK‐8 assay (n = 4). Bacteria unbound to cells were washed away before laser irradiation in the experiment.
Figure 6
Figure 6
Nb289‐MG1655‐CR biohybrid bacteria‐mediated photothermal therapy effectively inhibits tumor growth in vivo. A) The temperature changes and NIR thermal images of tumors during laser irradiation after intravenous injection of PBS, MG1655‐C9‐CR, and MG1655‐Nb289‐CR (5 × 10⁶ CFU per mouse, n = 3 per group). B) Treatment schedule for MKN45 gastric and ASPC1 pancreatic subcutaneous tumors. C) Tumor growth curves in mice transplanted with MKN45 gastric cancer cells under various treatments, including PBS, C9‐MG1655‐CR alone, Nb289‐MG1655‐CR alone, MG1655‐C9‐CR plus irradiation (L: 808 nm laser irradiation), and Nb289‐MG1655‐CR plus irradiation (n = 6 per group). D) Individual tumor curves from C. E) Survival analysis of mice under various treatments, including 1, PBS, 2, MG1655‐C9‐CR plus irradiation (L: 808 nm laser irradiation), and 3, Nb289‐MG1655‐CR plus irradiation (n = 5 per group). F) Immunohistochemical staining (left) and quantification (right) of TUNEL and Ki67 in tumor tissues collected from (C). Scale bars, 40 µm. G) Tumor growth curves from mice with subcutaneous transplantation of ASPC1 pancreatic cancer cells under various treatments, including PBS, MG1655‐C9‐CR plus irradiation (L: 808 nm laser irradiation), and Nb289‐MG1655‐CR plus irradiation (n = 5 per group). H) Individual tumor growth curves of pancreatic tumors from g. I) Survival analysis of mice under various treatments in ASPC1 pancreatic cancer model related to g; 1, PBS, 2, MG1655‐C9‐CR plus irradiation (L: 808 nm laser irradiation), and 3, Nb289‐MG1655‐CR plus irradiation (n = 5 per group). *P < 0.05, **P < 0.01, and ***P < 0.001.
Figure 7
Figure 7
MG1655‐Nb289‐CR mediated photothermal therapy suppresses murine colorectal tumor growth and increases macrophage infiltration in immunocompetent mice. A) In vivo imaging analysis of the murine colorectal tumors with Cy5‐labeled Nb289‐MG1655 in Colon26 tumor‐bearing mice. C9‐ and Nb289‐engineered bacteria were labeled with Cy5 dye, and imaging was performed at different time points (12, 24, 48, and 72 h) after bacterial injection (5×10 CFU per mouse, n = 4 per group). Immunocompetent BALB/c mice were used in this procedure. B) Ex vivo imaging analysis of the major organs collected from a after 72 h circulation (n = 4 per group). C) Treatment schedule for biohybrid bacteria plus irradiation in Colon26 tumor‐bearing mice. D) Tumor growth curves of Colon26 tumors under various treatments, including 1, PBS, 2, C9‐MG1655‐CR plus irradiation (L: 808 nm laser irradiation, 0.8 W cm−2, 5 min), and 3, Nb289‐MG1655‐CR plus irradiation (n = 5 per group). E) Individual tumor growth curves of Colon26 tumors from d. F) Survival analysis for Colon26 tumor‐bearing mice 1, 2 and 3 groups from d (n = 5 per group). G) Flow cytometry analysis of infiltrated macrophages in tumor tissues following treatment with PBS and Nb289‐MG1655‐CR plus irradiation. Tumor tissues were collected and analyzed on day 4 after laser irradiation (n = 6 per group). H) Flow cytometry analysis of infiltrated mature dendritic cells in tumor tissues following treatment in the PBS and Nb289‐MG1655‐CR plus irradiation groups (n = 6 per group). I and J) Immunofluorescence analysis and quantification of infiltrated macrophages and macrophage phagocytosis by F4/80 and Iba staining in tumor tissues from g. Scale bars, 40 µm (left), 10 µm (right). *P < 0.05, **P < 0.01, and ***P < 0.001.
Figure 8
Figure 8
Nb289‐MG1655‐CR mediated PTT can activate the STING pathway in macrophages and facilitate immunotherapy with CD47 nanobody. A) Crystalline violet staining and quantification for engineered MG1655 after heating with different temperatures at 35–60 °C. Unstained bacteria indicated by red arrows were disintegrated bacteria (n = 6 per group). Scale bars, 10 µm. B) Nucleic acid and protein content in the supernatant detected using spectrophotometry. The supernatants collected from engineered bacteria treated with heat at different temperatures were assessed to detect UV absorption at wavelengths from 220–320 nm. The wavelengths indicated by the dashed lines were the absorption peaks of nucleic acids (260 nm) and proteins (280 nm). C) The nucleic acids in the supernatant from a were examined using agarose gel electrophoresis. D) The examination of the STING pathway in macrophages treated with supernatants collected from heated MG1655 using western blotting. E) Expression of target genes of the STING pathway in bacterial supernatant‐treated macrophages detected using real‐time quantitative PCR (n = 3 per group). F) Detection of the STING pathway after treatment with bacterial supernatant or pellet in isolated macrophages. Bacterial supernatant or pellet was collected from engineered MG1655 incubated at 45 °C for 5 min. G) Expression of target genes of the STING pathway in bacterial supernatant or pellet‐treated macrophages examined by real‐time quantitative PCR (n = 3 per group). H) Examination of the STING pathway in macrophages treated with preconditioned supernatants using western blotting. Bacterial supernatant was collected from engineered MG1655 incubated at 45 °C for 5 min and treated with or without DNase I or protease K to remove DNA or proteins. I) The expression of downstream genes of the STING pathway in bacterial supernatant or pellet‐treated macrophages detected by real‐time quantitative PCR (n = 3 per group). The bacterial supernatant was the same as in h. J) The expression of key transcription factors and downstream target genes involved in STING pathway activation of tumor tissue samples from animal model in (Figure 7C) detected by real‐time quantitative PCR (n = 5 per group). K) The IFNβ level of blood and tumor tissue samples from animal model in (Figure 7C) detected by ELISA. IFN‐γ concentration in tumor tissue was normalized to total protein (n = 5 per group). L) The expression of p‐IRF3 in macrophages (F4/80+) in tumor tissues from animal model in (Figure 7C) detected by immunofluorescence analysis (n = 5 per group). Scale bars, 40 µm. M) Treatment schedule for combinational therapy in Colon26 tumor‐bearing mice. N) Tumor growth curves under various treatments, including PBS, αPD1 (iv, 250 µg mouse−1), CD47nb (iv, 200 µg mouse−1), Nb289‐MG1655‐CR/irradiation (L: 808 nm laser irradiation), Nb289‐MG1655‐CR/irradiation plus αPD1, and Nb289‐MG1655‐CR/irradiation plus CD47nb (n = 5 per group). O) Survival analysis for tumor‐bearing mice from K. P) Individual tumor growth curves of Colon26 tumors from K. Q) Mechanism illustration of STING pathway activation in macrophages by released nucleic acids from biohybrid‐engineered bacteria after irradiation. *P < 0.05, **P < 0.01, and ***P < 0.001.

Similar articles

Cited by

References

    1. a) McCarthy E. F., Iowa Orthop. J. 2006, 26, 154; - PMC - PubMed
    2. b) Gurbatri C. R., Arpaia N., Danino T., Science 2022, 378, 858. - PMC - PubMed
    1. a) Chowdhury S., Castro S., Coker C., Hinchliffe T. E., Arpaia N., Danino T., Nat. Med. 2019, 25, 1057; - PMC - PubMed
    2. b) Gurbatri C. R., Lia I., Vincent R., Coker C., Castro S., Treuting P. M., Hinchliffe T. E., Arpaia N., Danino T., Sci. Transl. Med. 2020, 12, eaax0876; - PMC - PubMed
    3. c) Zheng J. H., Nguyen V. H., Jiang S. N., Park S. H., Tan W., Hong S. H., Shin M. G., Chung I. J., Hong Y., Bom H. S., Choy H. E., Lee S. E., Rhee J. H., Min J. J., Sci. Transl. Med. 2017, 9, eaak9537. - PubMed
    1. Zhou S., Gravekamp C., Bermudes D., Liu K., Nat. Rev. Cancer 2018, 18, 727. - PMC - PubMed
    1. Lou X., Chen Z., He Z., Sun M., Sun J., Nanomicro. Lett. 2021, 13, 37. - PMC - PubMed
    1. Huang X., Pan J., Xu F., Shao B., Wang Y., Guo X., Zhou S., Adv. Sci. (Weinh) 2021, 8, 2003572. - PMC - PubMed

Grants and funding

LinkOut - more resources