. 2024 Aug 1;35(8):mr6.
doi: 10.1091/mbc.E23-09-0344. Epub 2024 Jun 18.

A genetically-encoded fluorescence-based reporter to spatiotemporally investigate mannose-6-phosphate pathway

Affiliations

A genetically-encoded fluorescence-based reporter to spatiotemporally investigate mannose-6-phosphate pathway

Mallika Bhat et al. Mol Biol Cell. .

Abstract

Maintenance of a pool of active lysosomes with acidic pH and degradative hydrolases is crucial for cell health. Abnormalities in lysosomal function are closely linked to diseases, such as lysosomal storage disorders, neurodegeneration, intracellular infections, and cancer among others. Emerging body of research suggests the malfunction of lysosomal hydrolase trafficking pathway to be a common denominator of several disease pathologies. However, available conventional tools to assess lysosomal hydrolase trafficking are insufficient and fail to provide a comprehensive picture about the trafficking flux and location of lysosomal hydrolases. To address some of the shortcomings, we designed a genetically-encoded fluorescent reporter containing a lysosomal hydrolase tandemly tagged with pH sensitive and insensitive fluorescent proteins, which can spatiotemporally trace the trafficking of lysosomal hydrolases. As a proof of principle, we demonstrate that the reporter can detect perturbations in hydrolase trafficking, that are induced by pharmacological manipulations and pathophysiological conditions like intracellular protein aggregates. This reporter can effectively serve as a probe for mapping the mechanistic intricacies of hydrolase trafficking pathway in health and disease and is a utilitarian tool to identify genetic and pharmacological modulators of this pathway, with potential therapeutic implications.


Conflict of interest statement

Conflicts of Interests: The authors declare no financial conflict of interest.

Figures

FIGURE 1:
FIGURE 1:
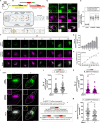
Tracking M6PRs: a routinely used method to monitor lysosomal hydrolase trafficking. (A) Schematic representation of M6P pathway. (B) Representative microscopy images of HeLa cells stained with MitoTracker/transfected with subcellular organelle marker constructs (mCherry-TGNP-N-10, mRFP-Rab5, mCherry-Rab7A, Lamp1-RFP, dsRed-Rab11) and CFP-CDM6PR. Scale bar, 10 μm. (C) Representative microscopy images of HeLa cells stained with MitoTracker/transfected with subcellular organelle marker constructs (mCherry-TGNP-N-10, mRFP-Rab5, mCherry-Rab7A, Lamp1-RFP, dsRed-Rab11) and immunostained for CI-M6PR. Scale bar, 10 μm. (D) Quantitation of Mander’s coefficients between CD-M6PR and subcellular organelle markers. M1 = Fraction of CD-M6PR colocalizing with subcellular organelle marker. M2 = Fraction of subcellular organelle marker colocalizing with CD-M6PR. (n ≥ 25, N = 3). M1 for MitoTracker compared with M1 for all the organelle markers. Also, M2 for MitoTracker compared with M2 for all the organelle markers. ****, p < 0.0001, one-way ANOVA with Sidak’s multiple comparisons test, mean ± SEM. (E) Quantitation of Mander’s coefficients between CI-M6PR and subcellular organelle markers. M1 = Fraction of CI-M6PR colocalizing with subcellular organelle marker. M2 = Fraction of subcellular organelle marker colocalizing with CI-M6PR. (n ≥ 25, N = 3). M1 for MitoTracker compared with M1 for all the organelle markers. Also, M2 for MitoTracker compared with M2 for all the organelle markers. ****, p < 0.0001, one-way ANOVA with Sidak’s multiple comparisons test, mean ± SEM.
FIGURE 2:
FIGURE 2:
Development of a reporter to investigate lysosomal hydrolase trafficking. (A) Schematic representation of expression vector for lysosomal hydrolase trafficking reporter under constitutive promoter: “CMV DNASE2-mCherry-sfGFP” (constitutive reporter). A model lysosomal hydrolase, DNASE2 is tandemly tagged with mCherry and sfGFP. (B) Schematic depiction of the working principle of the reporter. The reporter shows both sfGFP and mCherry fluorescence (sfGFP+mCherry+) (apparent yellow) when present in relatively less acidic cellular compartments like the ER, Golgi apparatus, and intermediate vesicles (TGN-derived vesicles, early endosome, maturing endosomes), whereas it shows sfGFPquenchedmCherry+ fluorescence (apparent red) when present in relatively more acidic lysosomal compartments. (C) Schematic depiction of the hypothetical distribution of the reporter in the cell under steady state and high or low hydrolase trafficking flux scenarios. When hydrolase trafficking flux is high, more reporter molecules are delivered to the lysosomes as compared with the steady state. When hydrolase trafficking flux is low/blocked, the reporter is restricted to either ER, Golgi apparatus, or intermediate vesicles, and its delivery to lysosomes is impaired. The status of hydrolase trafficking flux can be assessed using the reporter. (D) Representative microscopy images of HeLa cells transfected with the constitutive reporter and immunostained for COXIV/CD-M6PR/CI-M6PR. Scale bar, 10 μm. (E) Quantitation of colocalization of the reporter (using mCherry signal as marker for the reporter) with COXIV/CD-M6PR/CI-M6PR using Mander’s coefficients M1 and M2 (n ≥ 25, N = 3). M1 of CD-M6PR and CI-M6PR were compared with M1 of COXIV. M2 of CD-M6PR and CI-M6PR were compared with M2 of COXIV. ****, p < 0.0001, one-way ANOVA with Sidak’s multiple comparisons test, mean ± SEM. (F) Representative microscopy images of intracellular pH calibration of the reporter using HeLa cells expressing the constitutive reporter treated with calibration buffers of pH 4–7.5. Scale bar, 10 μm. (G) Quantitation of the ratio of sfGFP/mCherry intensity of the reporter per cell during intracellular pH calibration (n ≥ 25, N = 3). Mean ± SEM. (H) pH calibration graph to calculate pKa value of the constitutive reporter. (I) Representative microscopy images of HeLa cells expressing the constitutive reporter incubated in the presence (+) or absence (−) of BafA1 for 24 h. Scale bar, 10 μm. (J) Quantitation of change in the number of sfGFP+mCherry+ puncta induced by BafA1 treatment (n ≥ 25, N = 3). *, p < 0.05, Mann–Whitney test, mean ± SEM. (K) Quantitation of change in the number of sfGFPquenchedmCherry+ puncta induced by BafA1 treatment (n ≥ 25, N = 3). *, p < 0.05, Mann–Whitney test, mean ± SEM. (L) Formula used to calculate percentage of sfGFPquenchedmCherry+ puncta per cell. (M) Quantitation of percentage of sfGFPquenchedmCherry+ puncta per cell (n ≥ 25, N = 3). **, p < 0.01, unpaired t test, mean ± SEM.
FIGURE 3:
FIGURE 3:
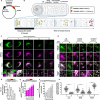
Inducible reporter enables temporal and stage-specific investigation of lysosomal hydrolase trafficking pathway. (A) Schematic representation of expression vector for lysosomal hydrolase trafficking reporter under inducible promoter: “Tet-On DNASE2-mCherry-sfGFP” (inducible reporter). (B) Schematic depiction of pulse-chase analysis of hydrolase trafficking using inducible reporter. (C) Representative microscopy images of pulse-chase analysis of lysosomal hydrolase trafficking using inducible reporter. HeLa cells transfected with the inducible reporter were treated with doxycycline for 2 h (pulse) followed by 0, 6, 12, 18, and 24 h chase. Scale bar, 10 μm. (D) Quantitation of the number of sfGFP+mCherry+ reporter puncta per cell at 0, 6, 12, 18, and 24 h chase (n ≥ 25, N = 3). ns, nonsignificant; ****, p < 0.0001, Kruskal–Wallis test with Dunn’s multiple comparisons test using 0 h as control group. Mean ± SEM. (E) Quantitation of the number of sfGFPquenchedmCherry+ reporter puncta per cell at 0, 6, 12, 18, and 24 h chase (n ≥ 25, N = 3). ns, nonsignificant; **, p < 0.01; ****, p < 0.0001; Kruskal–Wallis test with Dunn’s multiple comparisons test using 0 h as control group. Mean ± SEM. (F) Percentage of sfGFPquenchedmCherry+ reporter puncta per cell across chase time period (n ≥ 25, N = 3). ns, nonsignificant; ****, p <0.0001, one-way ANOVA with Dunnett’s multiple comparisons test using 0 h as control group. Mean ± SEM. (G) Representative microscopy images of HeLa cells showing chase time-dependent change in the colocalization of the inducible reporter with organelle markers. HeLa cells transfected with the inducible reporter were treated with doxycycline for 2 h followed by 0 or 24 h chase. The cells were immunostained for KDEL (ER marker), GM130 (cis-Golgi marker) and LAMP1 (lysosomal marker). mCherry signal of the inducible reporter was used for analysis. Enhanced local contrast function in ImageJ used for sfGFP and mCherry channels to enhance the visualization of ER network for the panel: colocalization with ER (KDEL). Quantitation performed on raw data. Scale bar, 10 μm. (H) Quantitation of % reporter area colocalizing with indicated organelle markers at 0 and 24 h chase timepoints (Mander’s coefficient M2*100) (n ≥ 25, N = 3). ****, p<0.0001, one-way ANOVA with Sidak’s multiple comparisons test. Mean ± SEM.
FIGURE 4:
FIGURE 4:
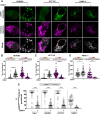
Inducible reporter responds to changes in hydrolase trafficking flux. (A) Representative microscopy images of HeLa cells showing the effect of known chemical modulators of hydrolase trafficking on the inducible reporter. HeLa cells transfected with the inducible reporter were treated with doxycycline for 2 h (pulse) followed by chase for 24 h in the presence/absence of the compounds. UT: untreated, DMSO: Dimethyl sulfoxide as solvent control, BFA: Brefeldin A, Noco: Nocodazole, BafA1: Bafilomycin A1, CQ: Chloroquine, Ami: Amiodarone. Scale bar, 10 μm. (B–D) Quantitation of the effect of compound treatment on the reporter (n ≥ 25, N = 3). (B) Number of sfGFP+mCherry+ reporter puncta per cell. ns, nonsignificant; ****, p < 0.0001, Kruskal–Wallis test with Dunn’s multiple comparisons test with UTs as control group. Mean ± SEM. (C) Number of sfGFPquenchedmCherry+ reporter puncta per cell. ns, nonsignificant; ***, p < 0.001; ****, p < 0.0001, Kruskal-Wallis test with Dunn’s multiple comparisons test with UT as control group. (D) Percentage of sfGFPquenchedmCherry+ reporter puncta per cell. ns, nonsignificant; ****, p < 0.0001, one-way ANOVA with Dunnett’s multiple comparisons test with UT as control group. Mean ± SEM. (E) Representative microscopy images of HeLa cells showing the effect of puromycin-induced intracellular protein aggregates on the inducible reporter. HeLa cells transfected with the inducible reporter were treated with doxycycline for 2 h (pulse) followed by 24 h chase with/without puromycin treatment and immunostaining for p62. Scale bar, 10 μm. (F) Quantitation of the size of p62 puncta upon puromycin treatment. A total of 500 puncta from 75 cells were quantified (n = 25 cells, N = 3 experiments). ****, p < 0.0001, Kolmogorov–Smirnov test. Mean ± SEM. (G–I) Quantitation of the effect of puromycin-induced intracellular protein aggregates on the reporter (n ≥ 25, N = 3). ****, p < 0.0001; Mann–Whitney test. Mean ± SEM. (G) Number of sfGFP+mCherry+ reporter puncta per cell. (H) Number of sfGFPquenchedmCherry+ reporter puncta per cell. (I) Percentage of sfGFPquenched mCherry+ reporter puncta per cell.
FIGURE 5:
FIGURE 5:
Inducible reporter can track modulations in the hydrolase trafficking flux across cell types. (A) Representative microscopy images of HEK293, HCT116, and PANC-1 cells transfected with the inducible reporter, treated with doxycycline for 2 h (pulse) followed by 24 h chase with/without BafA1. Scale bar, 10 μm. (B–D) Quantitation of the effect of BafA1 treatment on the reporter across cell types. Number of sfGFP+mCherry+ reporter puncta per cell and number of sfGFPquenchedmCherry+ reporter puncta per cell was quantitated for each cell type. *, p < 0.05; ****, p < 0.0001; Kruskal–Wallis test with Dunn’s multiple comparisons test, mean ± SEM. (B) HEK293 cells (n ≥ 25, N = 3). (C) HCT116 cells. (n ≥ 25, N = 3). (D) PANC-1 cells. (n ≥ 18, N = 3). (E) Quantitation of the percentage of sfGFPquenchedmCherry+ reporter puncta per cell across HeLa, HEK293, HCT116, and PANC-1 cells. (HeLa cells data same as in Figure 4D). ****, p < 0.0001, one-way ANOVA with Sidak’s multiple comparisons test. Mean ± SEM.

Similar articles

References

    1. Anitei M, Chenna R, Czupalla C, Esner M, Christ S, Lenhard S, Korn K, Meyenhofer F, Bickle M, Zerial M, Hoflack B (2014). A high throughput siRNA screen identifies genes that regulate mannose 6-phosphate receptor trafficking. J Cell Sci 127, 5079–5092. - PubMed
    1. Aviner R (2020). The science of puromycin: From studies of ribosome function to applications in biotechnology. Comput Struct Biotechnol J 18, 1074–1083. - PMC - PubMed
    1. Ballabio A, Bonifacino JS (2020). Lysosomes as dynamic regulators of cell and organismal homeostasis. Nat Rev Mol Cell Biol 21, 101–118. - PubMed
    1. Bärlocher K, Welin A, Hilbi H (2017). Formation of the Legionella replicative compartment at the crossroads of retrograde trafficking. Front Cell Infect Microbiol 7, 482. - PMC - PubMed
    1. Bayer N, Schober D, Prchla E, Murphy RF, Blaas D, Fuchs R (1998). Effect of bafilomycin A1 and nocodazole on endocytic transport in HeLa cells: Implications for viral uncoating and infection. J Virol 72, 9645–9655. - PMC - PubMed

LinkOut - more resources