

Separation of Activated T Cells Using Multidimensional Double Spiral (MDDS) Inertial Microfluidics for High-Efficiency CAR T Cell Manufacturing
- PMID: 38889002
- PMCID: PMC11818483
- DOI: 10.1021/acs.analchem.4c01981
Separation of Activated T Cells Using Multidimensional Double Spiral (MDDS) Inertial Microfluidics for High-Efficiency CAR T Cell Manufacturing
Abstract
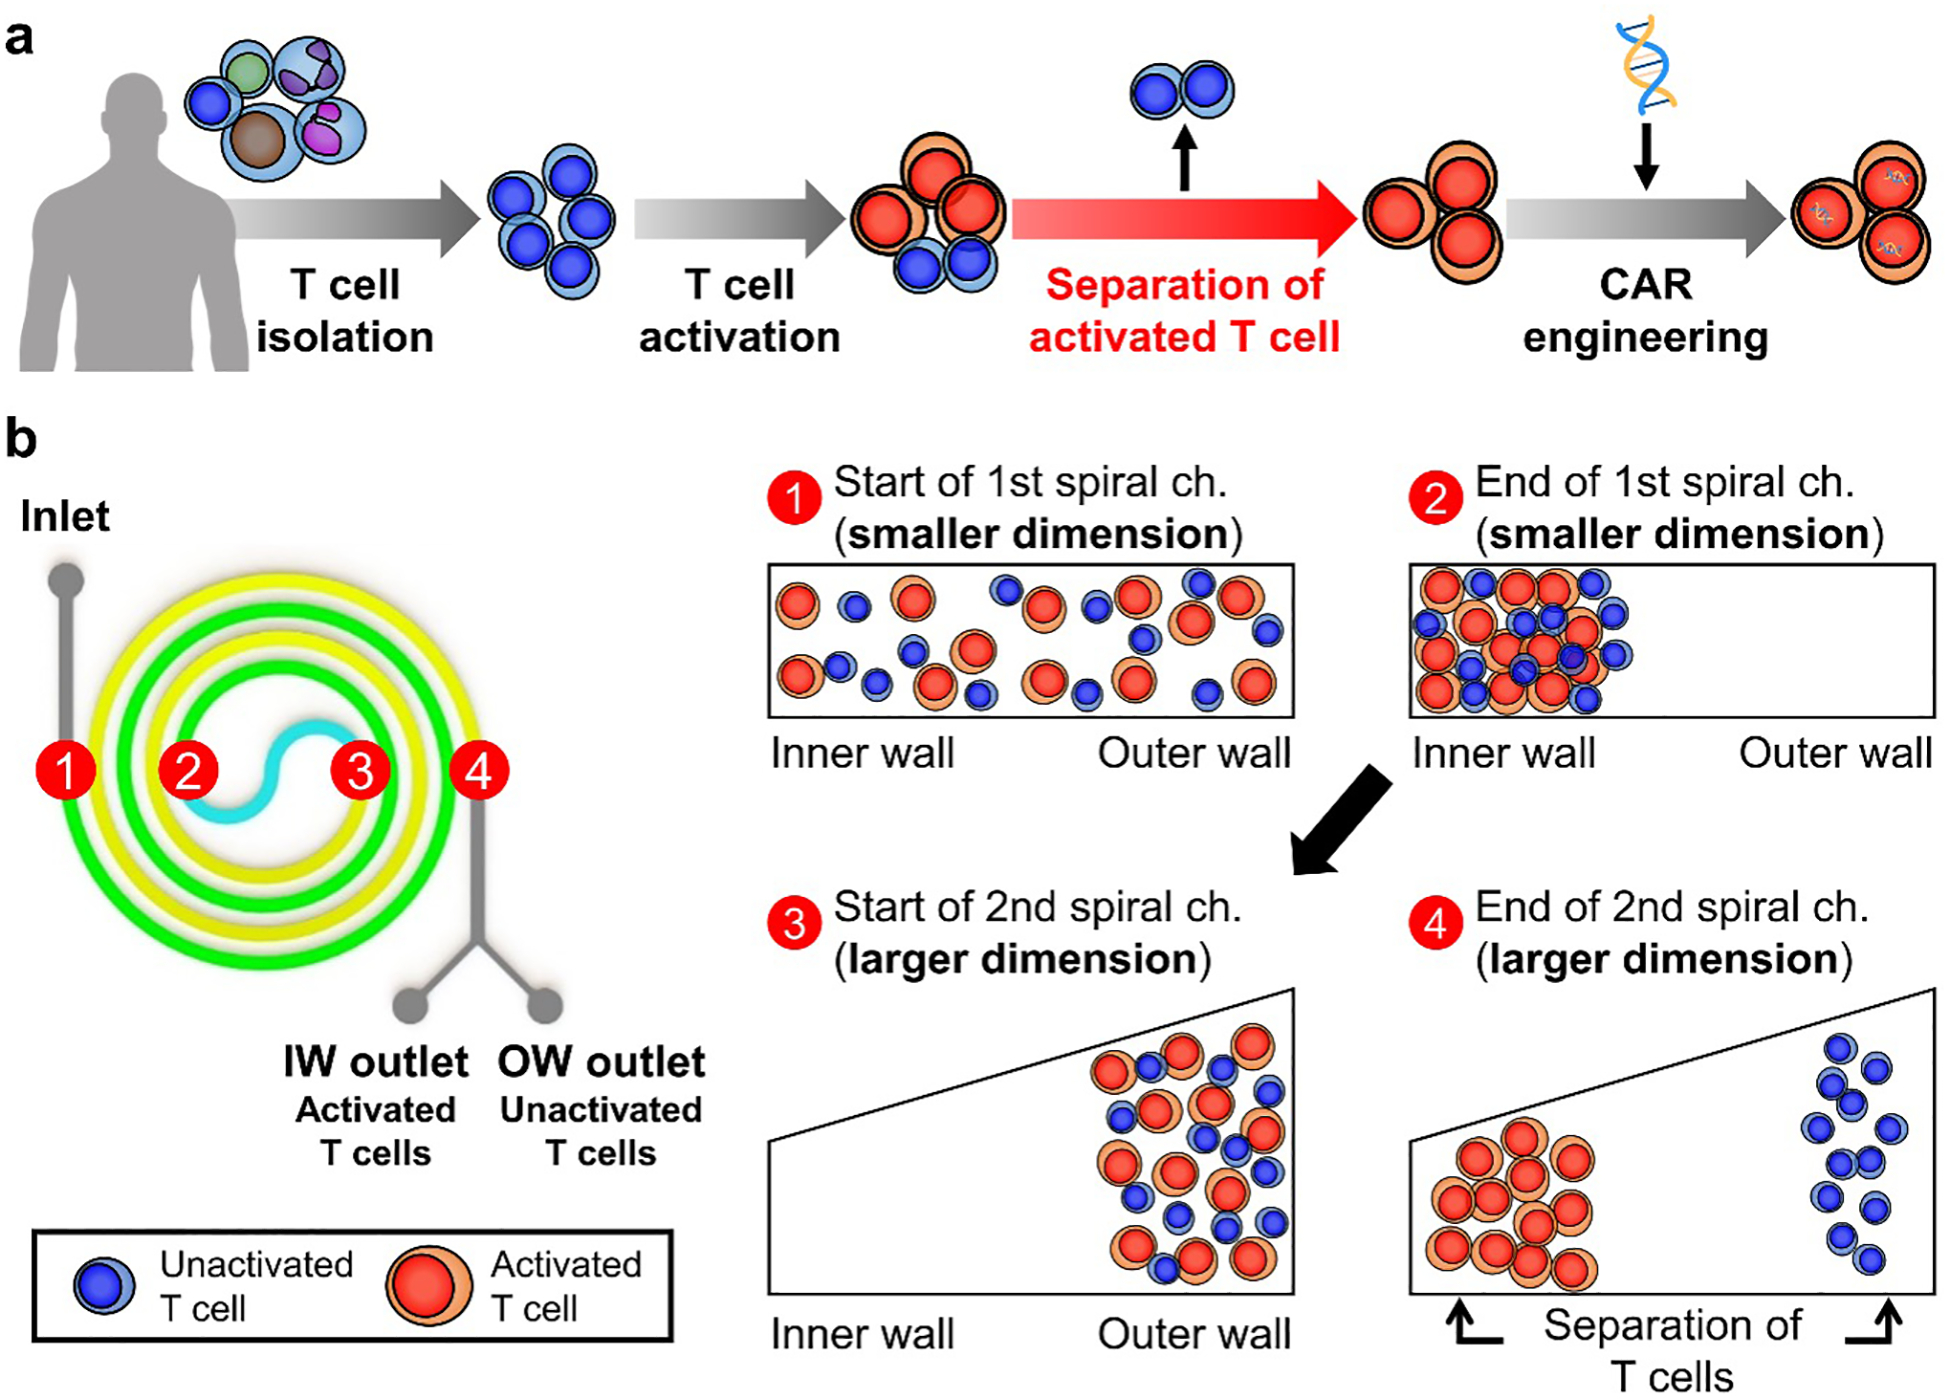
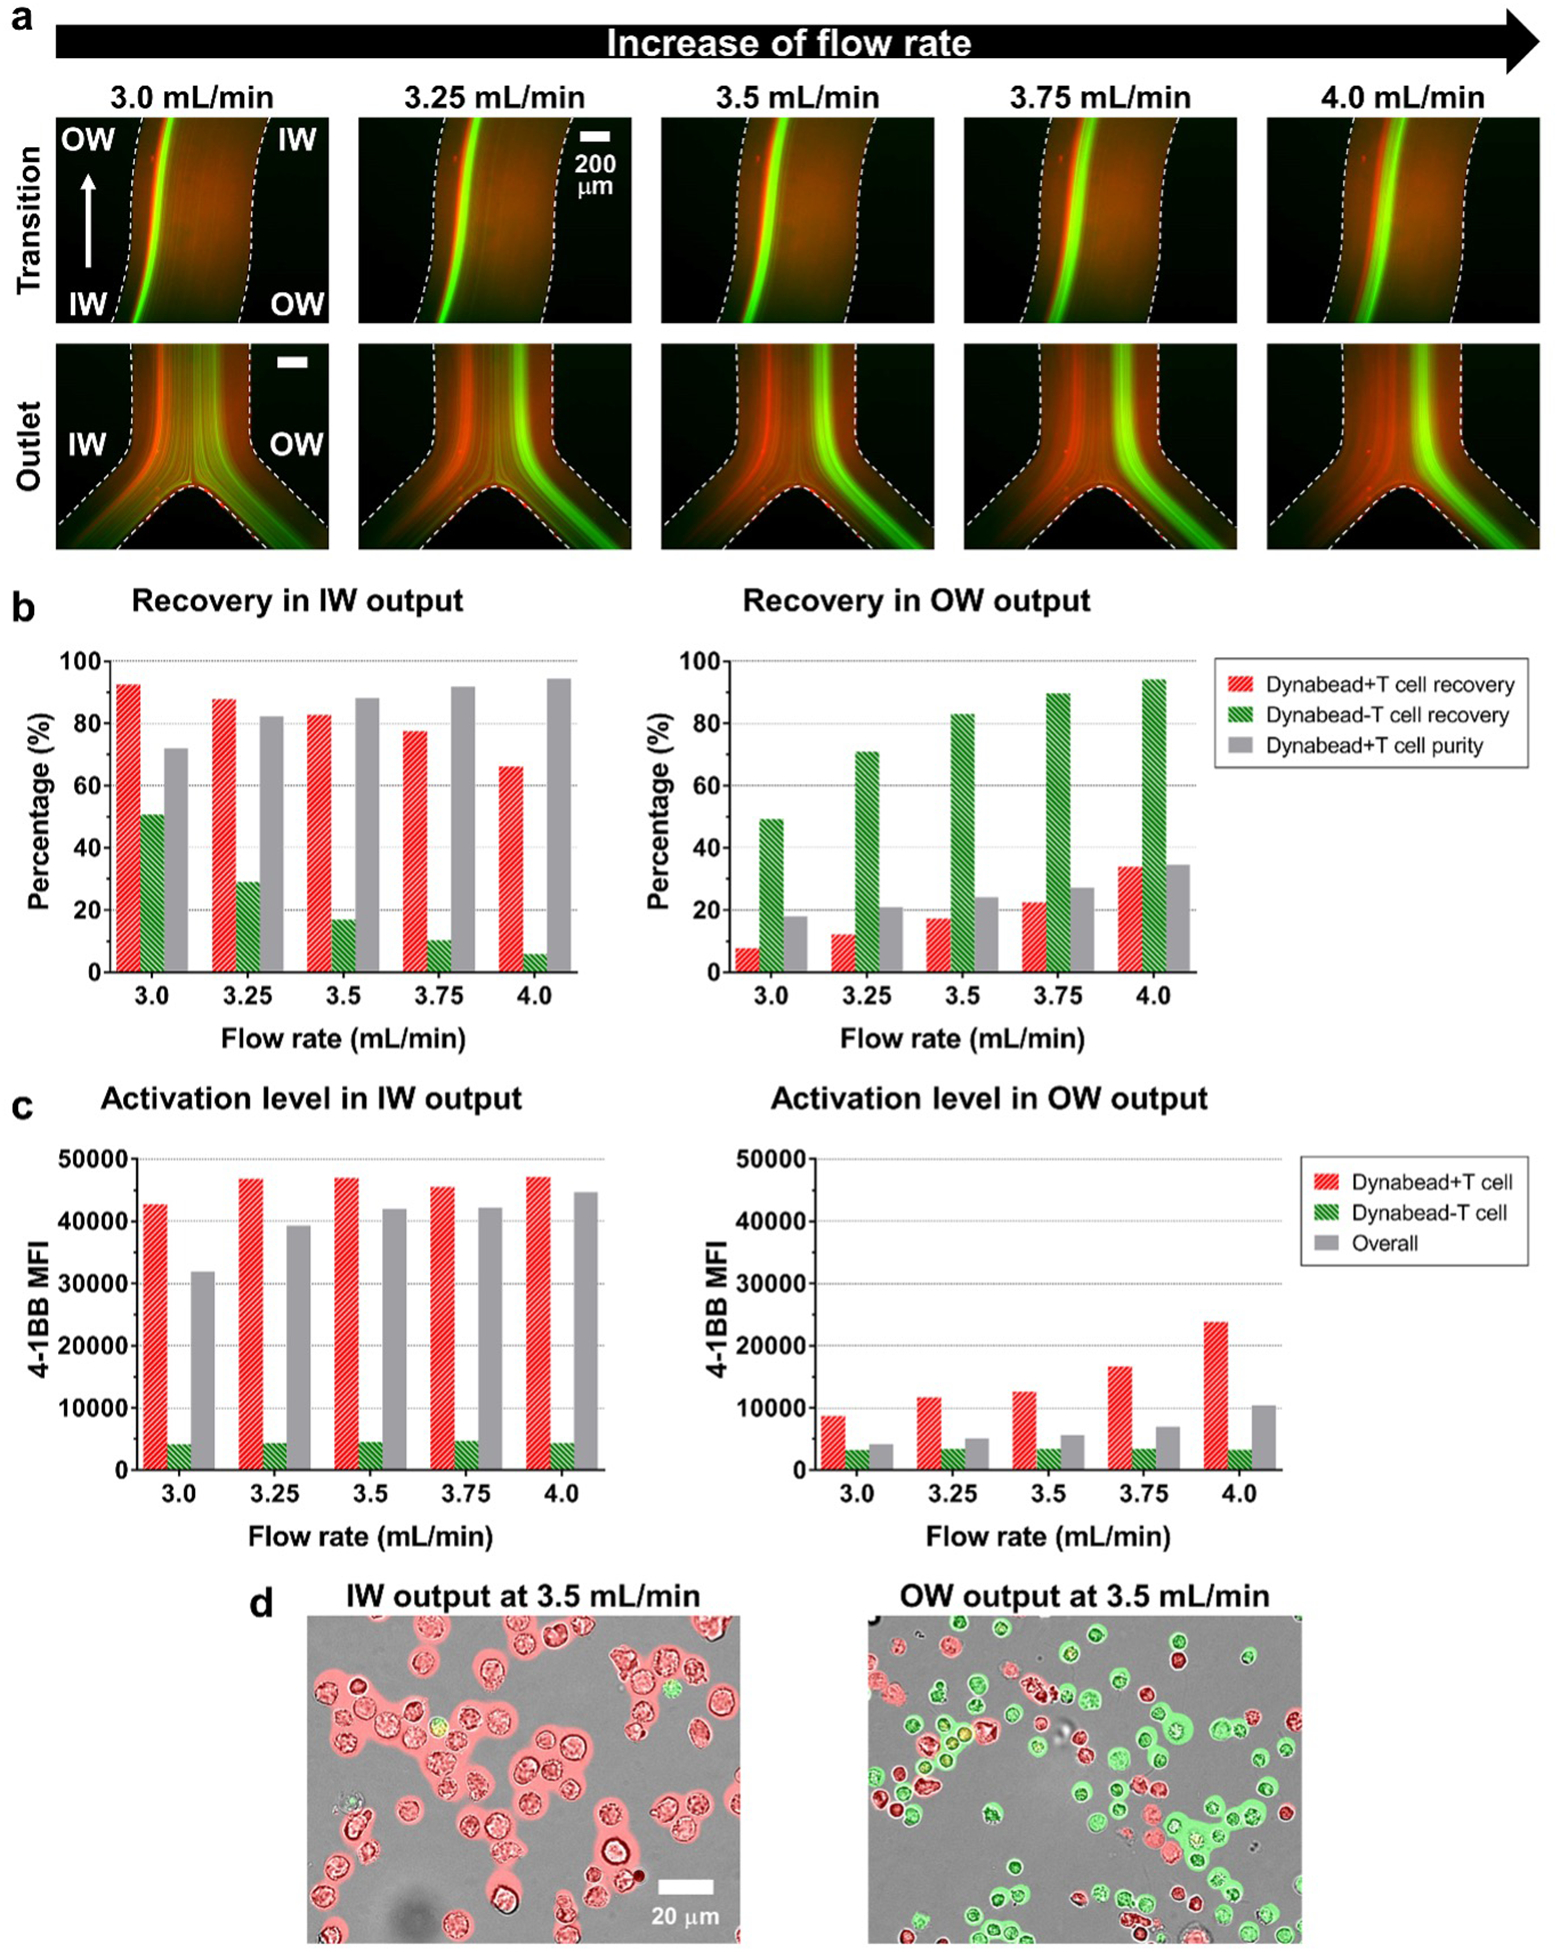
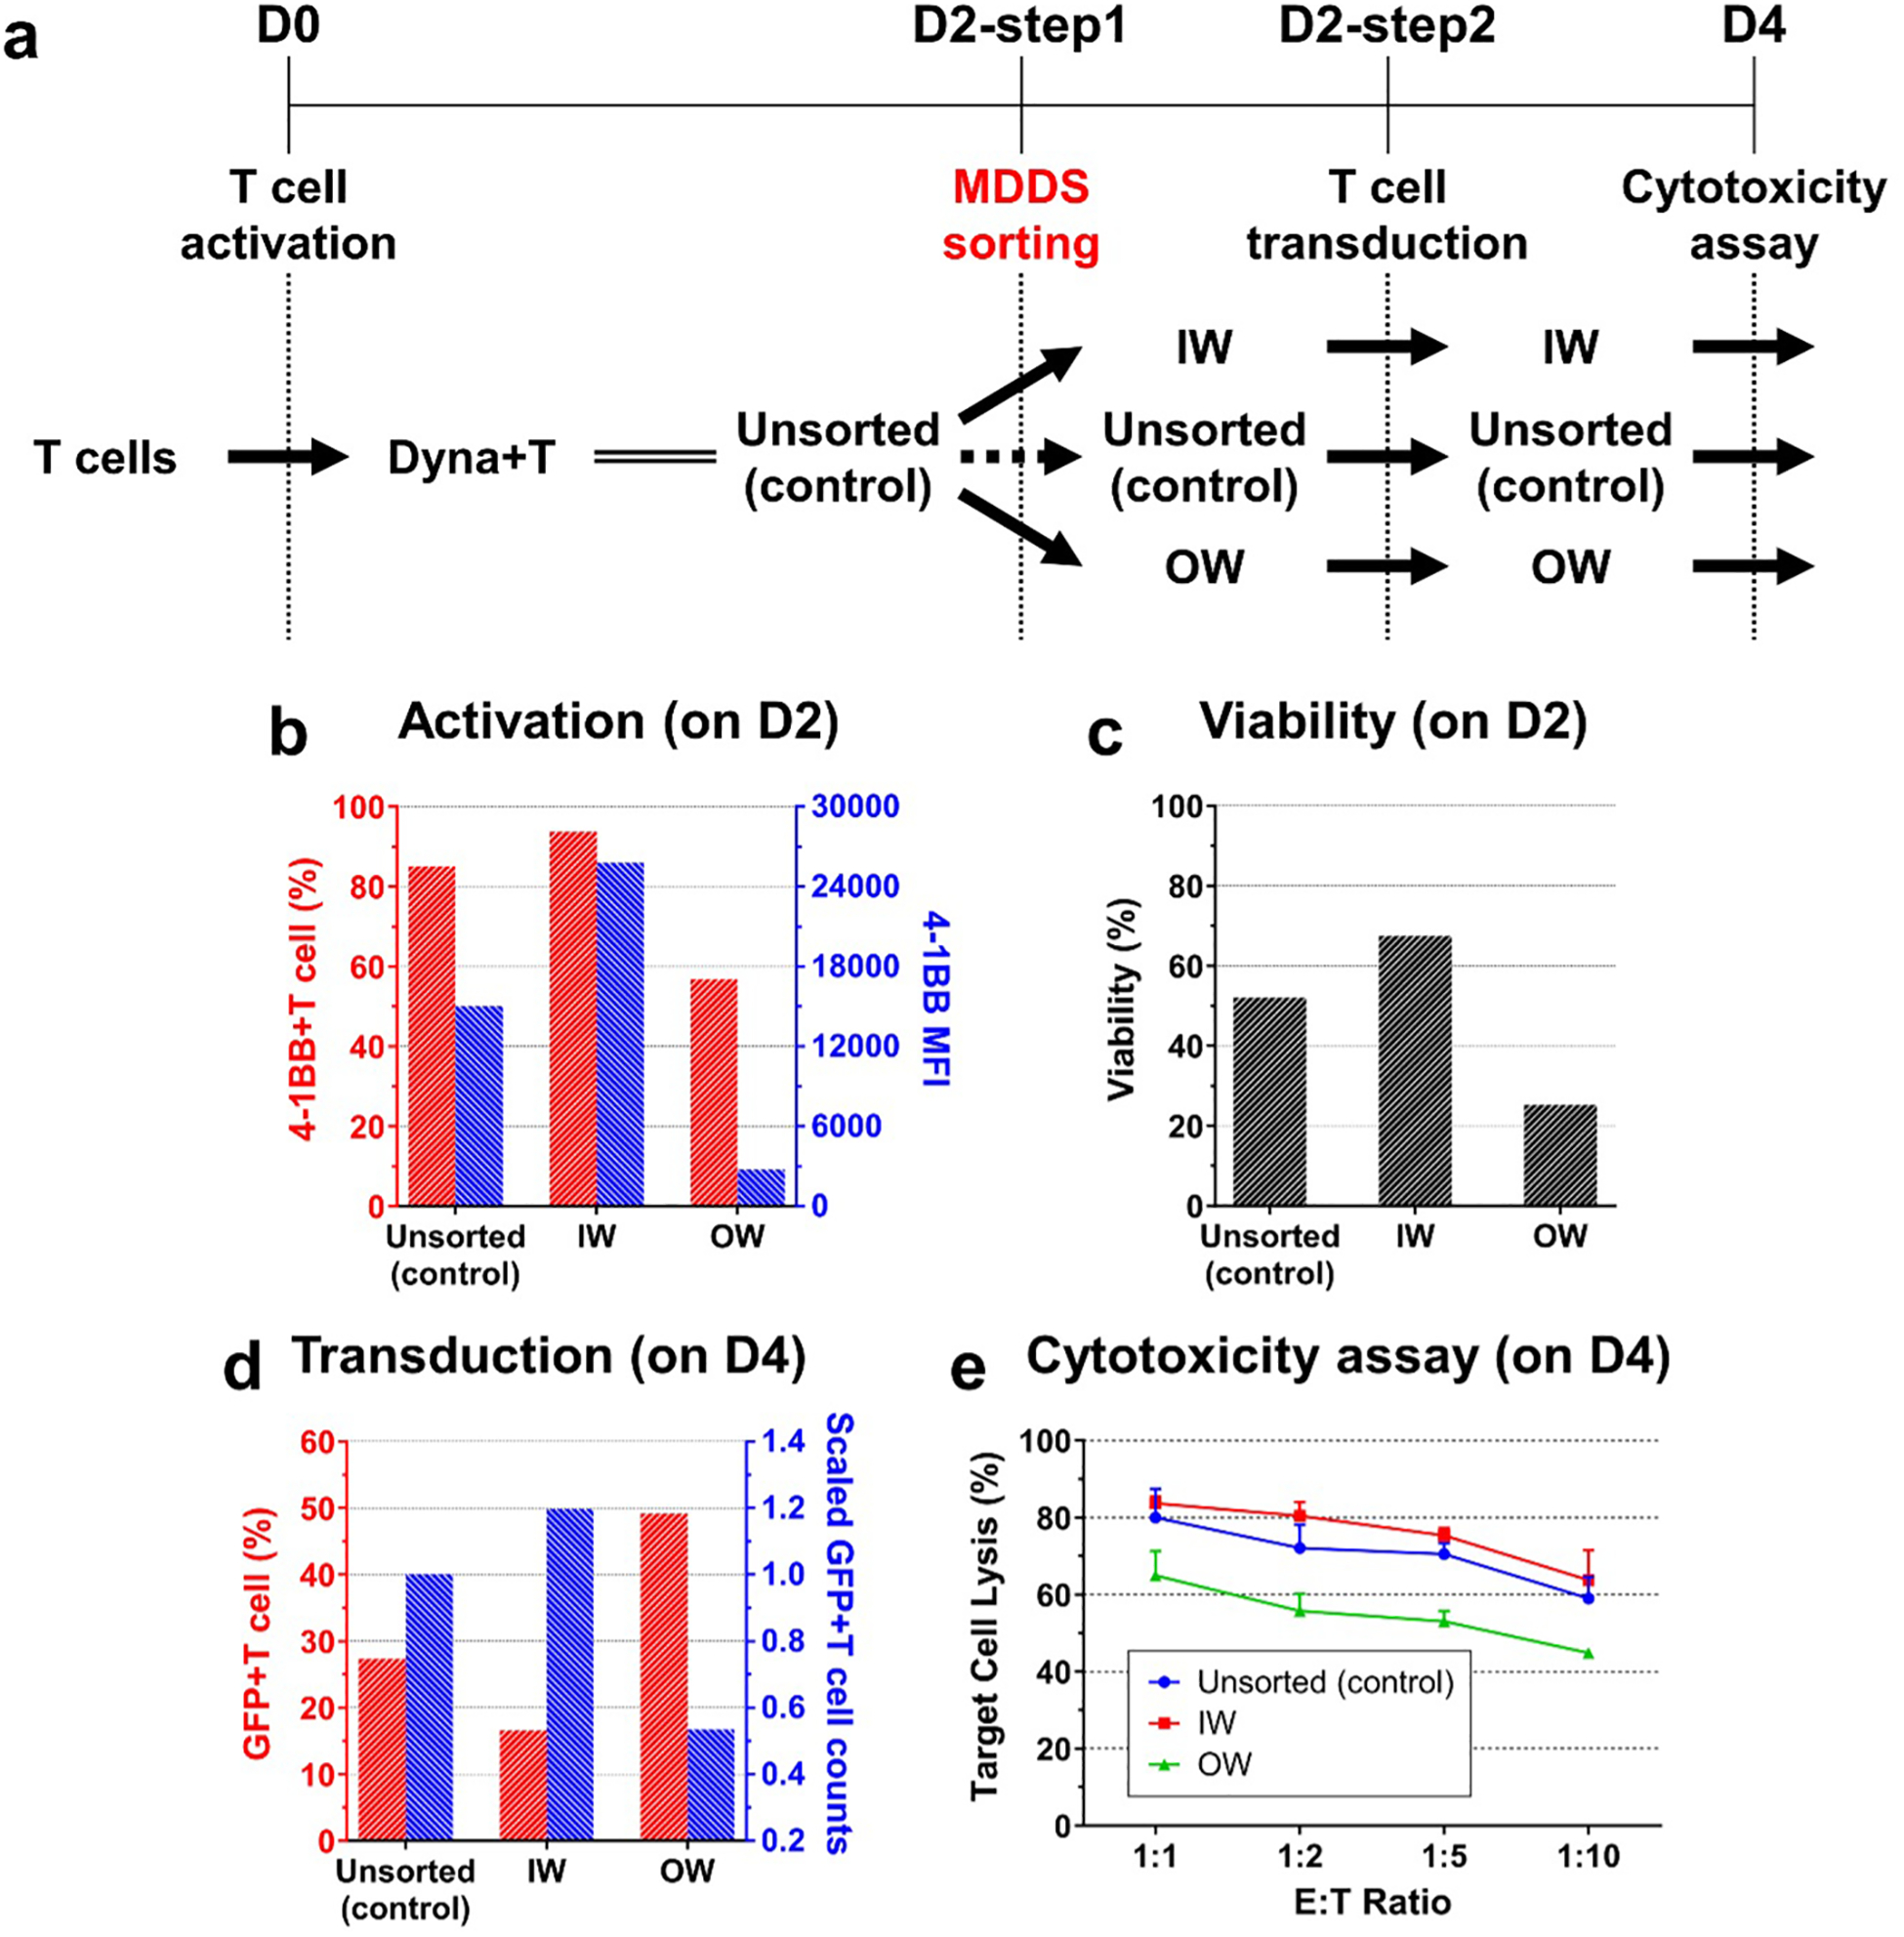
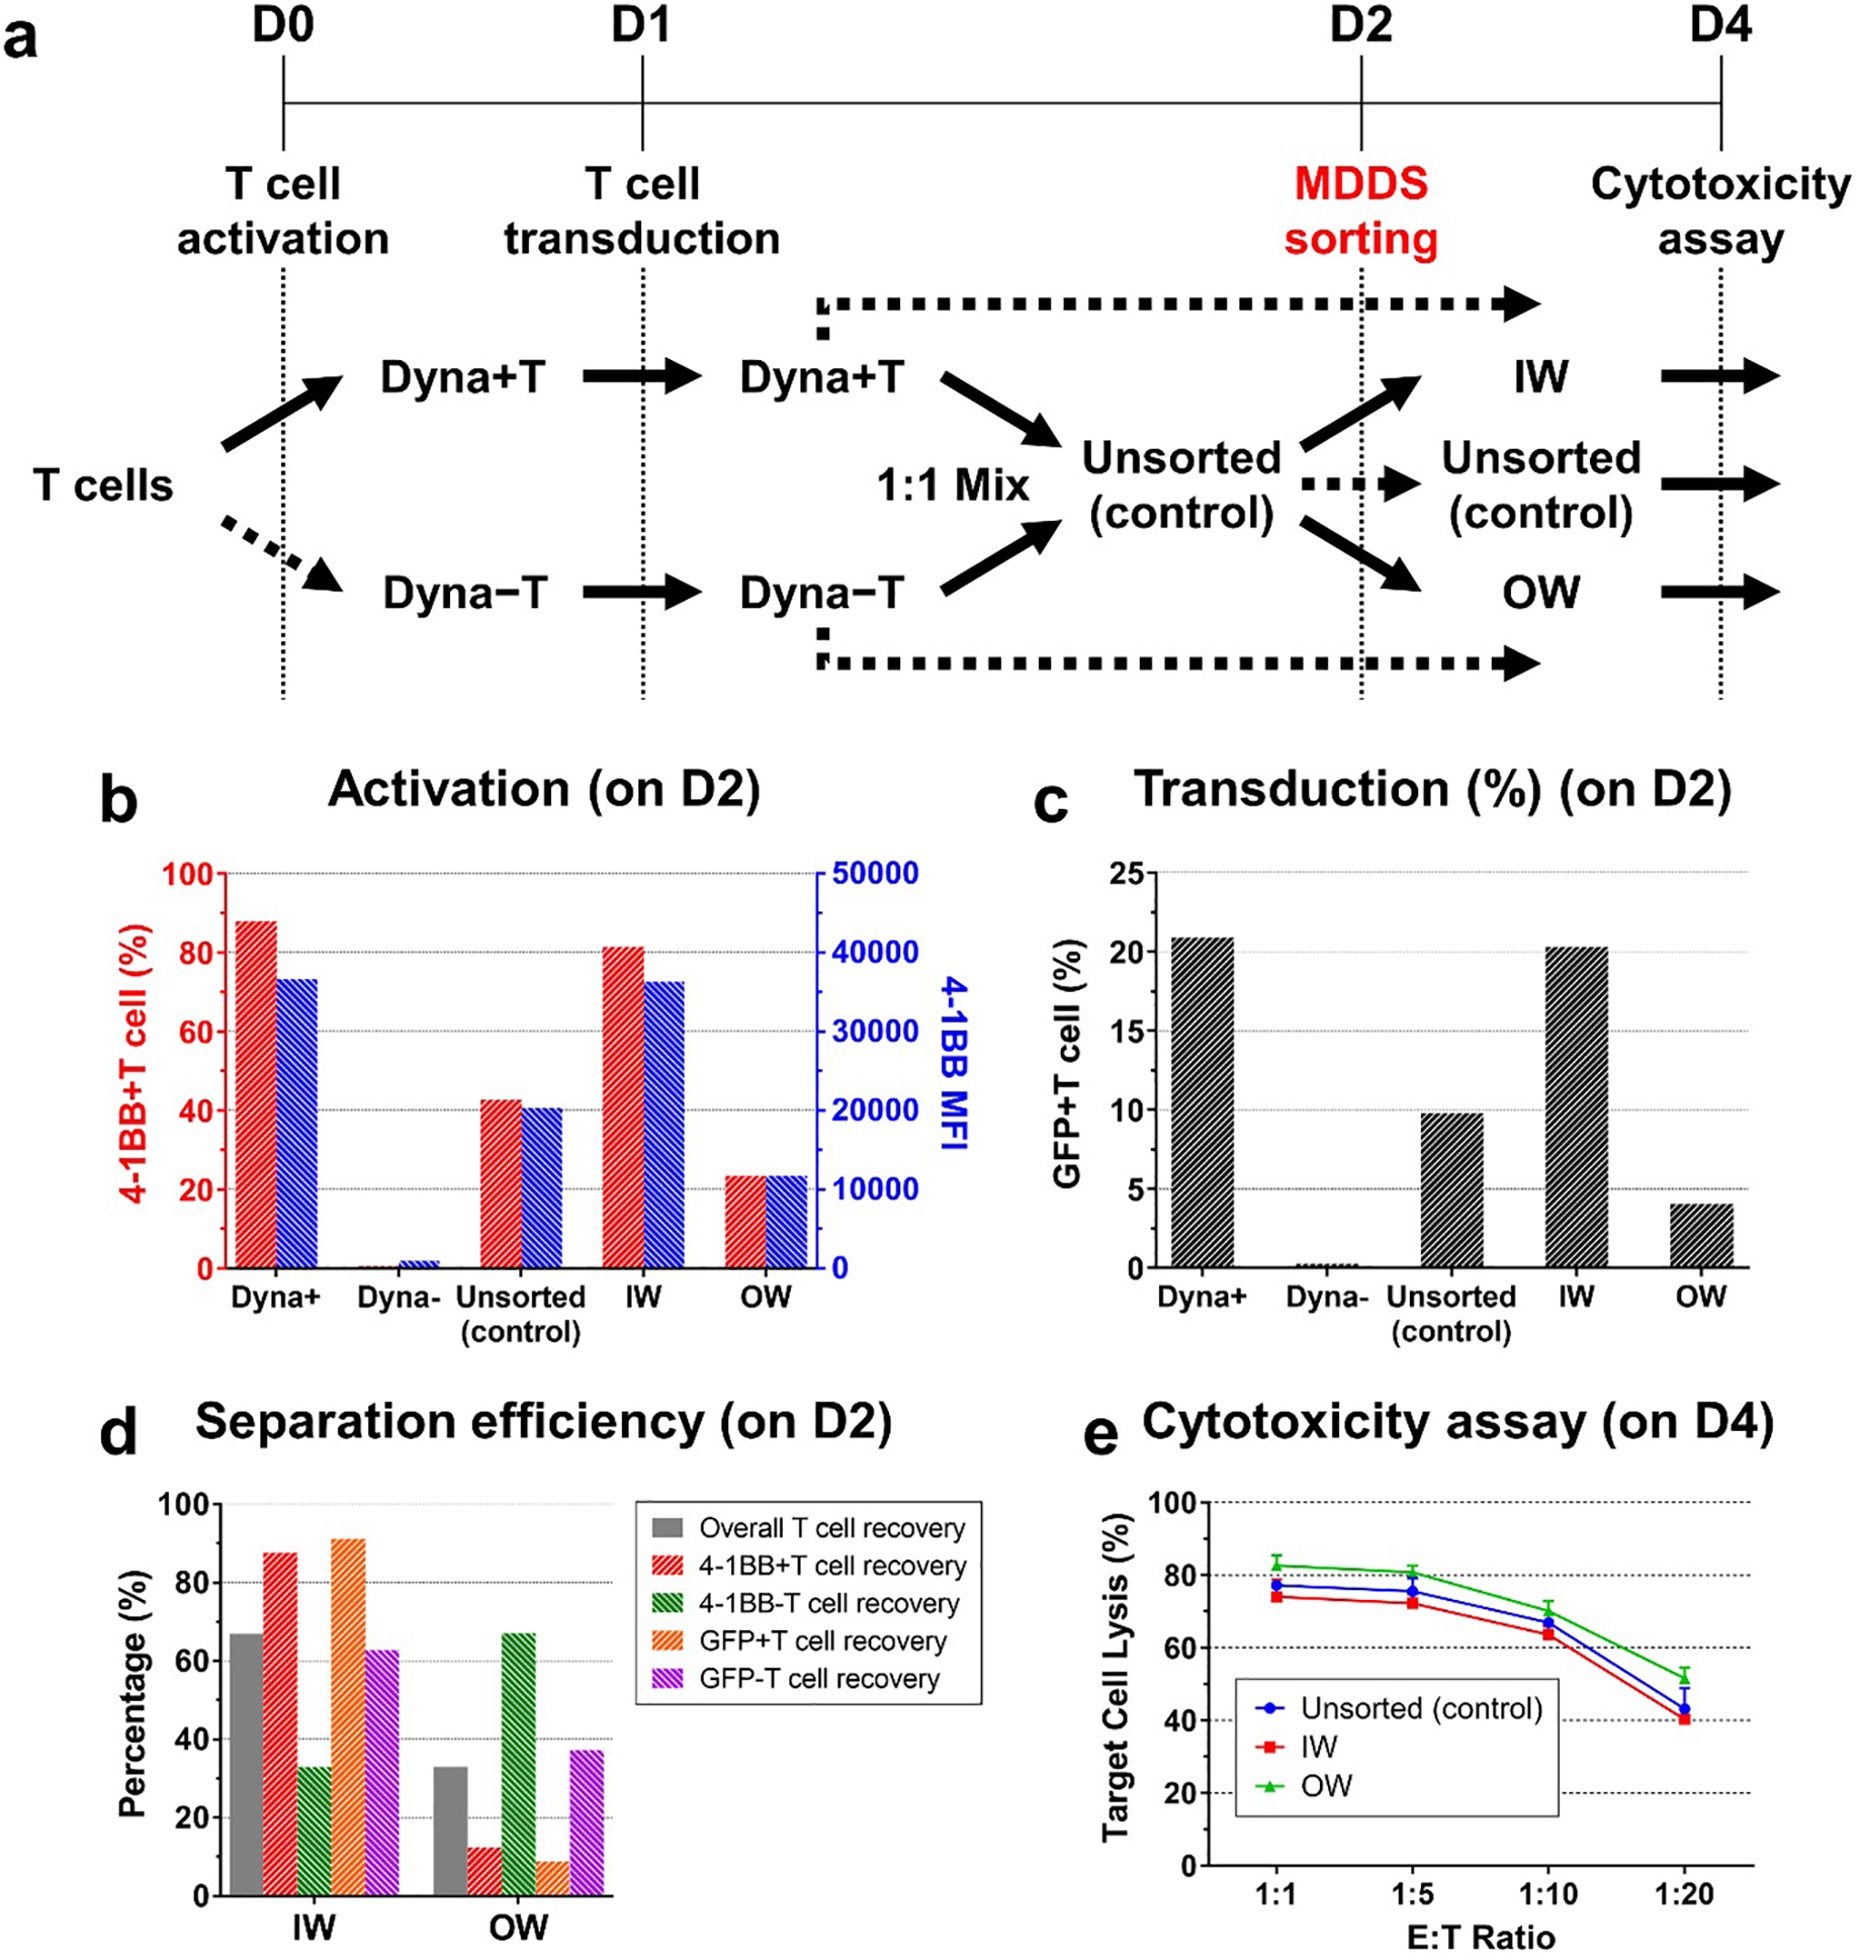
This study introduces a T cell enrichment process, capitalizing on the size differences between activated and unactivated T cells to facilitate the isolation of activated, transducible T cells. By employing multidimensional double spiral (MDDS) inertial sorting, our approach aims to remove unactivated or not fully activated T cells post-activation, consequently enhancing the efficiency of chimeric antigen receptor (CAR) T cell manufacturing. Our findings reveal that incorporating a simple, label-free, and continuous MDDS sorting step yields a purer T cell population, exhibiting significantly enhanced viability and CAR-transducibility (with up to 85% removal of unactivated T cells and approximately 80% recovery of activated T cells); we found approximately 2-fold increase in CAR transduction efficiency for a specific sample, escalating from ∼10% to ∼20%, but this efficiency highly depends on the original T cell sample as MDDS sorting would be more effective for samples possessing a higher proportion of unactivated T cells. This new cell separation process could augment the efficiency, yield, and cost-effectiveness of CAR T cell manufacturing, potentially broadening the accessibility of this transformative therapy and contributing to improved patient outcomes.
Conflict of interest statement
Declaration of competing interest
H.J. and J.H. have patents and patent applications on spiral particle separation processes, which are managed by MIT.
M.E.B. is an equity holder in 3T Biosciences, and is a co-founder, equity holder, and consultant of Kelonia Therapeutics and Abata Therapeutics.
Figures
Similar articles
-
Use of cellular FAD autofluorescence as a label-free cellular attribute for the production of chimeric antigen receptor T cells.Cytotherapy. 2025 Aug;27(8):991-1000. doi: 10.1016/j.jcyt.2025.05.002. Epub 2025 May 15. Cytotherapy. 2025. PMID: 40481831
-
Chimeric antigen receptor (CAR) T-cell therapy for people with relapsed or refractory diffuse large B-cell lymphoma.Cochrane Database Syst Rev. 2021 Sep 13;9(9):CD013365. doi: 10.1002/14651858.CD013365.pub2. Cochrane Database Syst Rev. 2021. PMID: 34515338 Free PMC article.
-
A 3-in-1 integrated automated platform for rapid CAR-T cell manufacturing: activation, transduction, and expansion in a hollow-fiber system.Cytotherapy. 2025 Aug;27(8):1001-1012. doi: 10.1016/j.jcyt.2025.05.006. Epub 2025 May 23. Cytotherapy. 2025. PMID: 40542807
-
Controlled activation modulates T-cell expansion and phenotype in stirred-tank bioreactors.Cytotherapy. 2025 Jun;27(6):774-781. doi: 10.1016/j.jcyt.2025.02.003. Epub 2025 Feb 14. Cytotherapy. 2025. PMID: 40019461
-
A rapid and systematic review of the clinical effectiveness and cost-effectiveness of paclitaxel, docetaxel, gemcitabine and vinorelbine in non-small-cell lung cancer.Health Technol Assess. 2001;5(32):1-195. doi: 10.3310/hta5320. Health Technol Assess. 2001. PMID: 12065068
Cited by
-
Deciphering the Evolution of Inertial Migration in Serpentine Channels.Anal Chem. 2024 Sep 3;96(35):14306-14314. doi: 10.1021/acs.analchem.4c03474. Epub 2024 Aug 21. Anal Chem. 2024. PMID: 39165174 Free PMC article.
References
-
- Maude SL; Laetsch TW; Buechner J; Rives S; Boyer M; Bittencourt H; Bader P; Verneris MR; Stefanski HE; Myers GD; Qayed M; De Moerloose B; Hiramatsu H; Schlis K; Davis KL; Martin PL; Nemecek ER; Yanik GA; Peters C; Baruchel A; Boissel N; Mechinaud F; Balduzzi A; Krueger J; June CH; Levine BL; Wood P; Taran T; Leung M; Mueller KT; Zhang Y; Sen K; Lebwohl D; Pulsipher MA; Grupp SA Tisagenlecleucel in Children and Young Adults with B-Cell Lymphoblastic Leukemia. N. Engl. J. Med 2018, 378 (5), 439–448. 10.1056/nejmoa1709866. - DOI - PMC - PubMed
-
- Poltorak MP; Graef P; Tschulik C; Wagner M; Cletiu V; Dreher S; Borjan B; Fraessle SP; Effenberger M; Turk M; Busch DH; Plitzko J; Kugler DG; Ragan S; Schmidt T; Stemberger C; Germeroth L Expamers: A New Technology to Control T Cell Activation. Sci. Rep 2020, 10 (1). 10.1038/s41598-020-74595-8. - DOI - PMC - PubMed
Publication types
MeSH terms
Substances
Grants and funding
LinkOut - more resources
Full Text Sources
