An enhancer RNA recruits KMT2A to regulate transcription of Myb
- PMID: 38889007
- PMCID: PMC11369905
- DOI: 10.1016/j.celrep.2024.114378
An enhancer RNA recruits KMT2A to regulate transcription of Myb
Abstract
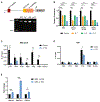
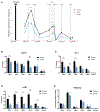
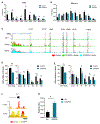
The Myb proto-oncogene encodes the transcription factor c-MYB, which is critical for hematopoiesis. Distant enhancers of Myb form a hub of interactions with the Myb promoter. We identified a long non-coding RNA (Myrlin) originating from the -81-kb murine Myb enhancer. Myrlin and Myb are coordinately regulated during erythroid differentiation. Myrlin TSS deletion using CRISPR-Cas9 reduced Myrlin and Myb expression and LDB1 complex occupancy at the Myb enhancers, compromising enhancer contacts and reducing RNA Pol II occupancy in the locus. In contrast, CRISPRi silencing of Myrlin left LDB1 and the Myb enhancer hub unperturbed, although Myrlin and Myb expressions were downregulated, decoupling transcription and chromatin looping. Myrlin interacts with the KMT2A/MLL1 complex. Myrlin CRISPRi compromised KMT2A occupancy in the Myb locus, decreasing CDK9 and RNA Pol II binding and resulting in Pol II pausing in the Myb first exon/intron. Thus, Myrlin directly participates in activating Myb transcription by recruiting KMT2A.
Keywords: CP: Molecular biology; H3K4me3; KMT2A; MLL1; Myb; Pol II pause release; enhancer RNA; enhancer hub; erythroid differentiation; gene expression; lncRNA.
Published by Elsevier Inc.
Conflict of interest statement
Declaration of interests The authors declare no competing interests.
Figures


Update of
-
An enhancer RNA recruits MLL1 to regulate transcription of Myb.bioRxiv [Preprint]. 2023 Oct 12:2023.09.26.559528. doi: 10.1101/2023.09.26.559528. bioRxiv. 2023. Update in: Cell Rep. 2024 Jul 23;43(7):114378. doi: 10.1016/j.celrep.2024.114378. PMID: 37808852 Free PMC article. Updated. Preprint.
Similar articles
-
An enhancer RNA recruits MLL1 to regulate transcription of Myb.bioRxiv [Preprint]. 2023 Oct 12:2023.09.26.559528. doi: 10.1101/2023.09.26.559528. bioRxiv. 2023. Update in: Cell Rep. 2024 Jul 23;43(7):114378. doi: 10.1016/j.celrep.2024.114378. PMID: 37808852 Free PMC article. Updated. Preprint.
-
Dynamic long-range chromatin interactions control Myb proto-oncogene transcription during erythroid development.EMBO J. 2012 Feb 15;31(4):986-99. doi: 10.1038/emboj.2011.450. Epub 2011 Dec 13. EMBO J. 2012. PMID: 22157820 Free PMC article.
-
c-Myb and GATA-3 cooperatively regulate IL-13 expression via conserved GATA-3 response element and recruit mixed lineage leukemia (MLL) for histone modification of the IL-13 locus.J Immunol. 2011 Dec 1;187(11):5974-82. doi: 10.4049/jimmunol.1100550. Epub 2011 Oct 28. J Immunol. 2011. PMID: 22039304 Free PMC article.
-
Non-coding Transcripts from Enhancers: New Insights into Enhancer Activity and Gene Expression Regulation.Genomics Proteomics Bioinformatics. 2017 Jun;15(3):201-207. doi: 10.1016/j.gpb.2017.02.003. Epub 2017 Jun 17. Genomics Proteomics Bioinformatics. 2017. PMID: 28599852 Free PMC article. Review.
-
Chromatin and aberrant enhancer activity in KMT2A rearranged acute lymphoblastic leukemia.Curr Opin Genet Dev. 2024 Jun;86:102191. doi: 10.1016/j.gde.2024.102191. Epub 2024 Apr 4. Curr Opin Genet Dev. 2024. PMID: 38579381 Review.
Cited by
-
Enhancer looping protein LDB1 modulates MYB expression in T-ALL cell lines in vitro by cooperating with master transcription factors.J Exp Clin Cancer Res. 2024 Oct 9;43(1):283. doi: 10.1186/s13046-024-03199-1. J Exp Clin Cancer Res. 2024. PMID: 39385230 Free PMC article.
-
Enhancer reprogramming: critical roles in cancer and promising therapeutic strategies.Cell Death Discov. 2025 Mar 3;11(1):84. doi: 10.1038/s41420-025-02366-3. Cell Death Discov. 2025. PMID: 40032852 Free PMC article. Review.
-
In vivo deletion of a GWAS-identified Myb distal enhancer acts on Myb expression, globin switching, and clinical erythroid parameters in β-thalassemia.Sci Rep. 2025 Mar 15;15(1):8996. doi: 10.1038/s41598-025-94222-8. Sci Rep. 2025. PMID: 40089598 Free PMC article.
-
The immune system in cardiovascular diseases: from basic mechanisms to therapeutic implications.Signal Transduct Target Ther. 2025 May 23;10(1):166. doi: 10.1038/s41392-025-02220-z. Signal Transduct Target Ther. 2025. PMID: 40404619 Free PMC article. Review.
-
A Super Enhancer-Derived Enhancer RNA Acts Together with CTCF/Cohesin in Trans to Regulate Erythropoiesis.Genes (Basel). 2025 Mar 28;16(4):389. doi: 10.3390/genes16040389. Genes (Basel). 2025. PMID: 40282349 Free PMC article.
References
-
- Derrien T, Johnson R, Bussotti G, Tanzer A, Djebali S, Tilgner H, Guernec G, Martin D, Merkel A, Knowles DG, et al. (2012). The GENCODE v7 catalog of human long noncoding RNAs: analysis of their gene structure, evolution, and expression. Genome Res. 22, 1775–1789. 10.1101/gr.132159.111. - DOI - PMC - PubMed
MeSH terms
Substances
Grants and funding
LinkOut - more resources
Full Text Sources
Molecular Biology Databases
Miscellaneous

