

Performance Drift in Machine Learning Models for Cardiac Surgery Risk Prediction: Retrospective Analysis
- PMID: 38889069
- PMCID: PMC11217160
- DOI: 10.2196/45973
Performance Drift in Machine Learning Models for Cardiac Surgery Risk Prediction: Retrospective Analysis
Abstract
Background: The Society of Thoracic Surgeons and European System for Cardiac Operative Risk Evaluation (EuroSCORE) II risk scores are the most commonly used risk prediction models for in-hospital mortality after adult cardiac surgery. However, they are prone to miscalibration over time and poor generalization across data sets; thus, their use remains controversial. Despite increased interest, a gap in understanding the effect of data set drift on the performance of machine learning (ML) over time remains a barrier to its wider use in clinical practice. Data set drift occurs when an ML system underperforms because of a mismatch between the data it was developed from and the data on which it is deployed.
Objective: In this study, we analyzed the extent of performance drift using models built on a large UK cardiac surgery database. The objectives were to (1) rank and assess the extent of performance drift in cardiac surgery risk ML models over time and (2) investigate any potential influence of data set drift and variable importance drift on performance drift.
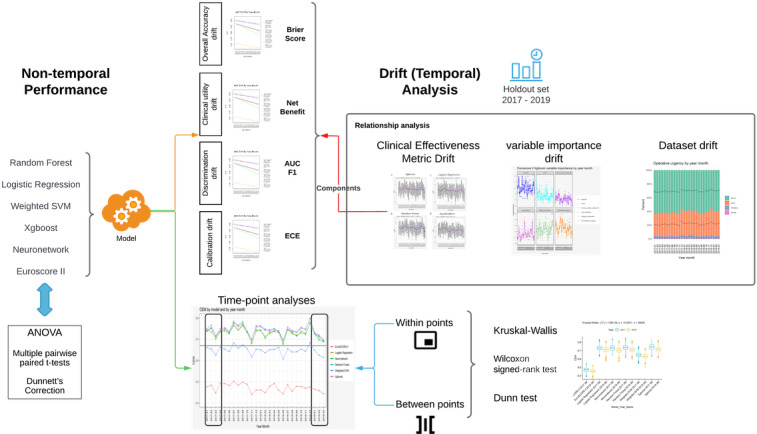
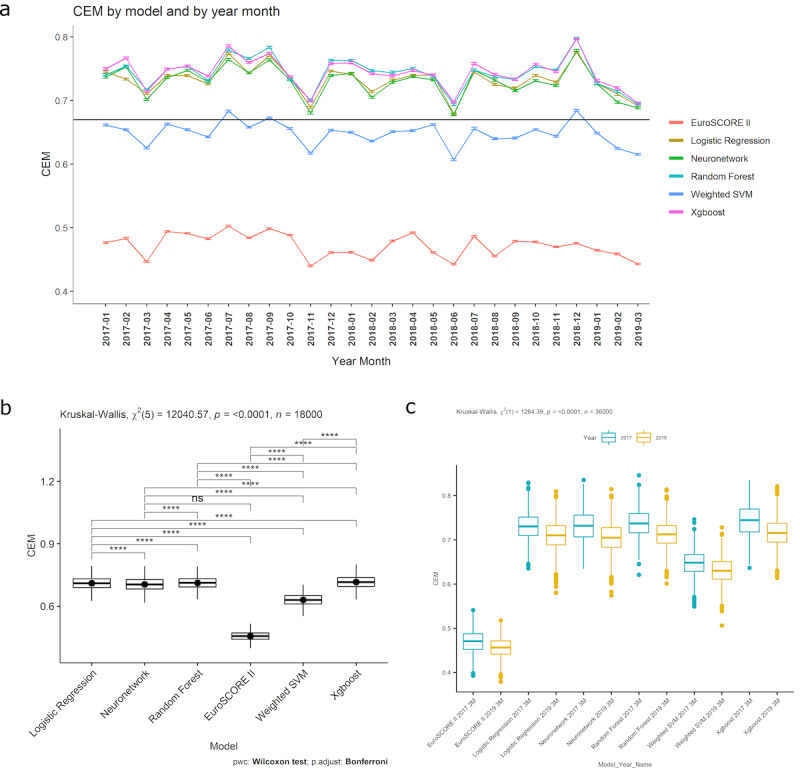
Methods: We conducted a retrospective analysis of prospectively, routinely gathered data on adult patients undergoing cardiac surgery in the United Kingdom between 2012 and 2019. We temporally split the data 70:30 into a training and validation set and a holdout set. Five novel ML mortality prediction models were developed and assessed, along with EuroSCORE II, for relationships between and within variable importance drift, performance drift, and actual data set drift. Performance was assessed using a consensus metric.
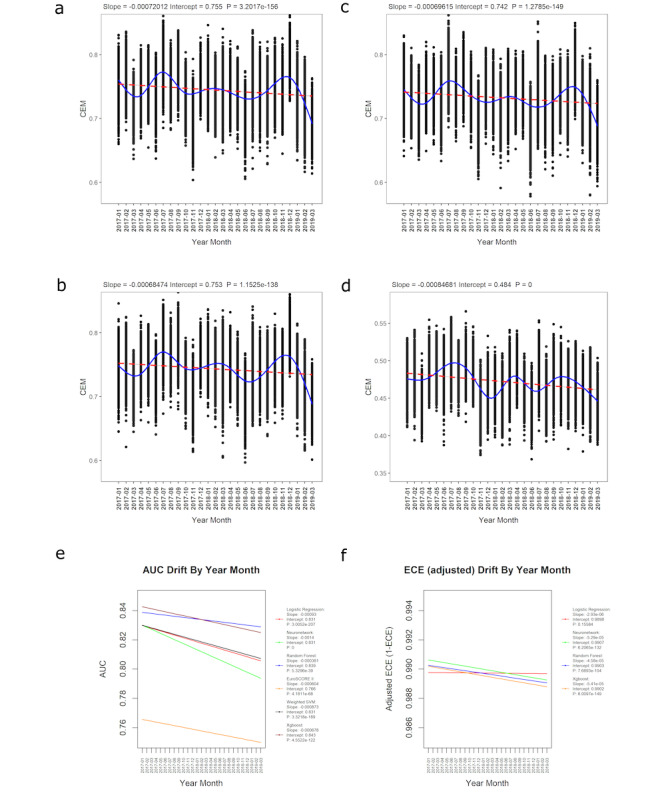
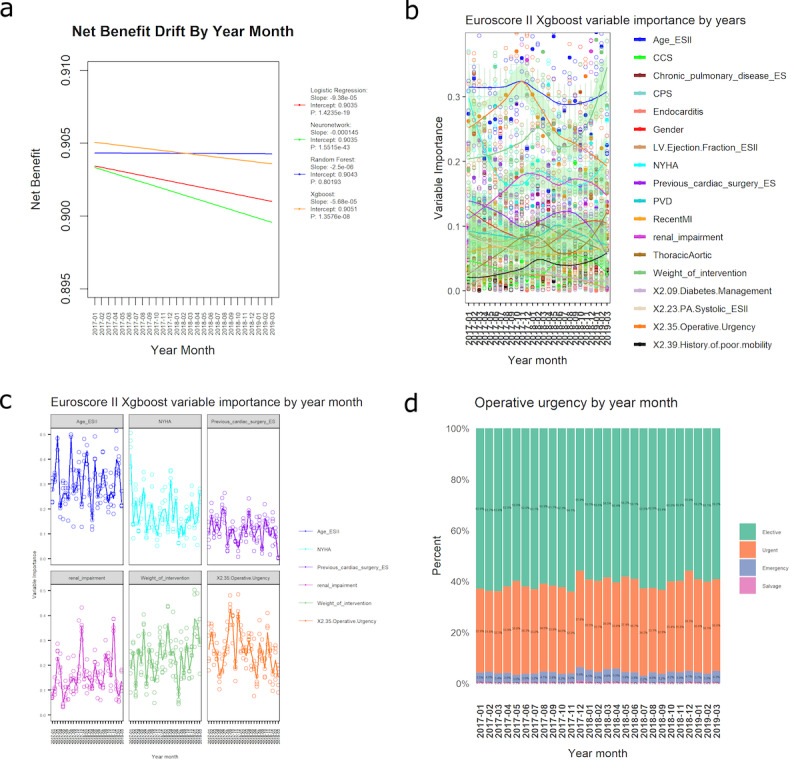
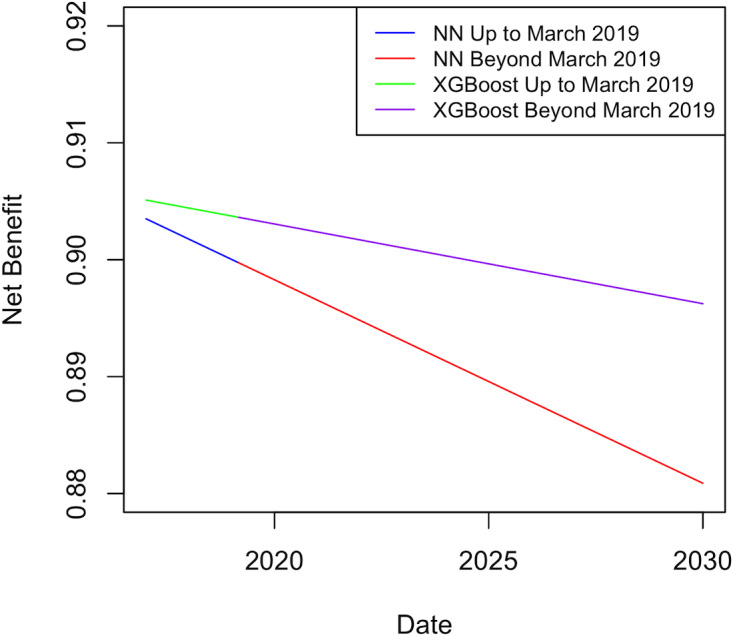
Results: A total of 227,087 adults underwent cardiac surgery during the study period, with a mortality rate of 2.76% (n=6258). There was strong evidence of a decrease in overall performance across all models (P<.0001). Extreme gradient boosting (clinical effectiveness metric [CEM] 0.728, 95% CI 0.728-0.729) and random forest (CEM 0.727, 95% CI 0.727-0.728) were the overall best-performing models, both temporally and nontemporally. EuroSCORE II performed the worst across all comparisons. Sharp changes in variable importance and data set drift from October to December 2017, from June to July 2018, and from December 2018 to February 2019 mirrored the effects of performance decrease across models.
Conclusions: All models show a decrease in at least 3 of the 5 individual metrics. CEM and variable importance drift detection demonstrate the limitation of logistic regression methods used for cardiac surgery risk prediction and the effects of data set drift. Future work will be required to determine the interplay between ML models and whether ensemble models could improve on their respective performance advantages.
Keywords: United Kingdom; adult; artificial intelligence; cardiac; cardiac surgery; cardiology; data; data set drift; heart; machine learning; model; mortality; national data set; operative mortality; performance; performance drift; prediction; risk; risk prediction; surgery.
© Tim Dong, Shubhra Sinha, Ben Zhai, Daniel Fudulu, Jeremy Chan, Pradeep Narayan, Andy Judge, Massimo Caputo, Arnaldo Dimagli, Umberto Benedetto, Gianni D Angelini. Originally published in JMIRx Med (https://med.jmirx.org).
Conflict of interest statement
Figures
Update of
- doi: 10.2196/preprints.45973
- doi: 10.1101/2023.01.21.23284795
Similar articles
-
Comparison of machine learning techniques in prediction of mortality following cardiac surgery: analysis of over 220 000 patients from a large national database.Eur J Cardiothorac Surg. 2023 Jun 1;63(6):ezad183. doi: 10.1093/ejcts/ezad183. Eur J Cardiothorac Surg. 2023. PMID: 37154705 Free PMC article.
-
Cardiac surgery risk prediction using ensemble machine learning to incorporate legacy risk scores: A benchmarking study.Digit Health. 2023 Jul 20;9:20552076231187605. doi: 10.1177/20552076231187605. eCollection 2023 Jan-Dec. Digit Health. 2023. PMID: 37492033 Free PMC article.
-
Development of machine learning models for mortality risk prediction after cardiac surgery.Cardiovasc Diagn Ther. 2022 Feb;12(1):12-23. doi: 10.21037/cdt-21-648. Cardiovasc Diagn Ther. 2022. PMID: 35282663 Free PMC article.
-
Machine learning in predicting cardiac surgery-associated acute kidney injury: A systemic review and meta-analysis.Front Cardiovasc Med. 2022 Sep 15;9:951881. doi: 10.3389/fcvm.2022.951881. eCollection 2022. Front Cardiovasc Med. 2022. PMID: 36186995 Free PMC article.
-
Sutureless Aortic Valve Replacement for Treatment of Severe Aortic Stenosis: A Single Technology Assessment of Perceval Sutureless Aortic Valve [Internet].Oslo, Norway: Knowledge Centre for the Health Services at The Norwegian Institute of Public Health (NIPH); 2017 Aug 25. Report from the Norwegian Institute of Public Health No. 2017-01. Oslo, Norway: Knowledge Centre for the Health Services at The Norwegian Institute of Public Health (NIPH); 2017 Aug 25. Report from the Norwegian Institute of Public Health No. 2017-01. PMID: 29553663 Free Books & Documents. Review.
Cited by
-
Artificial Intelligence in Surgery: A Systematic Review of Use and Validation.J Clin Med. 2024 Nov 24;13(23):7108. doi: 10.3390/jcm13237108. J Clin Med. 2024. PMID: 39685566 Free PMC article. Review.
-
A machine learning algorithm-based risk prediction score for in-hospital/30-day mortality after adult cardiac surgery.Eur J Cardiothorac Surg. 2024 Oct 1;66(4):ezae368. doi: 10.1093/ejcts/ezae368. Eur J Cardiothorac Surg. 2024. PMID: 39374541 Free PMC article.
-
Use of pulse pressure index for cardiovascular outcomes assessment and development of a coronary heart disease model for the elderly.BMC Cardiovasc Disord. 2025 Apr 18;25(1):297. doi: 10.1186/s12872-025-04641-8. BMC Cardiovasc Disord. 2025. PMID: 40251528 Free PMC article.
-
Machine learning-based hybrid risk estimation system (ERES) in cardiac surgery: Supplementary insights from the ASA score analysis.PLOS Digit Health. 2025 Jun 23;4(6):e0000889. doi: 10.1371/journal.pdig.0000889. eCollection 2025 Jun. PLOS Digit Health. 2025. PMID: 40549810 Free PMC article.
-
Enhancing Cardiovascular Risk Prediction: Development of an Advanced Xgboost Model with Hospital-Level Random Effects.Bioengineering (Basel). 2024 Oct 18;11(10):1039. doi: 10.3390/bioengineering11101039. Bioengineering (Basel). 2024. PMID: 39451414 Free PMC article.
References
Grants and funding
LinkOut - more resources
Full Text Sources
Miscellaneous
