. 2024 Oct 7;223(10):e202310067.
doi: 10.1083/jcb.202310067. Epub 2024 Jun 18.

T cells use focal adhesions to pull themselves through confined environments

Affiliations

T cells use focal adhesions to pull themselves through confined environments

Alexia Caillier et al. J Cell Biol. .

Abstract

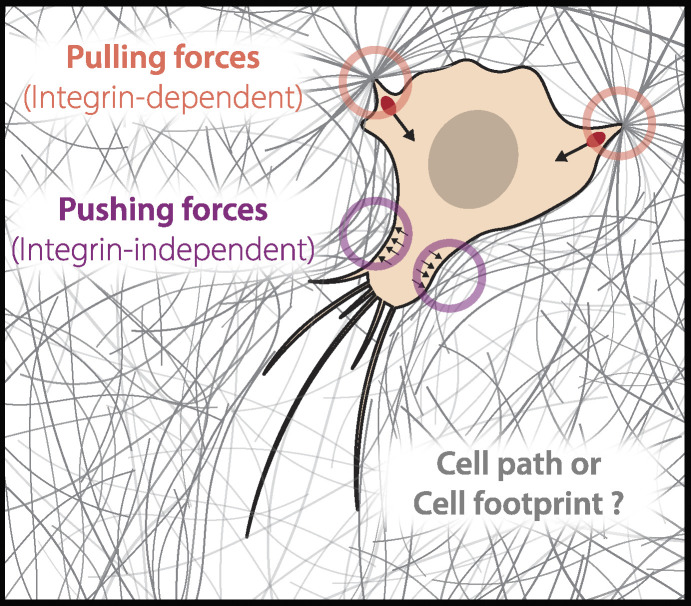
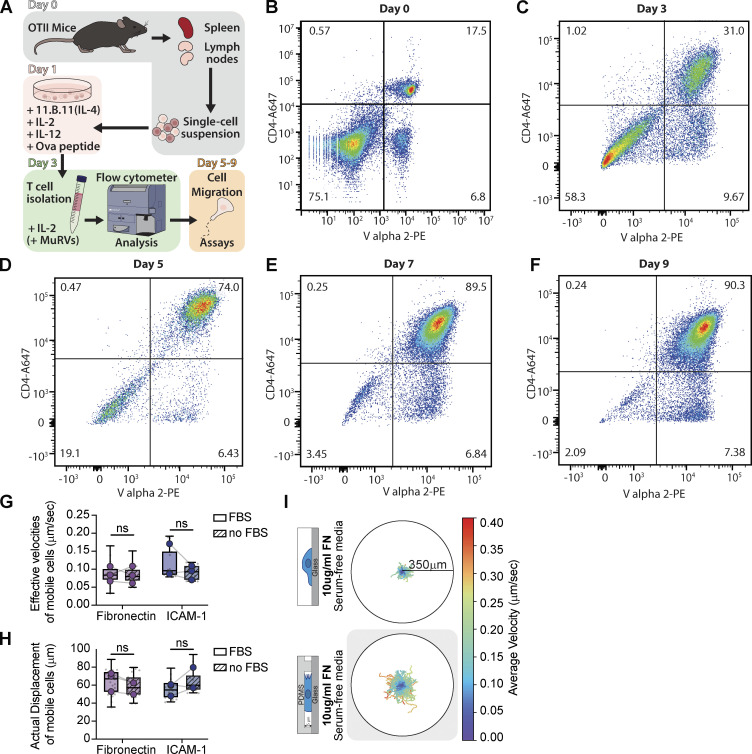
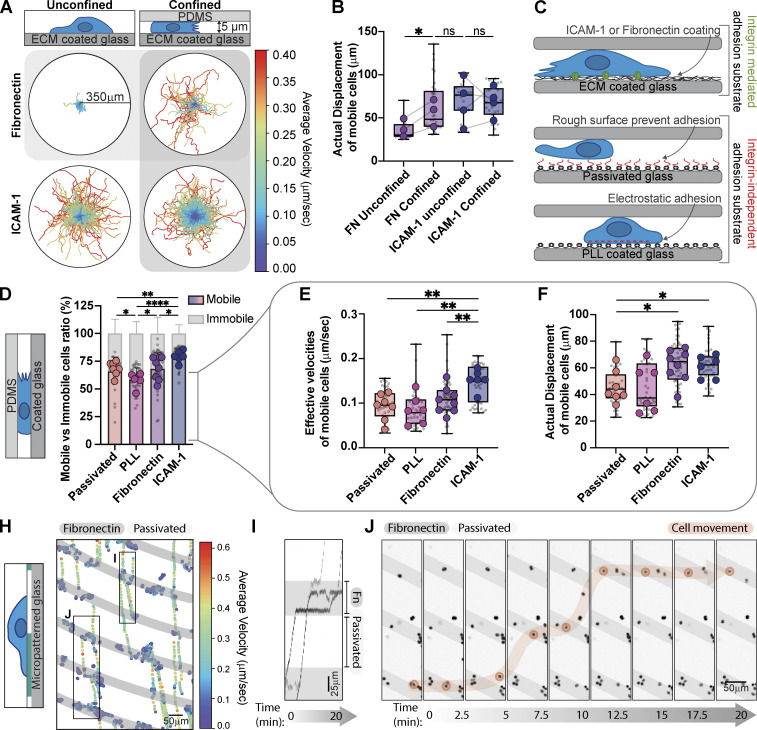
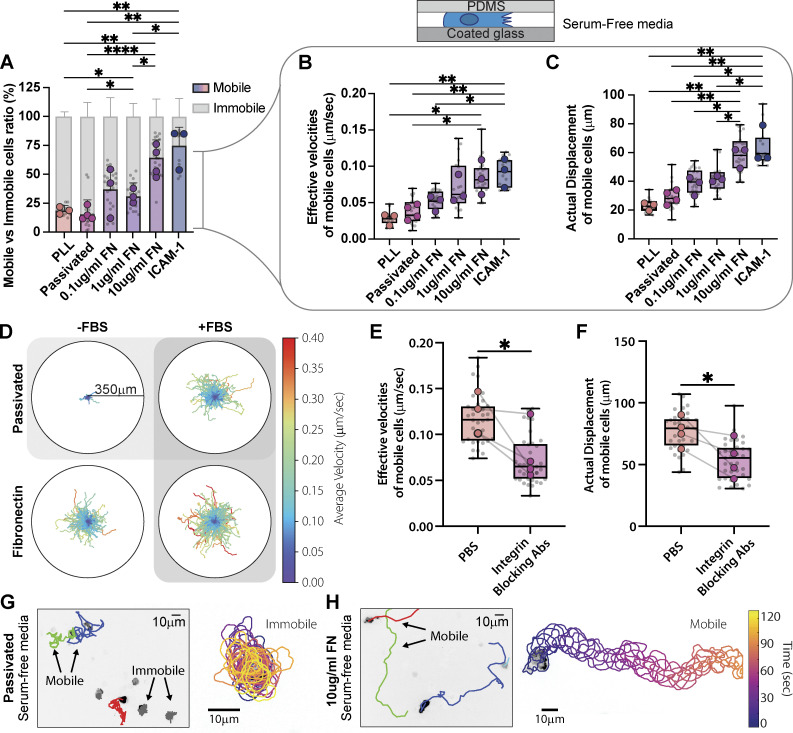
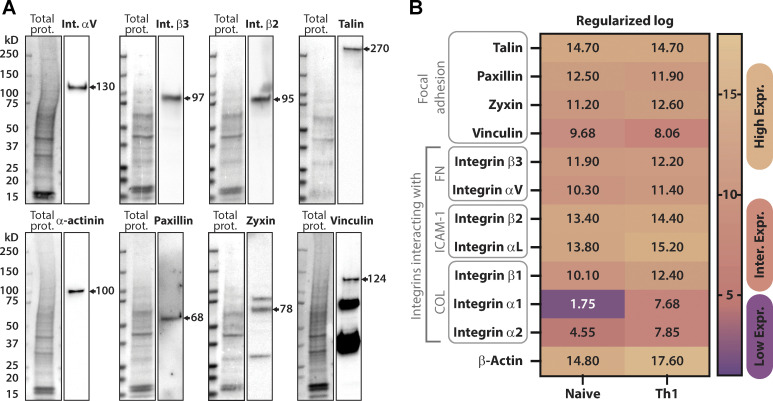
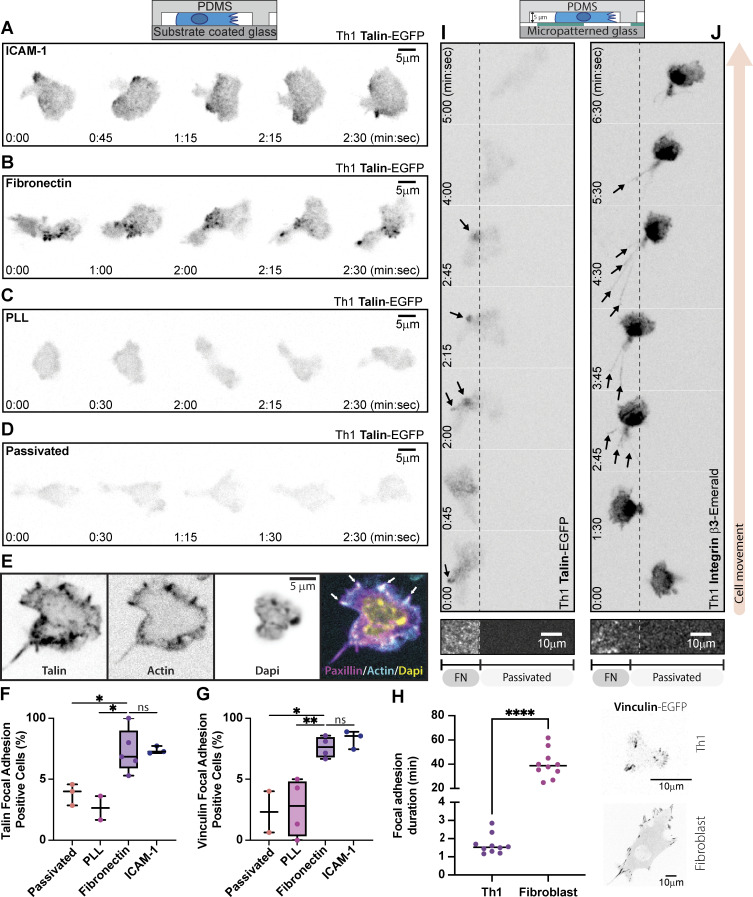
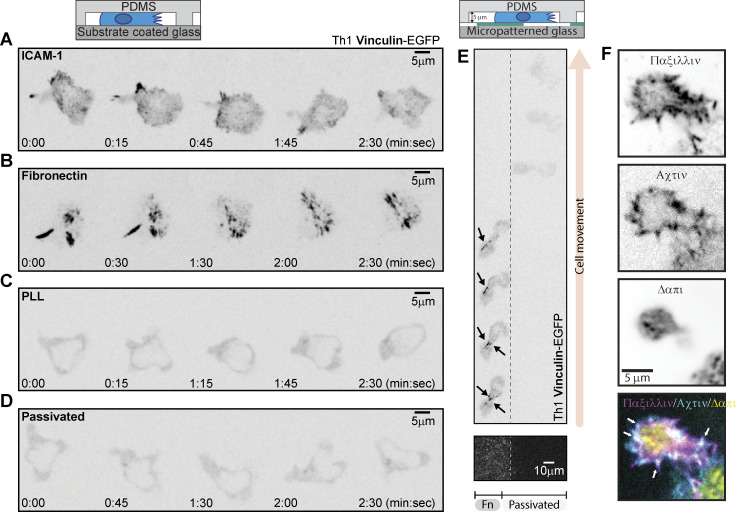
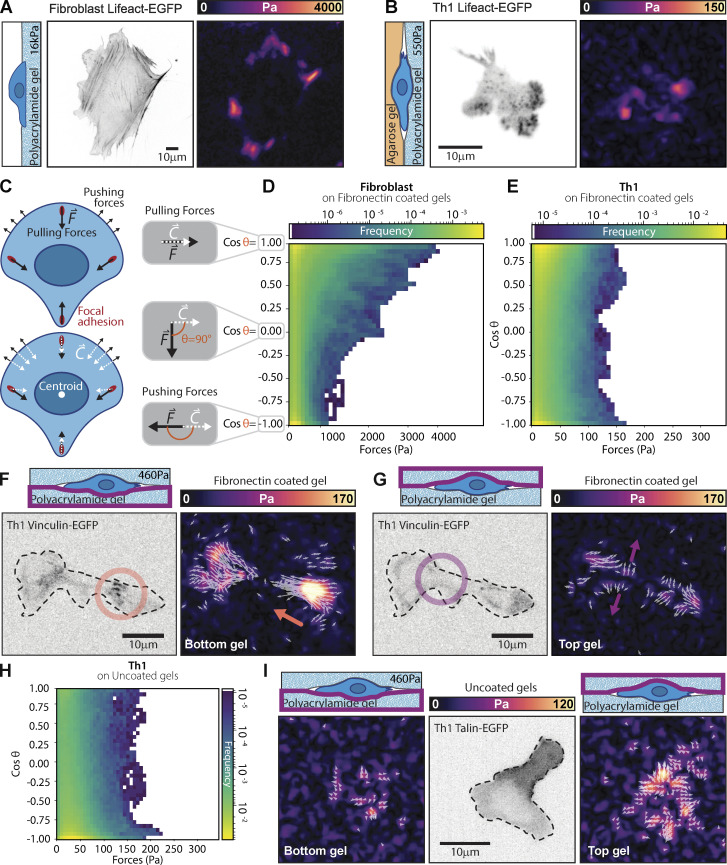
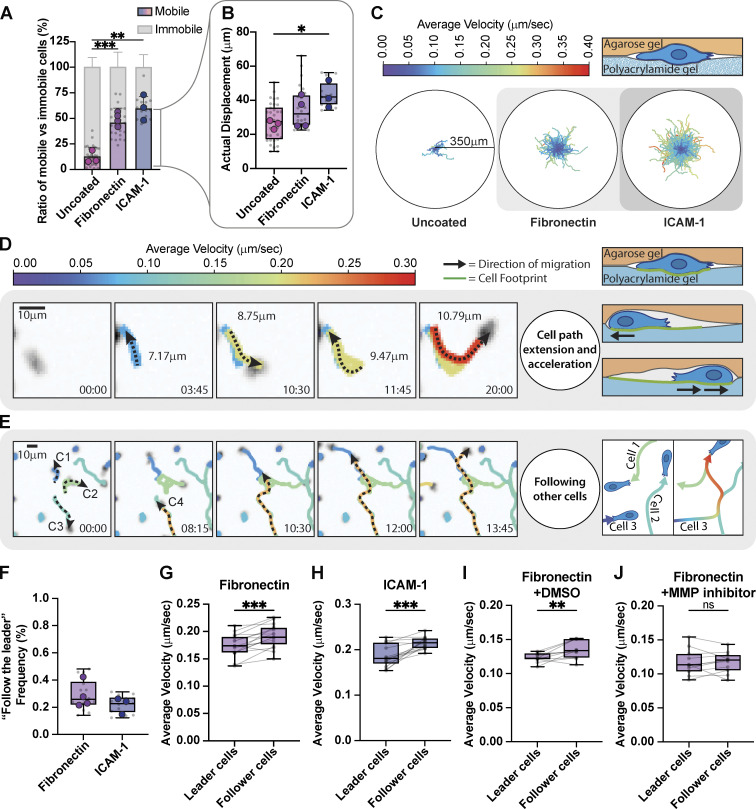
Immune cells are highly dynamic and able to migrate through environments with diverse biochemical and mechanical compositions. Their migration has classically been defined as amoeboid under the assumption that it is integrin independent. Here, we show that activated primary Th1 T cells require both confinement and extracellular matrix proteins to migrate efficiently. This migration is mediated through small and dynamic focal adhesions that are composed of the same proteins associated with canonical mesenchymal cell focal adhesions, such as integrins, talin, and vinculin. These focal adhesions, furthermore, localize to sites of contractile traction stresses, enabling T cells to pull themselves through confined spaces. Finally, we show that Th1 T cells preferentially follow tracks of other T cells, suggesting that these adhesions modify the extracellular matrix to provide additional environmental guidance cues. These results demonstrate not only that the boundaries between amoeboid and mesenchymal migration modes are ambiguous, but that integrin-mediated focal adhesions play a key role in T cell motility.


Conflict of interest statement

Disclosures: All authors have completed and submitted the ICMJE Form for Disclosure of Potential Conflicts of Interest. P.W. Oakes reported grants from NIAID—P01-AI102851 during the conduct of the study. No other disclosures were reported.

Figures

None
Graphical abstract
Figure S1.
Figure S1.
Th1 cell activation protocol and serum-free migration dynamics. (A) Graphical representation of Th1 activation. (B) Flow cytometer analysis of a representative single-cell suspension on the day of extraction from OTII mice using CD4 and Vα2 antibodies as markers. (C) A representative flow cytometer analysis of T cells three days post activation with anti-IL-4 (11B11; 40 µg/ml), IL-2 (20 U/ml), IL-12 (40 ng/ml), OVA peptide (4 µg/ml). T cells were isolated using lymphocyte separation media. (D–F) Representative flow cytometer analyses of Th1 T cells after 5 (D), 7 (E), and 9 (F) days post activation, with continuous treatment of 10 units/ml IL-2 and lymphocyte separation media before each use. (G and H) The actual displacement (G) and effective velocities (H) of mobile cells on fibronectin and ICAM-1 substrate with and without FBS in cell media. (I) Th1 cell tracking in serum-free media on Fibronectin in unconfined versus confined (5 µm) environments. The colormap represents the cell average velocity in µm/sec. Number of replicates for G and H: All conditions n = 3. Samples with and without FBS were performed with the same preparation of cells, on the same day, from the same mice. Each replicate represents the average of 5–10 fields of view (gray dots = average of each field of view), which contain ∼250 cells. Statistical test: one-tail paired parametric t test.
Figure 1.
Figure 1.
Th1 migration, velocity, and displacement are regulated by the environment composition and geometry. (A) Th1 cell tracking on ICAM-1 and FN in unconfined versus confined (5 µm) environments. The colormap represents the cell's average velocity in µm/sec. (B) Comparison of the actual displacement, defined as the distance between the starting and end points of a track, of the mobile cells in A. (C) Graphical representation of the different substrates used and their properties. (D) The mobile versus immobile fraction of cells in confinement on ICAM-1, FN, PLL, and Passivated surfaces. Mobile cells are defined by a minimum displacement of 10 µm. (E and F) The effective velocities (E) and actual displacement (F) of mobile cells in D. (H) Cell tracking on a FN micropatterned substrate. Gray = FN, White = Passivated. The colors represent the instantaneous velocities of each cell at a given time point. (I) Kymographs of the regions identified in H show cells stalling on the FN patterned stripes. (J) Snapshots of the movie from H. A single cell is highlighted in orange to illustrate its trajectory over time. Number of biological replicates (colored dots): (B) FN, n = 3; ICAM-1, n = 4. (D-F) FN, n = 8; ICAM-1, n = 6; PLL, n = 6; Passivated, n = 7. Each replicate represents the average of 5–10 fields of view (gray dots = average of each field of view), which each contain ∼250 cells. Statistical tests: (B) one-tail paired parametric t test; (D–F) two-tailed unpaired parametric t test.
Figure 2.
Figure 2.
ECM is essential for Th1 migration. (A) The percentage of mobile versus immobile Th1 cells in confinement on ICAM-1, FN, PLL, and passivated surface in serum-free media. Mobile cells are defined by a minimum displacement of 10 µm. (B and C) Analysis of the (B) effective velocities and the (C) actual displacement of mobile cells in A. (D) Cell tracks on passivated substrates versus on FN in either serum-free media (−FBS) or with serum (+FBS). The colors represent the cell’s average velocity. (E and F) Effective velocities (E) and actual displacement (F) of cells pretreated for 3 h with a mixture of integrin-blocking antibodies compared to control (PBS). (G and H) Tracking of cells and representative trajectories of cells on (G) passivated versus (H) FN-coated substrates in serum-free media. The cell outlines are color-coded for time. Number of biological replicates (colored dots): (A–C) PLL n = 3; Passivated n = 4; 0.1 µg/ml FN n = 3; 1 µg/ml FN n = 3; 10 µg/ml FN n = 4. (E–F) PBS n = 4; Ab-integrin n = 4. Each replicates represent the average of 5–10 fields of view (gray dots = average of each fields of view), which each contain ∼250 cells. Statistical tests: (A–C) Two-tailed unpaired parametric t test; (E and F) One-tail unpaired parametric t test.
Figure S2.
Figure S2.
Focal adhesion protein expression in Th1 cells. (A) Representative Western blots showing endogenous expression of various integrin and FA proteins in activated Th1 cells. (B) RNA-sequencing comparison of naive versus activated T cells (Th1) from the publicly available dataset (https://Th-express.org; Stubbington et al., 2015). Genes shown include FA-related proteins, fibronectin-binding integrins, ICAM-1-binding integrins as well as collagen-binding integrins. Their relative levels of expression were calculated from z-log (see Materials and methods) transformed gene expression counts for all genes and presented using a colormap to show high, intermediate to low levels of expression. Source data are available for this figure: SourceData FS2.
Figure 3.
Figure 3.
Th1 cells form FAs. (A–D) Representative migrating Th1 cells expressing Talin-EGFP in confinement on (A) ICAM-1, (B) FN, (C) PLL, and (D) PLL-PEG. (E) Representative image of a confined Th1 cell fixed and stained for endogenous talin. (F and G) Quantification of the number of FA-positive cells when expressing (F) Talin-EGFP or (G) vinculin-EGFP compared across surface treatments. (H) A comparison of FA lifetime between Th1 cells and fibroblasts expressing Vinculin eGFP (representative images on right). (I and J) Representative Th1 cells expressing (I) Talin-EGFP or (J) Integrin β3-Emerald in confinement on a micropatterned substrate. The left portion of the field of view is FN coated and the right portion is passivated. Number of biological replicates (colored dots): (F) Passivated, 36 cells from three experiments; PLL, 53 cells from two experiments; FN, 140 cells from five experiments; ICAM-1, 40 cells from three experiments. (G) Passivated, 21 cells from two experiments; PLL, 38 cells from four experiments; FN, 94 cells from four experiments; ICAM-1 169 cells from three experiments. (H) Th1 n = 10; Fibroblast n = 10. Each replicate represents the average turnover of ≥5 FAs per cell. Statistical tests: (F–H) Two-tail unpaired parametric t test was used to compare the replicates.
Figure S3.
Figure S3.
Th1 cells form FAs containing vinculin and paxillin. (A–D) Representative Th1 cells expressing Vinculin-eGFP in confinement on (A) ICAM-1, (B) Fibronectin, (C) PLL, and (D) PLL-PEG. (E) A Th1 expressing Vinculin-eGFP in confinement on a micropatterned substrate. The left portion of the field of view is fibronectin-coated and the right portion is passivated. Arrows indicate vinculin accumulation in FAs. (F) Representative fixed images of Th1 cells in confinement, stained with an anti-paxillin antibody to mark endogenous adhesions, phalloidin to visualize actin, and DAPI to mark the nucleus.
Figure 4.
Figure 4.
Th1 cells exert traction stresses at FAs. (A and B) Representative traction maps of a (A) fibroblast or (B) Th1 cell expressing Lifeact-EGFP. The fibroblast is plated on a gel with a shear modulus of 16 kPa, while the Th1 cell is plated under agarose on a gel with a shear modulus of 336 Pa. Both gels are coated with FN. (C) Cartoon illustrating the direction of potential forces (black arrows) and their orientation with respect to the cell centroid (white arrows). (D and E) 2D histograms comparing the magnitude of measured traction stresses and the difference in their direction (θ) from the cell centroid. Pulling (contractile) forces are represented as cosθ = 1, while pushing forces are represented as cosθ = −1. Histograms are shown for (D) fibroblasts and (E) Th1 cells on FN-coated gels. (F) Representative images of a Th1 cell expressing Vinculin-EGFP sandwiched between two acrylamide gels of 460 Pa coated with FN. On the bottom gel, contractile forces (orange arrow) colocalize with vinculin puncta (orange circle). (G) On the top gel, pushing forces (purple arrow) show no colocalization with vinculin (purple circle) and likely arise from the cell pushing the gel out of the way as it is pulled through the gel. (H) 2D histogram comparing the magnitude of measured traction stresses and the difference in their direction from the cell centroid for a cell confined between two passivated gels. (I) Representative images of the pushing forces on both the top and bottom gel for the case when the gels are passivated. Number of replicates: (D) Th1, 12 cells, 45 fields of view from four different experiments; (E) Fibroblast, 12 cells from 12 fields of view. (H) 11 cells, 44 fields of view, from two different experiments. The data for the histograms were pooled from all cells in each condition.
Figure 5.
Figure 5.
T cells follow the paths of each other. (A) Comparison of the mobile versus immobile fraction of Th1 cells in confinement between an agarose gel and a polyacrylamide gel coated with FN, ICAM-1, or uncoated. (B) Comparison of actual displacement of the cells from A. Mobile cells are defined by a minimum displacement of 10 µm. (C) Roseplots showing Th1 cell tracks of cells in A and B. The colormap represents the cell's average velocity. (D) Individual cell tracking shows cells extending their path and accelerating after each pass. (E) Individual cell tracking shows three cells extending their paths and a fourth cell (orange) reusing those previously made paths and accelerating while doing so. Colors represent the cell's average velocity. (F) Measurement of the frequency of cells following each other. (G–J) Measurement of the change in velocity of cells as they encounter previous paths of migrating T cells confined between an agarose gel and a polyacrylamide gel coated with (G) FN, (H) ICAM-1, (I) DMSO, or (J) 10 µM Pan MMP Inhibitor. Number of biological replicates (colored dots): (A and B) Uncoated, n = 3; FN, n = 4; ICAM-1, n = 3. (F–H) FN n = 4; ICAM-1 n = 3. (I–J) FN + DMSO n = 2; FN + MMP inhibitor, n = 2. Each replicates represent the average of 5–10 fields of view (gray dots = average of each fields of view). Statistical tests: (A and B) Two-tail unpaired parametric t test; (G–J) One-tail paired parametric t test.

Update of

References

    1. Abraham, M., Shapiro S., Karni A., Weiner H.L., and Miller A.. 2005. Gelatinases (MMP-2 and MMP-9) are preferentially expressed by Th1 vs. Th2 cells. J. Neuroimmunol. 163:157–164. 10.1016/j.jneuroim.2005.02.001 - DOI - PubMed
    1. Adebowale, K., Ha B., Saraswathibhatla A., Indana D., Popescu M.C., Demirdjian S., Yang J., Bassik M.C., Franck C., Bollyky P.L., and Chaudhuri O.. 2023. Monocytes use protrusive forces to generate migration paths in viscoelastic collagen-based extracellular matrices. bioRxiv. 10.1101/2023.06.09.544394 (Preprint posted June 11, 2023). - DOI
    1. Allan, D.B., Caswell T., Keim N.C., van der Wel C.M., and Verweij R.W.. 2023. Soft-matter/trackpy: v0.6.1. Zenodo. 10.5281/zenodo.7670439 - DOI
    1. Aoun, L., Farutin A., Garcia-Seyda N., Nègre P., Rizvi M.S., Tlili S., Song S., Luo X., Biarnes-Pelicot M., Galland R., et al. . 2020. Amoeboid swimming is propelled by molecular paddling in lymphocytes. Biophys. J. 119:1157–1177. 10.1016/j.bpj.2020.07.033 - DOI - PMC - PubMed
    1. Bangasser, B.L., Shamsan G.A., Chan C.E., Opoku K.N., Tüzel E., Schlichtmann B.W., Kasim J.A., Fuller B.J., McCullough B.R., Rosenfeld S.S., and Odde D.J.. 2017. Shifting the optimal stiffness for cell migration. Nat. Commun. 8:15313. 10.1038/ncomms15313 - DOI - PMC - PubMed

LinkOut - more resources