. 2025 Jan 7;148(1):133-142.
doi: 10.1093/brain/awae198.

Childhood adiposity underlies numerous adult brain traits commonly attributed to midlife obesity

Affiliations

Childhood adiposity underlies numerous adult brain traits commonly attributed to midlife obesity

Scott T Chiesa et al. Brain. .

Abstract

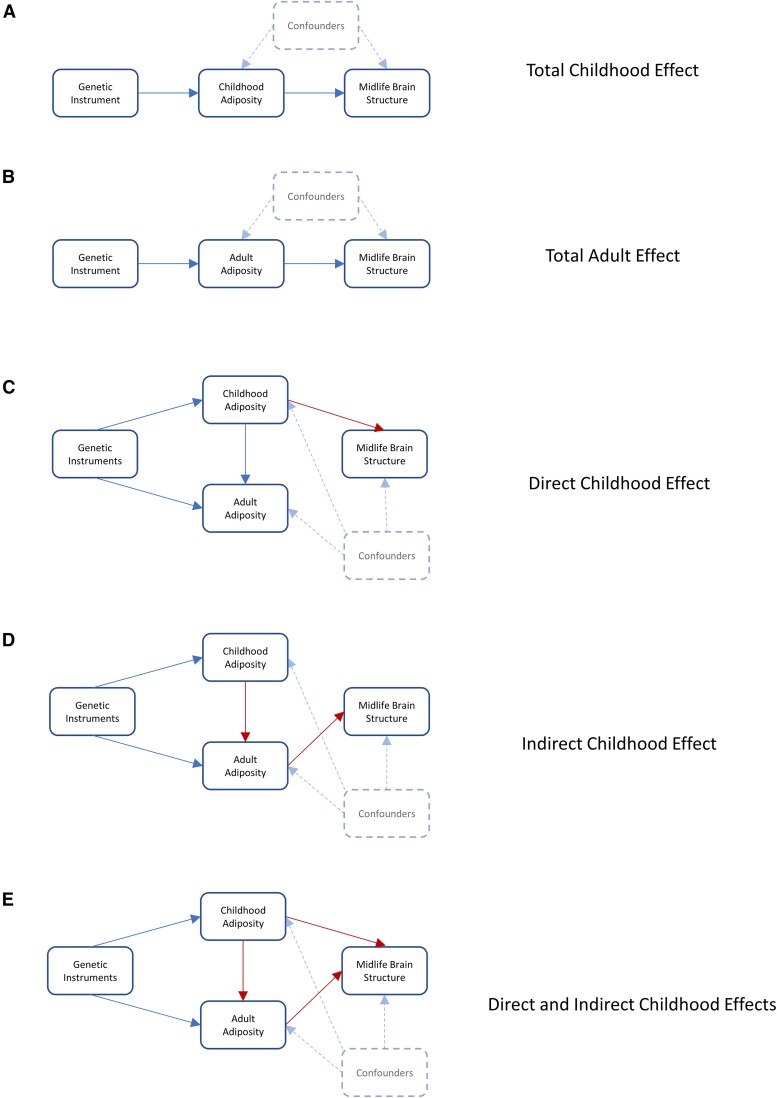
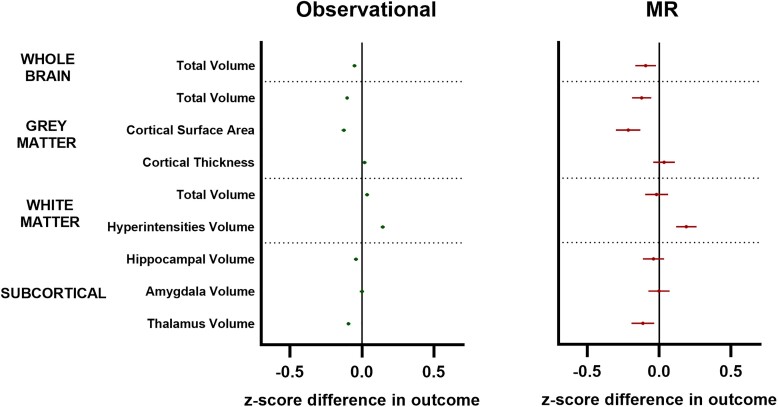
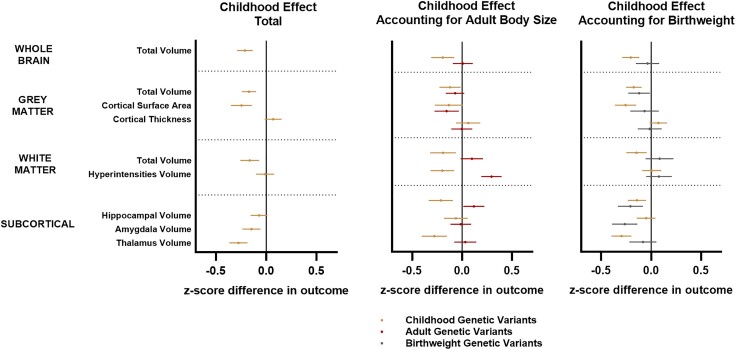
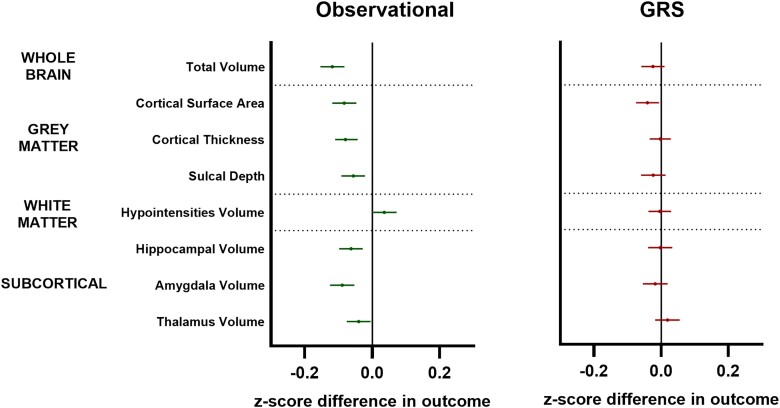
Obese adults are often reported to have smaller brain volumes than their non-obese peers. Whether this represents evidence of accelerations in obesity-driven atrophy or is instead a legacy of developmental differences established earlier in the lifespan remains unclear. This study investigated whether early-life differences in adiposity explain differences in numerous adult brain traits commonly attributed to mid-life obesity. We used a two-sample life course Mendelian randomization study in 37 501 adults recruited to UK Biobank (UKB) imaging centres from 2014, with secondary analyses in 6996 children assessed in the Adolescent Brain Cognitive Development Study (ABCD) recruited from 2018. Exposures were genetic variants for childhood (266 variants) and adult (470 variants) adiposity derived from a genome-wide association study (GWAS) of 407 741 UKB participants. Primary outcomes were: adult total brain volume; grey matter volume, thickness and surface area; white matter volume and hyperintensities; and hippocampus, amygdala and thalamus volumes at mean age 55 in the UKB. Secondary outcomes were equivalent childhood measures collected at mean age 10 in ABCD. In the UKB, individuals who were genetically predicted to have had higher levels of adiposity in childhood were found to have multiple smaller adult brain volumes relative to intracranial volume [e.g. z-score difference in normalized brain volume per category increase in adiposity-95% confidence interval (CI) = -0.20 (-0.28, -0.12); P = 4 × 10⁻⁶]. These effect sizes remained essentially unchanged after accounting for birthweight or current adult obesity in multivariable models, whereas most observed adult effects attenuated towards null [e.g. adult z-score (95% CI) for total volume = 0.06 (-0.05, 0.17); P = 0.3]. Observational analyses in ABCD showed a similar pattern of changes already present in those with a high body mass index by age 10 [z-score (95% CI) = -0.10 (-0.13, -0.07); P = 8 × 10-13], with follow-up genetic risk score analyses providing some evidence for a causal effect already at this early age. Sensitivity analyses revealed that many of these effects were likely due to the persistence of larger head sizes established in those who gained excess weight in childhood [childhood z-score (95% CI) for intracranial volume = 0.14 (0.05, 0.23); P = 0.002], rather than smaller brain sizes per se. Our data suggest that the persistence of early-life developmental differences across the life course may underlie numerous neuroimaging traits commonly attributed to obesity-related atrophy in later life.

Keywords: adiposity; brain traits; life course Mendelian randomization; neuroimaging; obesity.


Conflict of interest statement

T.G.R. is an employee of GlaxoSmithKline outside of this research. All other co-authors report no competing interests.

Figures

Figure 1
Figure 1
Directed acyclic graphs illustrating potential paths by which childhood adiposity may impact adult brain traits. Five directed acyclic graphs demonstrating potential ways in which childhood and adult adiposity may impact adult brain traits. A and B show the potential for univariable Mendelian randomization (MR) to assess the total effects of childhood and adult adiposity on adult brain traits. C–E show the ways in which multivariable MR may isolate the underlying causal effects responsible. In C, childhood adiposity exerts a direct effect on later brain traits while also separately influencing later-life adiposity. In D, childhood adiposity exerts an indirect effect on later brain traits mediated solely via its effect on later-life adiposity. In E, childhood adiposity exerts both direct effects on later brain traits and indirect effects mediated through the persistence of adiposity over time. The use of genetic variants as proxies for exposures minimizes confounding bias and allows causal effects to be estimated.
Figure 2
Figure 2
Observational and univariable Mendelian randomization analyses of adult adiposity versus adult brain traits. Forest plots showing cross-sectional observational (left) and Mendelian randomization (MR; right) analyses linking adult adiposity to adult brain traits in the UK Biobank. Symbols represent mean z-score difference in each outcome (95% confidence intervals) across categories of adiposity. Green symbols = observational data; red symbols = MR data. White matter hyperintensity volumes were log-transformed prior to analysis. All outcomes indexed to intracranial volume except for cortical thickness and white matter hyperintensities.
Figure 3
Figure 3
Total and direct effects of childhood adiposity on adult brain traits after accounting for potential downstream (adult obesity) and upstream (birthweight) influential factors. Forest plots showing univariable Mendelian randomization analyses assessing childhood total effects (left) and multivariable analyses assessing direct effects after accounting for adult adiposity (middle) and birthweight (right) on adult brain traits in the UK Biobank. Symbols represent mean z-score difference in each outcome (95% confidence intervals) across categories of adiposity. Gold symbols = childhood genetic variants; red symbols = adult genetic variants; grey symbols = birthweight genetic variants. White matter hyperintensity volumes were log-transformed prior to analysis. All outcomes indexed to intracranial volume except for cortical thickness and white matter hyperintensities.
Figure 4
Figure 4
Observational and genetic risk score analyses of childhood adiposity on childhood brain traits at age 10 years. Forest plots showing cross-sectional observational (left) and genetic risk score (GRS; right) analyses linking childhood adiposity to childhood brain traits in the Adolescent Brain Cognitive Development Study. Symbols represent mean z-score difference in each outcome (95% confidence intervals) across categories of adiposity. Green symbols = observational data; red symbols = GRS data. White matter hypointensity volumes were log-transformed prior to analysis. All outcomes indexed to intracranial volume except for cortical thickness and white matter hypointensities.

References

    1. World Health Organisation (WHO) . Obesity and overweight. Accessed 8 January 2024. https://www.who.int/news-room/fact-sheets/detail/obesity-and-overweight
    1. Ward ZJ, Long MW, Resch SC, Giles CM, Cradock AL, Gortmaker SL. Simulation of growth trajectories of childhood obesity into adulthood. N Engl J Med. 2017;377:2145–2153. - PMC - PubMed
    1. Albanese E, Launer LJ, Egger M, et al. . Body mass index in midlife and dementia: Systematic review and meta-regression analysis of 589,649 men and women followed in longitudinal studies. Alzheimers Dement Amst Neth. 2017;8:165–178. - PMC - PubMed
    1. Dekkers IA, Jansen PR, Lamb HJ. Obesity, brain volume, and white matter microstructure at MRI: A cross-sectional UK biobank study. Radiology. 2019;291:763–771. - PubMed
    1. Bethlehem RAI, Seidlitz J, White SR, et al. . Brain charts for the human lifespan. Nature. 2022;604:525–533. - PMC - PubMed