. 2024 Aug 6;36(8):1764-1778.e9.
doi: 10.1016/j.cmet.2024.05.011. Epub 2024 Jun 17.

Short-term cold exposure induces persistent epigenomic memory in brown fat

Affiliations

Short-term cold exposure induces persistent epigenomic memory in brown fat

Shin-Ichi Inoue et al. Cell Metab. .

Abstract

Deficiency of the epigenome modulator histone deacetylase 3 (HDAC3) in brown adipose tissue (BAT) impairs the ability of mice to survive in near-freezing temperatures. Here, we report that short-term exposure to mild cold temperature (STEMCT: 15°C for 24 h) averted lethal hypothermia of mice lacking HDAC3 in BAT (HDAC3 BAT KO) exposed to 4°C. STEMCT restored the induction of the thermogenic coactivator PGC-1α along with UCP1 at 22°C, which is greatly impaired in HDAC3-deficient BAT, and deletion of either UCP1 or PGC-1α prevented the protective effect of STEMCT. Remarkably, this protection lasted for up to 7 days. Transcriptional activator C/EBPβ was induced by short-term cold exposure in mouse and human BAT and, uniquely, remained high for 7 days following STEMCT. Adeno-associated virus-mediated knockdown of BAT C/EBPβ in HDAC3 BAT KO mice erased the persistent memory of STEMCT, revealing the existence of a C/EBPβ-dependent and HDAC3-independent cold-adaptive epigenomic memory.

Keywords: C/EBPβ; ERRα; HDAC3; PGC-1α; UCP1; brown adipose tissue; cold memory; mitochondria; oxidative phosphorylation; thermogenesis.


Conflict of interest statement

Declaration of interests M.A.L. is an advisory board member for Pfizer Inc. and is an advisory board member and co-founder of Flare Therapeutics. S.K. serves on Scientific Advisory Boards for Merck, Alnylum, AbbVie, and Boehringer Ingelheim.

Figures

Figure 1.
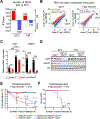
Figure 1.. STEMCT rescues the cold-intolerant phenotype of BAT HDAC3 BKO mice
(A) Schematic illustration of the experiments in (B-D and F-I). STEMCT, short-term exposure to mild cold temperature. CTT, cold tolerance test. (B-D) CTT (B and C) and mild cold exposure to 15°C (D): core body temperature (B and D) and survival (C) of control and Ucp1-cre HDAC3 KO mice. Control versus KO (n = 12, 11, in B and C; n = 12, 11, in D) The number of mice at that time point is shown in parentheses. (E) Representative image of H&E staining in BAT from control and Ucp1-cre HDAC3 KO mice housed at 22°C (n = 5, 6) or 15°C for 24 h (n = 5, 6). Scale bar, 10 μm. (F-I) CTT: core body temperature (F and H) and survival (G and I) of control and Ucp1-cre HDAC3 KO mice. Control versus KO (n = 11, 10, in F and G; n = 13, 9, in H and I). *P < 0.05, **P < 0.01, as analyzed by log-rank test (C, G and I) or Welch’s t-test (B, D, F and H). Data are represented as mean ± SEM.
Figure 2.
Figure 2.. STEMCT induces UCP1 which is required for rescue
(A) Number of differentially expressed genes (fold-change > 1.5 & FDR < 0.01) from Ucp1-cre HDAC3 KO mice versus control mice under the conditions at 22°C or 1-day recovery (1dR). Upregulated genes are indicated above the y-axis and downregulated genes are below the y-axis. (B) Scatter plot of RNA-seq data comparing Ucp1-cre HDAC3 KO mice versus control mice under the conditions at 22°C or 1-day recovery. X and Y axis in log2 (reads per kilobase per million (RPKM)). (C) Relative mRNA levels of Hdac3 and Ucp1 in BAT from control and Ucp1-cre HDAC3 KO mice housed at 22°C (n = 11, 11) or 15°C for 24 h (n = 6, 6). (D) Immunoblot for UCP1 and HDAC3 in BAT from control and Ucp1-cre HDAC3 KO mice housed at 22°C or 15°C for 24 h. VIN, vinculin, as a loading control. (E and F) CTT: core body temperature (E) and survival (F) of Hdac3f/f, Ucp1+/+ (n = 8), Hdac3f/f, Ucp1−/− (n = 6), Adipoq-cre; Hdac3f/f, Ucp1+/+(n = 4) and Adipoq-cre; Hdac3f/f, Ucp1−/− (n = 11) mice under the 1-day recovery condition. The number of mice at that time point is shown in parentheses. n = 4 replicates in RNA-seq (A and B). *** P < 0.001, as analyzed by two-way analysis of variance (ANOVA) with Tukey’s test (C). *P < 0.05, ***P < 0.001 (Adipoq-cre; Hdac3f/f, Ucp1+/+ versus Adipoq-cre; Hdac3f/f, Ucp1−/−), ##P < 0.01, ###P < 0.001 (Hdac3f/f, Ucp1+/+ versus Hdac3f/f, Ucp1−/−), as analyzed by Welch’s t-test (E) or log-rank test (F). Data are represented as mean ± SEM.
Figure 3.
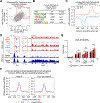
Figure 3.. ERRα sites are activated by STEMCT
(A) Scatter plot comparing eRNA regulation upon cold-exposure between control and KO in log2 FC (15°C vs 22°C). (B) HOMER de novo motif search at eRNA induced in HDAC3 KO mice following STEMCT. TF, transcriptional factor. (C) Average GRO-seq eRNA profile at ERRα binding sites in 15°C and 22°C in KO. (D) Representative Integrative Genomics Viewer (IGV) tracks of the Ucp1 locus highlighting GRO-seq (22°C and 15°C for 24 h) and HDAC3 and ERRα ChIP-seq (22°C) data (y axis scales in brackets: reads per million; eRNA tracks feature adjusted y axis scale). (E) ChIP qPCR of ERRα at the enhancer regions of Ucp1 in BAT from control and Ucp1-cre HDAC3 KO mice (22°C and 15°C for 24 h). Ins, insulin, is used as a non-specific binding site. n = 5 per group. *P < 0.05, **P < 0.01, as analyzed by two-way ANOVA with Tukey’s test and #P < 0.05, as analyzed by Welch’s t-test. Data are represented as mean ± SEM. (F) Average ATAC-seq profiles of downregulated BAT HDAC3 BKO enhancers in GRO-seq, bound by ERRα, with rescued eRNAs following STEMCT (1-day recovery versus 22°C in control (left) and Ucp1-cre HDAC3 KO mice (right)).
Figure 4.
Figure 4.. STEMCT induces ERRα coactivator PGC-1α which is require for rescue
(A) TRRUST enrichment analysis using Metascape of the upregulated transcriptional factors in Ucp1-cre HDAC3 KO mice following STEMCT. (B) HOMER de novo motif search at PGC-1α binding sites in BAT from PGC-1α-HisHA mice following a 4 h exposure to 4°C. TF, transcriptional factor. Data of PGC-1α ChIP-seq are used dataset, GSE213601. (C) Venn diagram showing overlap of peaks between ERRα and PGC-1α. (D) Representative IGV tracks of the Ucp1 locus highlighting PGC-1α and ERRα ChIP-seq data (y axis scales in brackets: reads per million). (E) Representative IGV tracks of the Ppargc1a (Pgc-1α) locus highlighting GRO-seq (22°C and 15°C for 24 h) data (y axis scales in brackets: reads per million). (F) Relative mRNA levels of Pgc-1a in BAT from control and Ucp1-cre HDAC3 KO mice housed at 22°C (n = 11, 11) or 15°C for 24 h (n = 6, 6). (G and H) CTT: core body temperature (G) and survival (H) of control and Ucp1-cre HDAC3/PGC-1α dKO mice under the condition at 22°C (n = 11, 11) and 1-day recovery (n = 13, 13) condition. The number of mice at that time point is shown in parentheses. **P < 0.01, ***P < 0.001, as analyzed by two-way ANOVA with Tukey’s test (F). **P < 0.01 (22°C: Hdac3f/f, Pgc-1αf/f versus Ucp1-cre; Hdac3f/f, Pgc-1αf/f), #P < 0.05, ###P < 0.001 (1-day recovery: Hdac3f/f, Pgc-1αf/f versus Ucp1-cre; Hdac3f/f, Pgc-1αf/f) by Welch’s t-test (G). NS, not significant. Data are represented as mean ± SEM.
Figure 5.
Figure 5.. Memory of STEMCT protects for 7 days
(A) Schematic illustration of the experiments in (B-G). (B-G) CTT: core body temperature (B, D and F) and survival (C, E and G) of control and Ucp1-cre HDAC3 KO mice under the conditions at 7- (n = 12, 11), 14- (n = 11, 11) and 30-day (n = 9, 11) recovery. The number of mice at that time point is shown in parentheses. (H) Principal component analysis (PCA) plot from bulk RNA-seq experiments in control and Ucp1-cre HDAC3 KO mice under the conditions at 22°C, 1 and 7-day recovery. (I) Immunoblot for UCP1 in BAT from control and Ucp1-cre HDAC3 KO mice under the conditions at 22°C, 15°C for 24 h and 1– 7- and 30-day recovery. VIN as a loading control. Right panel is shown quantification for UCP1 from control and Ucp1-cre HDAC3 KO BAT (n = 2 per each condition). (J) ATAC-Seq profiles of downregulated HDAC3 KO enhancers in GRO-seq, bound by ERRα, with rescued eRNAs following STEMCT (7-day recovery versus 22°C in control (left) and Ucp1-cre HDAC3 KO mice (right)). (K) Relative mRNA levels of Ucp1 in BAT from control and Ucp1-cre HDAC3 KO mice under the conditions at 22°C (n = 11, 11) and 30-day recovery (n = 8, 8). *P < 0.05, **P < 0.01, as analyzed by Welch’s t-test (B, D and F), log-rank test (C, E and G), or two-way ANOVA with Tukey’s test (K). Data are represented as mean ± SEM.
Figure 6.
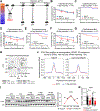
Figure 6.. C/EBPβ, but not PGC-1α, remains induced 7 after STEMCT and activates UCP1 enhancer activity
(A) Relative mRNA levels of Cebpb and Cebpa in BAT from control and Ucp1-cre HDAC3 KO mice housed at 30°C for 7 days (n = 8, 8), 22°C (n = 11, 11) or 15°C for 24 h (n = 6, 6). (B) Schematic representation of biopsy in human supraclavicular BAT, created using BioRender. (C) Relative mRNA levels of UCP1, CEBPB and CEBPA in human BAT at thermoneutrality (TN, 26–28°C) and cold exposure (CE, 20C). n = 16 per group. (D) Representative IGV tracks of the Ucp1 locus highlighting GRO-seq (22°C and 15°C for 24 h) and C/EBPβ ChIP-seq data (y axis scales in brackets: reads per million; eRNA tracks feature adjusted y axis scale). (E) eRNAs at C/EBPβ-bound enhancers in BAT HDAC3 KO (15°C versus 22°C). (F) ChIP qPCR of C/EBPβ at the enhancer/promotor regions of Ucp1, Ppargc1a and Cebpb in control and Ucp1-cre HDAC3 KO mice housed at 22°C or 15°C for 24 h. n = 5 per group. (G and H) Immunoblot for C/EBPβ in nuclear extracts of BAT from control and Ucp1-cre HDAC3 KO mice under the conditions at 22°C, 15°C for 24 h and 1-, 7- and 30-day recovery. H3 as a loading control. LAP, liver-enriched activating protein. LIP, liver-enriched inhibitory protein. The band intensity of C/EBPβ protein in Figure S6J was quantified using ImageJ software (H). (n = 3 per group). (I) ATAC-Seq profiles bound by cold-induced C/EBPβ following STEMCT (1- or 7-day recovery versus 22°C in control and Ucp1-cre HDAC3 KO mice). Cold-induced C/EBPβ binding is used ChIP-seq peaks induced at 4°C compared to 22°C. *P < 0.05, **P < 0.01, ***P < 0.001, as analyzed by two-way ANOVA with Tukey’s test or Welch’s t-test. *P < 0.05 (versus control at 22°C), #P < 0.05 (versus Ucp1-cre HDAC3 KO mice at 22°C) by Welch’s t-test (H). Data are represented as mean ± SEM.
Figure 7.
Figure 7.. C/EBPβ is indispensable for the memory of STEMCT
(A) Relative mRNA levels of Cebpb in BAT from control and Ucp1-cre HDAC3 KO mice housed at 15°C for 24 h (n = 5, 6) after direct delivery of AAV-shControl or AAV-shCebpb for 2 weeks. (B) Immunoblot for C/EBPβ in BAT from control and Ucp1-cre HDAC3 KO mice housed at 15°C for 24 h after direct delivery of AAV-shControl or AAV-shCebpb for 2 weeks. VIN, vinculin, as a loading control. LAP, liver-enriched activating protein. (C) Schematic illustration of the experiments in (D and E). (D and E) CTT: core body temperature (D) and survival (E) of control and Ucp1-cre HDAC3 KO (KO) mice with shControl or shCebpb under the condition at 22°C (shControl; n = 10, 10, shCebpb; n = 11, 8) and 7-day recovery (n = 10, 10) condition. The number of mice at that time point is shown in parentheses. *P < 0.05, ***P < 0.001, as analyzed by Welch’s t-test (A and D). D, Control, shControl at 22°C versus KO, shControl at 22°C. #P < 0.05 (Control, shCebpb at 22°C versus KO, shCebpb at 22°C or KO, shCebpb upon 7-day recovery) by Welch’s t-test. NS, not significant. E, NS by log-rank test (KO, shCebpb at 22°C versus KO, shCebpb upon 7-day recovery). Data are represented as mean ± SEM.

References

    1. Cannon B, and Nedergaard J (2004). Brown adipose tissue: function and physiological significance. Physiol Rev 84, 277–359. 10.1152/physrev.00015.2003. - DOI - PubMed
    1. Fedorenko A, Lishko PV, and Kirichok Y (2012). Mechanism of fatty-acid-dependent UCP1 uncoupling in brown fat mitochondria. Cell 151, 400–413. 10.1016/j.cell.2012.09.010. - DOI - PMC - PubMed
    1. Townsend KL, and Tseng YH (2014). Brown fat fuel utilization and thermogenesis. Trends Endocrinol Metab 25, 168–177. 10.1016/j.tem.2013.12.004. - DOI - PMC - PubMed
    1. Cypess AM, Weiner LS, Roberts-Toler C, Franquet Elía E, Kessler SH, Kahn PA, English J, Chatman K, Trauger SA, Doria A, and Kolodny GM (2015). Activation of human brown adipose tissue by a β3-adrenergic receptor agonist. Cell Metab 21, 33–38. 10.1016/j.cmet.2014.12.009. - DOI - PMC - PubMed
    1. Cypess AM, Lehman S, Williams G, Tal I, Rodman D, Goldfine AB, Kuo FC, Palmer EL, Tseng YH, Doria A, et al. (2009). Identification and importance of brown adipose tissue in adult humans. N Engl J Med 360, 1509–1517. 10.1056/NEJMoa0810780. - DOI - PMC - PubMed

MeSH terms

Substances