. 2024 Aug;26(4):616-627.
doi: 10.1007/s11307-024-01921-1. Epub 2024 Jun 18.

Rapid Assessment of Bio-distribution and Antitumor Activity of the Photosensitizer Bremachlorin in a Murine PDAC Model: Detection of PDT-induced Tumor Necrosis by IRDye® 800CW Carboxylate, Using Whole-Body Fluorescent Imaging

Affiliations

Rapid Assessment of Bio-distribution and Antitumor Activity of the Photosensitizer Bremachlorin in a Murine PDAC Model: Detection of PDT-induced Tumor Necrosis by IRDye® 800CW Carboxylate, Using Whole-Body Fluorescent Imaging

Roisin McMorrow et al. Mol Imaging Biol. 2024 Aug.

Abstract

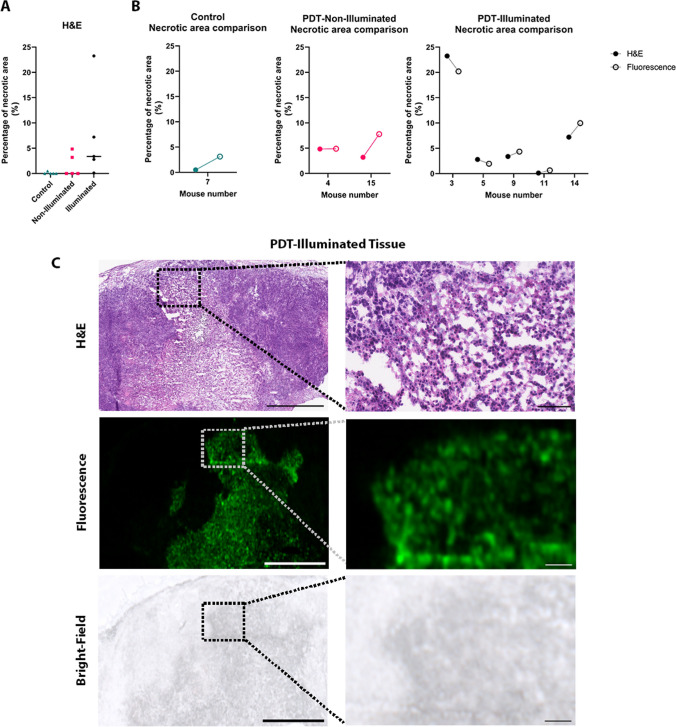
Photodynamic therapy (PDT) is a light-based anticancer therapy that can induce tumor necrosis and/or apoptosis. Two important factors contributing to the efficacy of PDT are the concentration of the photosensitizer in the tumor tissue and its preferential accumulation in the tumor tissue compared to that in normal tissues. In this study, we investigated the use of optical imaging for monitoring whole-body bio-distribution of the fluorescent (660 nm) photosensitizer Bremachlorin in vivo, in a murine pancreatic ductal adenocarcinoma (PDAC) model. Moreover, we non-invasively, examined the induction of tumor necrosis after PDT treatment using near-infrared fluorescent imaging of the necrosis avid cyanine dye IRDye®-800CW Carboxylate. Using whole-body fluorescence imaging, we observed that Bremachlorin preferentially accumulated in pancreatic tumors. Furthermore, in a longitudinal study we showed that 3 hours after Bremachlorin administration, the fluorescent tumor signal reached its maximum. In addition, the tumor-to-background ratio at all-time points was approximately 1.4. Ex vivo, at 6 hours after Bremachlorin administration, the tumor-to-muscle or -normal pancreas ratio exhibited a greater difference than it did at 24 hours, suggesting that, in terms of efficacy, 6 hours after Bremachlorin administration was an effective time point for PDT treatment of PDAC. In vivo administration of the near infrared fluorescence agent IRDye®-800CW Carboxylate showed that PDT, 6 hours after administration of Bremachlorin, selectively induced necrosis in the tumor tissues, which was subsequently confirmed histologically. In conclusion, by using in vivo fluorescence imaging, we could non-invasively and longitudinally monitor, the whole-body distribution of Bremachlorin. Furthermore, we successfully used IRDye®-800CW Carboxylate, a near-infrared fluorescent necrosis avid agent, to image PDT-induced necrotic cell death as a measure of therapeutic efficacy. This study showed how fluorescence can be applied for optimizing, and assessing the efficacy of, PDT.

Keywords: Bremachlorin; Fluorescence; Necrosis; Optical imaging; PDAC; PDT; PS; Photodynamic therapy; Photosensitizer; Whole-body imaging.


Conflict of interest statement

The authors declare that they have no relevant conflicts of interest.

Figures

Fig. 1
Fig. 1
In Vivo Optical Imaging of the Photosensitizer Bremachlorin. A Representative fluorescence whole-body images of mice bearing PDAC lesions, right dorsal side, tumors taken longitudinally. B Bar graph representing the corrected fluorescent signal (average radiant efficiency) of Bremachlorin in the tumor over time, the control group did not receive Bremachlorin (n=8 for the control group and 3-,4.5-,6-, and 24-hour groups). C Bar graph representing the tumor-to-background ratio (TBR) of the fluorescent signal (average radiant efficiency) of the tumor divided by the fluorescent signal (average radiant efficiency) of the representative surrounding tissue (n=8 for the control group and 3-,4.5-, and 6-hour groups, except for the 24-hour group n=7 due to missing data). All p- values shown were determined by one-way ANOVA using Tukey’s multiple comparisons test, ** p<0.01, *** p<0.005, **** p<0.0001. The data are presented as the means ± SDs
Fig. 2
Fig. 2
Assessment of the Photosensitizer Bremachlorin Ex Vivo. A Representative fluorescence images of tumors, pancreases and muscles ex vivo at 6 and 24 hours after Bremachlorin injection and the control group (that did not receive Bremachlorin). B Bar graph representing the amount of Bremachlorin (μg) per gram (g) of tissue calculated from the fluorescent signal of the homogenized tissue (at each time point, n=4 for organs and n=8 for tumors). C Bar graph representing the tumor-to-organ (T/O) ratio of either the muscle or pancreas from the values plotted in (B). All p- values were determined by two-way ANOVA using Bonferroni multiple comparisons test; ** p<0.01, **** p<0.0001. The data are presented as the means ± SDs
Fig. 3
Fig. 3
Investigating the Microscopic Distribution of Bremachlorin in PDAC Tumors. A Representative fluorescence confocal images of 6-hour Bremachlorin (red) and control (that did not receive Bremachlorin) tumor tissues (n=1 for each condition). Tumor tissue was stained with the endothelial marker CD31 (green) and the nuclear marker Hoechst (blue). B Representative bright-field confocal image of the fluorescence images shown in (A) and scanned H&E-stained tumor tissue. C The graph represents the co-localization of Bremachlorin with CD31-stained vascular endothelial cells calculated by Spearman’s rank correlation value. The values are presented as the average of 2 tumor samples per group, with 2 or 3 images taken per sample. All images in this figure are at 20x magnification, and scale bars indicate 100 μm. The data are presented as the means ± SDs
Fig. 4
Fig. 4
In Vivo Optical Imaging of PDT-induced Cell Death with 800CW Carboxylate. A Fluorescent whole-body imaging of PDAC tumor-bearing mice. All the mice shown were administered 800CW Carboxylate 24 hours prior to imaging. B Bar graph representing the corrected fluorescent signal (average radiant efficiency) of 800CW Carboxylate in tumors from the PDT-illuminated (n=5), PDT-non-illuminated (n=5) and control (n=10) groups. All the groups received 800CW Carboxylate, but the controls did not receive Bremachlorin. C Bar graph representing the tumor-to-background ratio of the fluorescent signal (average radiant efficiency) of the tumor divided by the fluorescent signal (average radiant efficiency) of the representative surrounding tissue. All p- values were determined by one-way ANOVA with Tukey’s multiple comparisons test; ns represents non-significant differences; * p<0.05, *** p<0.005, **** p<0.0001. The data are presented as the means ± SDs
Fig. 5
Fig. 5
Assessment of Ex Vivo Cell Death with 800CW Carboxylate. A The graph represents the percentage of necrotic tissue (%) in H&E-annotated tumor slices determined by pathologist from the PDT-illuminated, PDT-non-illuminated and control groups (n=5 per group). B Graph representing the percentage of necrotic tissue (%) in H&E-annotated tumor slices (same as in figure A) compared to the percentage of necrotic tissue (%) in fluorescence images of the PDT-illuminated (n=5), PDT-non-illuminated (n=2) and control (n=1) groups. C Representative images of PDT-illuminated tumor tissue parallel slices of H&E-stained (top images), 800CW Carboxylate fluorescence (middle images), and bright-field of fluorescence images (bottom images). All images in this figure are shown with scale bars of 1mm (left) or 100 μm (right)

Similar articles

References

    1. Sarbadhikary P, George BP, Abrahamse H (2021) Recent advances in photosensitizers as multifunctional theranostic agents for imaging-guided photodynamic therapy of cancer. Theranostics 11(18):9054–9088 10.7150/thno.62479 - DOI - PMC - PubMed
    1. Mallidi S, Spring BQ, Hasan T (2015) Optical imaging, photodynamic therapy and optically triggered combination treatments. Cancer J 21(3):194–205 10.1097/PPO.0000000000000117 - DOI - PMC - PubMed
    1. Douillard S, Olivier D, Patrice T (2009) In vitro and in vivo evaluation of Radachlorin(R) sensitizer for photodynamic therapy. Photochem Photobiol Sci 8(3):405–413 10.1039/b817175k - DOI - PubMed
    1. Douillard S et al (2010) In vitro evaluation of radachlorin sensitizer for photodynamic therapy. J Photochem Photobiol B 98(2):128–137 10.1016/j.jphotobiol.2009.11.011 - DOI - PubMed
    1. Kleinovink JW et al (2016) Combination of photodynamic therapy and specific immunotherapy efficiently eradicates established tumors. Clin Cancer Res 22(6):1459–1468 10.1158/1078-0432.CCR-15-0515 - DOI - PubMed

MeSH terms

LinkOut - more resources