. 2024 Jun 18;15(1):5194.
doi: 10.1038/s41467-024-49041-2.

Repeat controlled human Plasmodium falciparum infections delay bloodstream patency and reduce symptoms

Affiliations

Repeat controlled human Plasmodium falciparum infections delay bloodstream patency and reduce symptoms

Patricia Ferrer et al. Nat Commun. .

Abstract

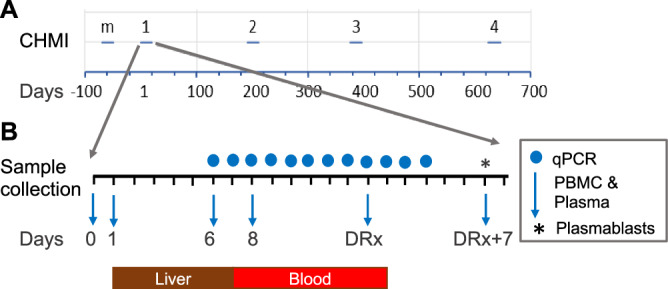
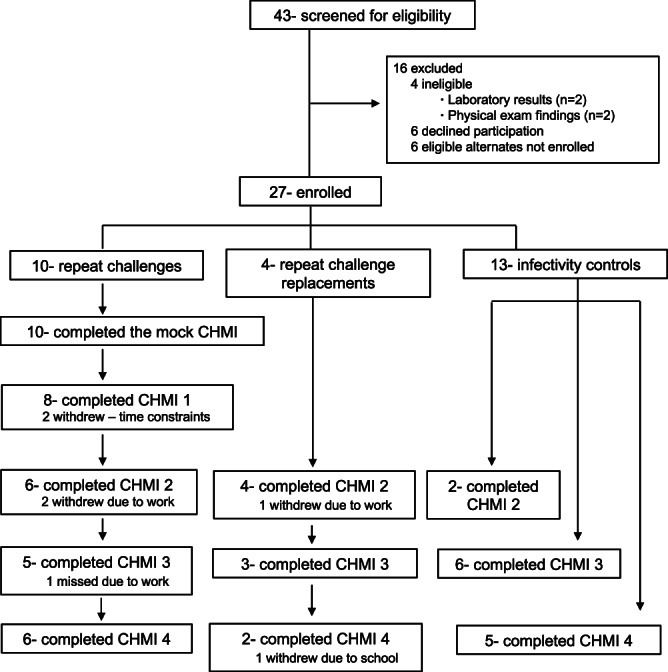
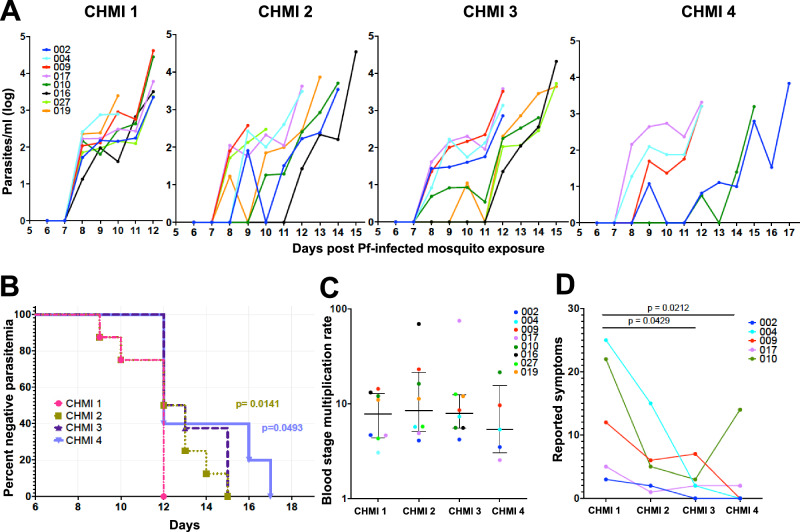
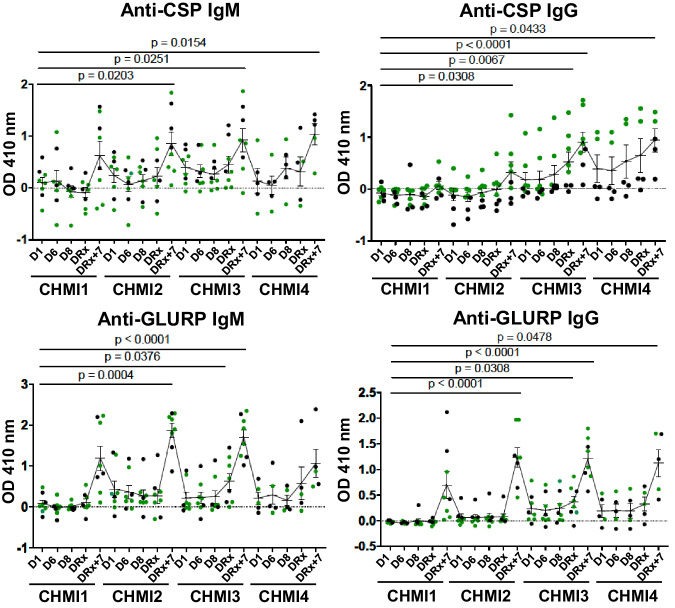
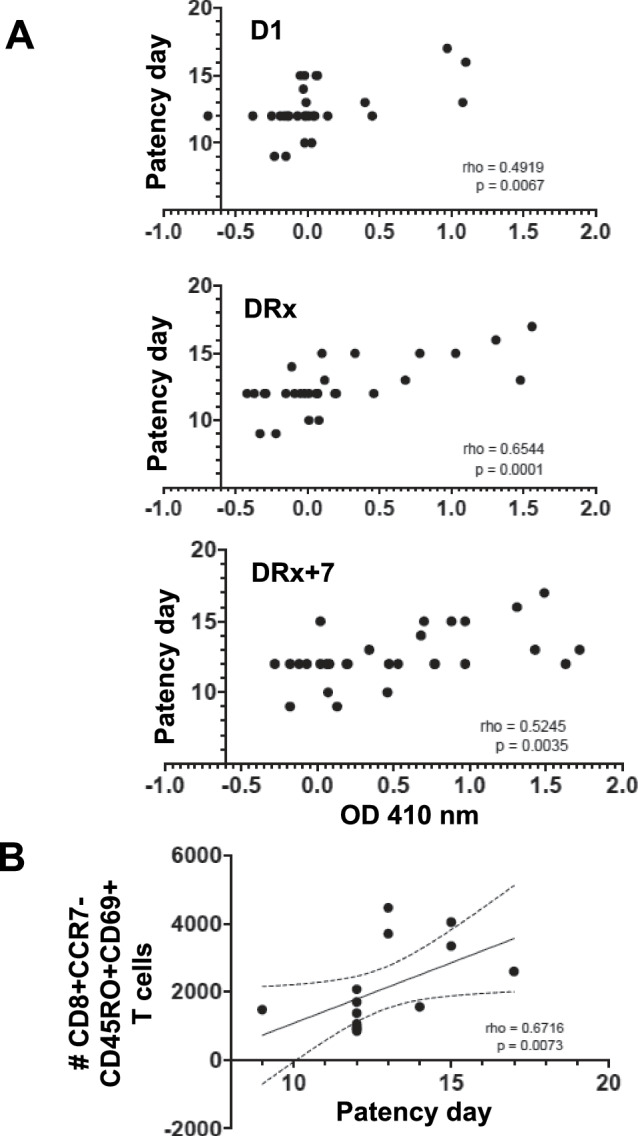
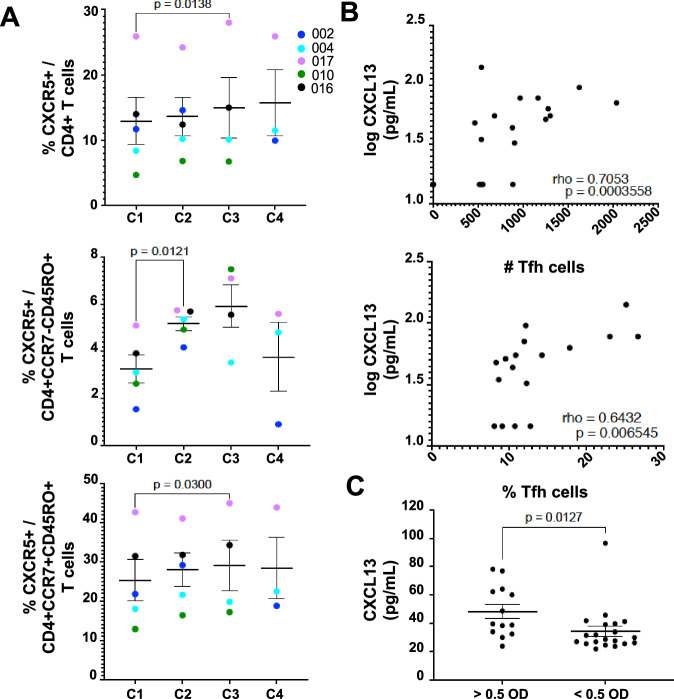
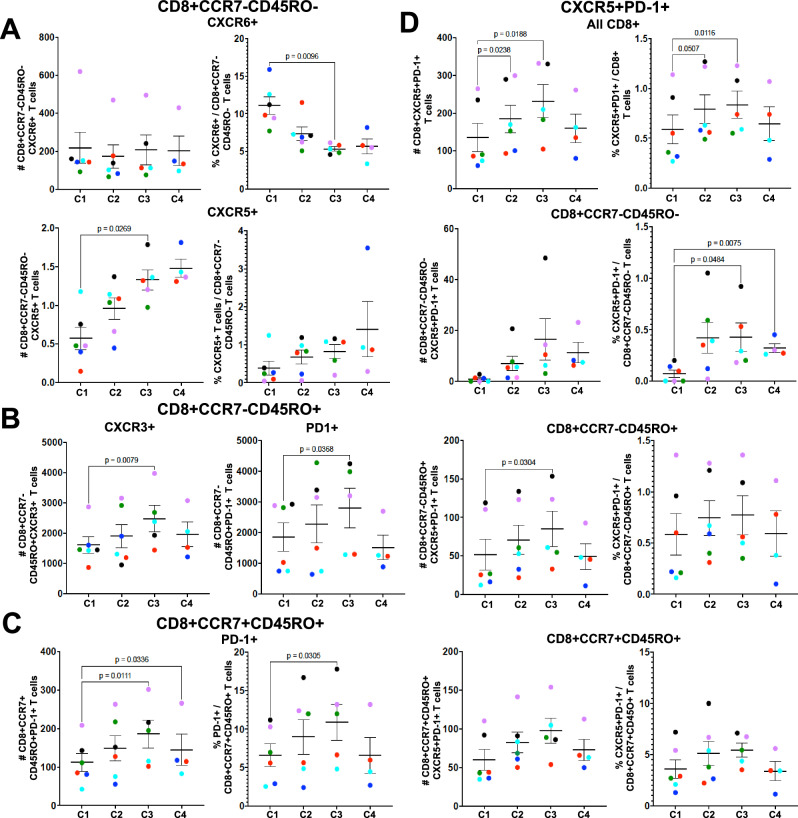
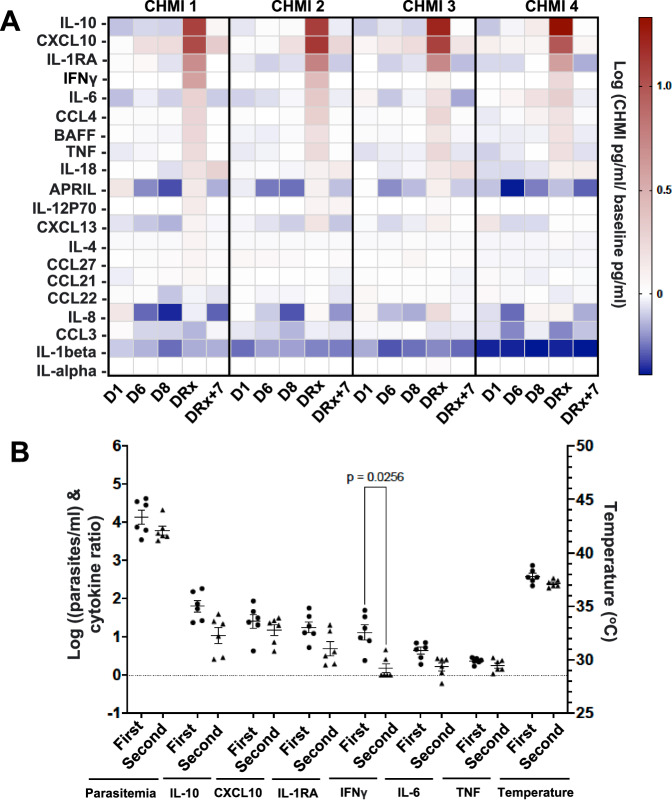
Resistance to clinical malaria takes years to develop even in hyperendemic regions and sterilizing immunity has rarely been observed. To evaluate the maturation of the host response against controlled repeat exposures to P. falciparum (Pf) NF54 strain-infected mosquitoes, we systematically monitored malaria-naïve participants through an initial exposure to uninfected mosquitoes and 4 subsequent homologous exposures to Pf-infected mosquitoes over 21 months (n = 8 males) (ClinicalTrials.gov# NCT03014258). The primary outcome was to determine whether protective immunity against parasite infection develops following repeat CHMI and the secondary outcomes were to track the clinical signs and symptoms of malaria and anti-Pf antibody development following repeat CHMI. After two exposures, time to blood stage patency increases significantly and the number of reported symptoms decreases indicating the development of clinical tolerance. The time to patency correlates positively with both anti-Pf circumsporozoite protein (CSP) IgG and CD8 + CD69+ effector memory T cell levels consistent with partial pre-erythrocytic immunity. IFNγ levels decrease significantly during the participants' second exposure to high blood stage parasitemia and could contribute to the decrease in symptoms. In contrast, CD4-CD8 + T cells expressing CXCR5 and the inhibitory receptor, PD-1, increase significantly after subsequent Pf exposures, possibly dampening the memory response and interfering with the generation of robust sterilizing immunity.


Conflict of interest statement

The authors declare no completing interests. Material has been reviewed by the University of Maryland Institutional Review Board. There is no objection to its presentation and/or publication. The opinions or assertions expressed are the private views of the authors, and are not to be construed as official, or as reflecting true views of the Uniformed Services University of the Health Sciences, Henry M. Jackson Foundation for the Advancement of Military Medicine, Inc. or the Department of Defense. The investigators have adhered to the policies for protection of human subjects as prescribed in AR 70–25. This work was supported by NIAID of the National Institutes of Health (NIH) under award numbers R01AI110852 and U01AI110852; Clinical Trials.gov registration number, NCT03014258.

Figures

Fig. 1
Fig. 1. Repeat CHMI time course.
A Over the course of two years, healthy participants were first challenged with 5 uninfected mosquitoes (mock = m (n = 6)) followed by 3 (n = 8) or 4 (n = 5) challenges with 5 Pf-NF54-infected mosquitoes (CHMI) (salivary gland count >2 (100–1000 sporozoites)). B Blood sample collection schedule after each of the challenges. Prior to the challenge (0), on days 1, 6, 8, treatment day (DRx) and DRx+7 samples were collected for plasma and PBMC isolation and cryopreservation (blue arrow). Every day from D6 until the clearance of parasites after treatment a sample was taken for quantitative PCR and blood smear to monitor parasitemia (blue dot). On DRx+7 plasmablasts were isolated from PBMCs collected by apheresis (*).
Fig. 2
Fig. 2. Repeat CHMI Clinical Trial CONSORT Diagram.
Twenty-seven participants were enrolled over the course of the study to either receive sequential controlled human malaria infections (CHMI) (14) or a single CHMI (13) as controls for mosquito infectivity. Of the 14 participants enrolled to received repetitive CHMIs 10 completed the mock CHMI, and an additional 4 were enrolled at CHMI 2 as replacements for the 4 original participants that withdrew. In total, 5 participants received 4 infectious CHMIs and 3 participants received 3 infectious CHMI and were included in the final analysis.
Fig. 3
Fig. 3. Blood stage parasite detection was delayed and reports of symptoms decreased in CHMI 3 and 4.
A Parasitemia (p/ml) measured by quantitative PCR (qPCR) of Pf18s rRNA for each participant through the 4 CHMI (CHMI 1 n = 8, CHMI 2 n = 8, CHMI 3 n = 8, CHMI 4 n = 5)). Colored lines represent each participant. B Kaplan–Meier survival curve where each colored line indicates the percent of participants without patent parasitemia by blood smear on each CHMI. P value are based on the log-rank (Mantel–Cox) test comparing the time to first positive result between CHMI 1 and each other CHMI. C Blood stage multiplication was calculated for each participant (dots color coded as in (A)) for each CHMI using the increase in parasitemia over time from first qPCR detection until treatment. Data are presented as median and interquartile range. No significant differences were found between CHMI 1 and CHMI 2-4, Holm-Šídák’s multiple comparisons test. D The total number of symptom reports by each participant that completed all 4 CHMI is indicated by a line (n = 5). Statistical differences were tested using the Dunn’s multiple comparisons test comparing each CHMI to CHMI 1 and all P values are two-sided. Source data are provided as a Source Data file.
Fig. 4
Fig. 4. Anti-CSP IgG levels increase after repetitive CHMI.
Plasma levels of IgM and IgG antibodies against CSP repeat (NANP8) and the GLURP R2 repeat peptides were determined by ELISA for all participants (CHMI1 n = 8, CHMI2 n = 8, CHMI3 n = 8, CHMI4 n = 5) on D1 before exposure to Pf-infected mosquitoes, D6, D8, on day of treatment (DRx) and 7 days after treatment (DRx + 7) for each CHMI. For all participants the mean optical density (OD) at 410 nm at a 1/300 dilution subtracted by the OD 410 nm of a 1/300 dilution of the participants’ baseline samples (matched mock samples) is plotted. Participants with delayed patency at their last CHMI are shown in green. The population mean and standard error of the mean (SEM) at each time is indicated. Statistical differences were determined through CHMI 1-3 relative to D1 of CHMI 1, using Dunn’s multiple comparisons test while due to the smaller samples size a Holm-Šídák’s multiple comparisons test was used for CHMI 4. All P values are two-sided and the source data are provided as a Source Data file.
Fig. 5
Fig. 5. Anti-CSP IgG levels and CD69 + CD8 + CCR7-CD45RO+ T cells are positively correlated with patency day.
A Patency day (number of days from mosquito exposure to a positive peripheral blood smear) for each CHMI participant is plotted against their anti-CSP IgG level determined by ELISA on D1, DRx or DRx +7 (CHMI 1 n = 8, CHMI 2 n = 8, CHMI 3 n = 8, CHMI 4 n = 5). B Patency day from CHMI 2 to CHMI 4 for each participant that completed all 4 CHMIs (n = 5) is plotted against the number of CD69 + CD8 + CCR7-CD45RO+ T cells detected using flow cytometry of unstimulated PBMC isolated after the same CHMI 7 days after treatment (DRx+7). All six participants that completed the mock CHMI were included in the flow cytometry analysis, (CHMI 1 n = 6, CHMI 2 n = 6, CHMI 3 n = 5, CHMI 4 n = 4). Statistical analysis was determined by Spearman correlation (GraphPad Prism 9). Rho = correlation coefficient and the two-sided P values (p) are shown. Source data are provided as a Source Data file.
Fig. 6
Fig. 6. CD4+CXCR5+ T cell populations increase after repetitive CHMI and T follicular helper cells (Tfh) correlate with CXCL13 levels.
PBMC from each participant collected 7 days after treatment (DRx+7) on each CHMI were analyzed by flow cytometry without exogenous stimulation. All six participants that completed the mock CHMI were included in the flow cytometry analysis (C1 n = 6, C2 n = 6, C3 n = 5, C4 n = 4), but the participant with a low CD3 + CD4 + T cell count was excluded from the percent calculations (C1 n = 5, C2 n = 5, C3 n = 4, C4 n = 3). A The percent of CXCR5 positive CD3 + CD4 + T cells, CD3 + CD4 + CCR7-CD45RO+ (effector memory) and CD3 + CD4 + CCR7 + CD45RO+ (central memory) T cells detected on DRx+7 of each CHMI is shown. Mean values +/− standard error of the mean (SEM) are indicated for each time point. Statistical differences were determined using Dunnett’s multiple comparisons test between CHMI 1 and CHMI 2-4. Data that did not pass the normality test was first logarithmically transformed to conform to normality and then tested for significance. All P values are two-sided. B The logarithm of plasma CXCL13 levels (pg/ml) on DRx for each participant for each CHMI is plotted against the number (upper graph) or percent (lower graph) of (CD3 + CD4 + CD45RO + CXCR5 + PD-1+ (Tfh)) cells detected in the DRx+7 PBMC sample from the corresponding participant at the corresponding CHMI. Correlation analysis was determined using Spearman’s rank correlation and listed in each panel (rho = correlation coefficient and p = P value). C The mean value +/− SEM of CXCL13 (pg/ml) in plasma with anti-CSP IgG levels above or below 0.5 OD 410 nm on D1, D6, D8, DRx and DRx+7 for all 4 CHMI is shown. Statistical differences were determined using Mann–Whitney test and all P values are two-sided. Source data are provided as a Source Data file.
Fig. 7
Fig. 7. CD8 + CCR7-CD45RO-CXCR6 + T cells decrease and CD8 + CCR7-CXCR5 + T cells increase after repetitive CHMI.
Flow cytometry was used to analyze PBMC collected 7 days after treatment (DRx+7) from all participants that completed the mock CHMI analysis (C1 n = 6, C2 n = 6, C3 n = 5, C4 n = 4). A The number of cells per 200,000 total cells and percent of CD3 + CD8 + CCR7-CD45RO- (effector) T cells positive for CXCR6 or CXCR5. B The number of CD3 + CD8 + CCR7-CD45RO+ (effector memory) cells per 200,000 total cells positive for CXCR3 or PD-1. C The number and percent of PD-1 + CD8 + CCR7 + CD45RO+ (central memory) T cells. D The number and percent of CXCR5 and PD-1 positive CD8 + T cells, CD8 + CCR7-CD45RO−, CD8 + CCR7-CD45RO+ and CD8 + CCR7 + CD45RO + T cells. Data are presented as mean values +/− standard error of the mean (SEM). Statistical differences were determined using Dunnett’s multiple comparisons test between CHMI 1 and CHMI 2-4 and all P values are two-sided. Source data are provided as a Source Data file.
Fig. 8
Fig. 8. Cytokines levels peaked with parasitemia, except IL-18 that continued to increase for seven days.
Plasma cytokine levels were measured by multiplex bead analysis for each participant (CHMI 1 n = 8, CHMI 2 n = 8, CHMI 3 n = 8, CHMI 4 n = 5) on D1 before exposure to Pf-infected mosquitoes, D6, D8, day of treatment (DRx) and 7 days after treatment (DRx+7) for each CHMI. A The heatmap of the log of the average ratio of the cytokine concentration (pg/ml) on the indicated day of the CHMI to the baseline concentration following the mock challenge for all participants is shown. B Comparison of the parasitemia (parasites/ml) measured by quantitative PCR (qPCR) of Pf18s rRNA, the ratio of the plasma cytokine levels to the mock CHMI baseline quantified using a multiplex bead assay, and maximal temperature (°C) measured on the day each participant experienced their first and second peak of >3.3 parasites/µl (n = 6). Data are presented as mean values +/− standard error of the mean (SEM). Statistical differences were tested using Sidak’s multiple comparisons test and the P value is two-sided. Source data are provided as a Source Data file.

Similar articles

Cited by

References

    1. World Health Organization, World Malaria Report 2022. (ed. World Health Organization) 1–293, https://www.who.int/publications/i/item/9789240064898 (2022).
    1. Crompton PD, Pierce SK, Miller LH. Advances and challenges in malaria vaccine development. J. Clin. Invest. 2010;120:4168–4178. doi: 10.1172/JCI44423. - DOI - PMC - PubMed
    1. Jongo SA, et al. Safety and differential antibody and T-cell responses to the Plasmodium falciparum sporozoite malaria vaccine, PfSPZ vaccine, by age in Tanzanian adults, adolescents, children, and infants. Am. J. Trop. Med Hyg. 2019;100:1433–1444. doi: 10.4269/ajtmh.18-0835. - DOI - PMC - PubMed
    1. Bouharoun-Tayoun H, Attanath P, Sabchareon A, Chongsuphajaisiddhi T, Druilhe P. Antibodies that protect humans against Plasmodium falciparum blood stages do not on their own inhibit parasite growth and invasion in vitro, but act in cooperation with monocytes. J. Exp. Med. 1990;172:1633–1641. doi: 10.1084/jem.172.6.1633. - DOI - PMC - PubMed
    1. Cohen S, Mc GI, Carrington S. Gamma-globulin and acquired immunity to human malaria. Nature. 1961;192:733–737. doi: 10.1038/192733a0. - DOI - PubMed

MeSH terms

Associated data