. 2024 Jun 18;15(1):5148.
doi: 10.1038/s41467-024-49007-4.

Digital telomere measurement by long-read sequencing distinguishes healthy aging from disease

Affiliations

Digital telomere measurement by long-read sequencing distinguishes healthy aging from disease

Santiago E Sanchez et al. Nat Commun. .

Abstract

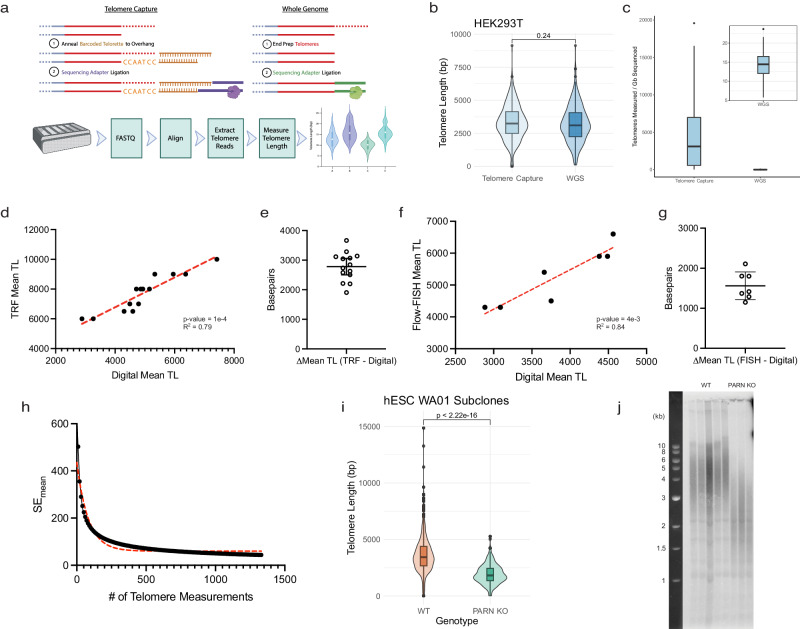
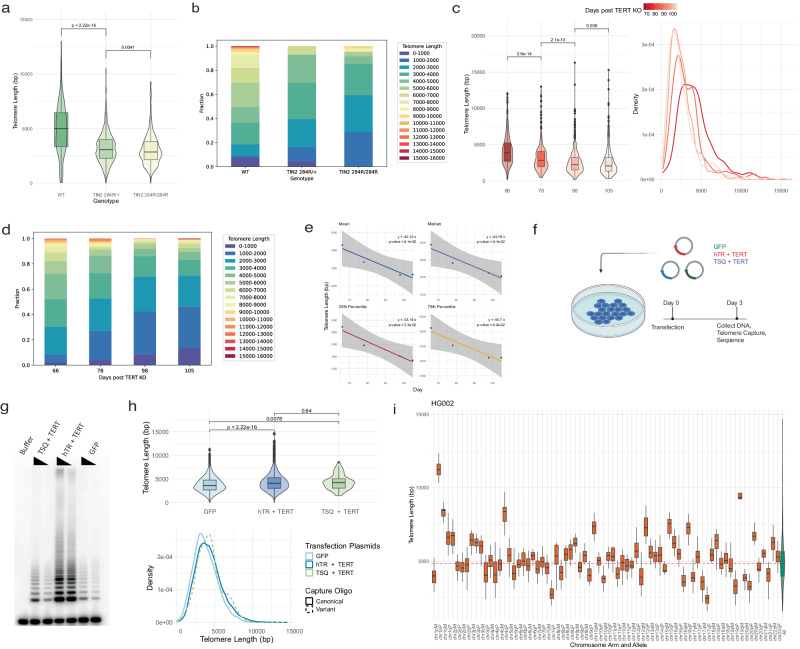
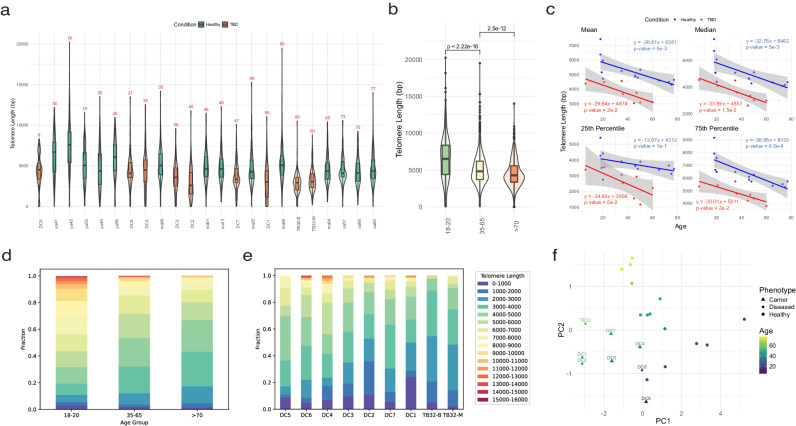
Telomere length is an important biomarker of organismal aging and cellular replicative potential, but existing measurement methods are limited in resolution and accuracy. Here, we deploy digital telomere measurement (DTM) by nanopore sequencing to understand how distributions of human telomere length change with age and disease. We measure telomere attrition and de novo elongation with up to 30 bp resolution in genetically defined populations of human cells, in blood cells from healthy donors and in blood cells from patients with genetic defects in telomere maintenance. We find that human aging is accompanied by a progressive loss of long telomeres and an accumulation of shorter telomeres. In patients with defects in telomere maintenance, the accumulation of short telomeres is more pronounced and correlates with phenotypic severity. We apply machine learning to train a binary classification model that distinguishes healthy individuals from those with telomere biology disorders. This sequencing and bioinformatic pipeline will advance our understanding of telomere maintenance mechanisms and the use of telomere length as a clinical biomarker of aging and disease.


Conflict of interest statement

S. Sanchez and S.E.A. are listed as inventors on a provisional patent application related to clinical applications of telomere measurement related to this work (STFD-006-P). The remaining authors declare no competing interests.

Figures

Fig. 1
Fig. 1. High-resolution telomere measurement by nanopore long-read sequencing.
a Schematic representation of DNA sequencing library preparation for telomere measurement by telomere capture or whole-genome long-read sequencing. b Head-to-head comparison of telomere length distributions obtained through either telomere capture (n = 417 telomere measurements) or whole-genome sequencing (n = 513 telomere measurements) library preparation from a single source of HEK 293 T DNA. c Telomeres per gigabase sequenced for both library preparation methods (n = 14 telomere capture experiments; n = 23 WGS). d Correlation between mean telomere lengths from matched samples determined by sequencing or TRF (n = 14, p value = 1e-4, R2 = 0.79). e The difference in bp between mean telomere length of matched samples measured by both TRF and sequencing (n = 14 individual, mean ± standard deviation represented by solid lines and error bars). f Correlation between mean telomere lengths from matched samples of RTEL1 mutant individuals determined by sequencing or flow-FISH (n = 7, p value = 4e-3, R2 = 0.84). g Difference in bp between mean telomere length of matched samples measured by both flow-FISH and sequencing (n = 7 individuals). h Bootstrapping analysis of the change in standard error of the mean telomere length as a function of the total number of telomeres measured using iterative random sampling of measurements with replacement. i Digital telomere measurement by sequencing of wild-type (n = 1333 telomeres, orange) and PARN KO hESCs (n = 407 telomeres, green). j Analog telomere measurement by TRF of wild-type (n = 5 independent subclones) and PARN KO (n = 3 independent subclones) hESC subclones. For all boxplots, the 25th and 75th percentile bound the bottom and top of the box, respectively, and the central bar represents the median. Boxplot outliers are defined as having values lesser or greater than 1.5× the interquartile range (denoted by the whiskers), displayed as black dots. Two-sided Wilcoxon rank sum test was used for all quantitative comparisons. Source data provided as a source data file. a created with BioRender.com released under a Creative Commons Attribution-NonCommercial-NoDerivs 4.0 International license.
Fig. 2
Fig. 2. Telomere attrition and de novo elongation in cultured human cells.
a Telomere length distributions of wild-type (n = 227), 284 R heterozygous (n = 1703) or homozygous (n = 487) TIN2 mutants. b Stacked bar graph of telomere length fractions from TIN2 284 R heterozygous and homozygous mutant hESCs. c Telomere length distributions of hESCs 66 (n = 377), 78 (n = 350), 98 (n = 968), to 108 (n = 915) days post Cre-mediated TERT knockout. Box and violin plots of telomere lengths (left) alongside density distributions of telomere lengths (right). d Stacked bar graphs of telomere length fractions from hESCs following TERT knockout. e Linear regression of telomere length distribution summary statistics versus days post TERT knockout (n = 1 for each day, 95% confidence interval in gray). f Schematic representation of HEK293T telomerase overexpression experiment. g TRAP assay for telomerase activity in transiently transfected HEK293T cells. h Telomere length distributions as box or violin plots (Top) and density distributions (Bottom) for transiently transfected HEK293T cells as measured by both canonical and variant telomere capture sequencing (GFP n = 6424 telomeres over 2 technical replicate runs, hTR + TERT n = 21,402, TSQ + TERT n = 62). i Chromosome, allele-specific telomere length distributions (chromosome-specific boxplots in orange; bulk distribution with violin plot for comparison in green) measured in the HG002 cell line using a HG002 allele-annotated diploid reference genome (n = 1862). For all boxplots: the 25th and 75th percentile bound the bottom and top of the box, respectively and the central bar represents the median, dotted red line represents bulk median. Boxplot outliers are defined as having values lesser or greater than 1.5× the interquartile range (denoted by the whiskers), displayed as black dots. A two-sided Wilcoxon rank sum test was used for all quantitative comparisons. Source data provided as a source data file. f created with BioRender.com released under a Creative Commons Attribution-NonCommercial-NoDerivs 4.0 International license.
Fig. 3
Fig. 3. Telomere length distributions distinguish healthy human aging and disease.
a Telomere length distributions from PBLs of 14 healthy individuals and 8 TBD variant carriers, including two samples from both PBLs (TB32-B) or a bone marrow biopsy (TB32-M) from one TBD variant carrier (precise telomere coverage per sample provided in Supplementary Data 1). b Telomere length distributions from PBLs of 14 healthy individuals aggregated into young (18–20; n = 5 individuals, n = 834 telomeres, green), middle (35–65; n = 6 individuals, n = 1882 telomeres, yellow), and elder (>70; n = 3 individuals, n = 1036 telomeres, orange) aged cohorts. c Linear regressions of telomere length summary statistics versus donor age in 14 healthy individuals (blue) or 8 TBD variant carriers (red). d Stacked bar graph representing telomere length fractions in 1000 bp bins from 0 to 1000 to 15,000 to 16,000 in young, middle, and elder aged cohorts. e Stacked bar graph representing telomere length fractions in 1000 bp bins from 0 to 1000 to 15,000 to 16,000 in 9 samples from individuals with mutations associated with, or being evaluated for, telomere biology disorders. f Principal component analysis of telomere length distributions of healthy aging (n = 14, unlabeled) and TBD variant carrier samples (n = 9, labeled). For all boxplots: The 25th and 75th percentile bound the bottom and top of the box, respectively and the central bar represents the median. Boxplot outliers are defined as having values lesser or greater than 1.5× the interquartile range (denoted as whiskers), displayed as black dots. A two-sided Wilcoxon rank sum test was used for all quantitative comparisons. Source data provided as a source data file.
Fig. 4
Fig. 4. Telomere length distributions from patient-matched benign and malignant colonic tissue in a cohort of colorectal carcinoma patients (total n = 37,139, precise number of telomere measurements per patient and tissue sample are in Supplementary Data 2).
Box and violin plots of telomere length distributions for twenty individuals in the cohort showing matched benign (red) and malignant (blue) colonic tissue by patient ID. Patients for whom tumors harbored telomeres equal to or longer than their benign colonic epithelia are highlighted by red boxes. For all boxplots: The 25th and 75th percentile bound the bottom and top of the box, respectively and the central bar represents the median. Boxplot outliers are defined as having values lesser or greater than 1.5× the interquartile range (denoted as whiskers), displayed as black dots. A two-sided Wilcoxon rank sum test was used for all quantitative comparisons. Source data is provided as a source data file.

Update of

Similar articles

Cited by

References

    1. Moyzis RK, et al. A highly conserved repetitive DNA sequence, (TTAGGG)n, present at the telomeres of human chromosomes. Proc. Natl Acad. Sci. USA. 1988;85:6622–6626. doi: 10.1073/pnas.85.18.6622. - DOI - PMC - PubMed
    1. Denchi EL, de Lange T. Protection of telomeres through independent control of ATM and ATR by TRF2 and POT1. Nature. 2007;448:1068–1071. doi: 10.1038/nature06065. - DOI - PubMed
    1. Greider CW, Blackburn EH. Identification of a specific telomere terminal transferase activity in Tetrahymena extracts. Cell. 1985;43:405–413. doi: 10.1016/0092-8674(85)90170-9. - DOI - PubMed
    1. Morin GB. The human telomere terminal transferase enzyme is a ribonucleoprotein that synthesizes TTAGGG repeats. Cell. 1989;59:521–529. doi: 10.1016/0092-8674(89)90035-4. - DOI - PubMed
    1. Watson JD. Origin of concatemeric T7DNA. Nat. N. Biol. 1972;239:197–201. doi: 10.1038/newbio239197a0. - DOI - PubMed