. 2024 Jun 18;15(1):4759.
doi: 10.1038/s41467-024-48961-3.

Plasma proteomics identify biomarkers predicting Parkinson's disease up to 7 years before symptom onset

Affiliations

Plasma proteomics identify biomarkers predicting Parkinson's disease up to 7 years before symptom onset

Jenny Hällqvist et al. Nat Commun. .

Abstract

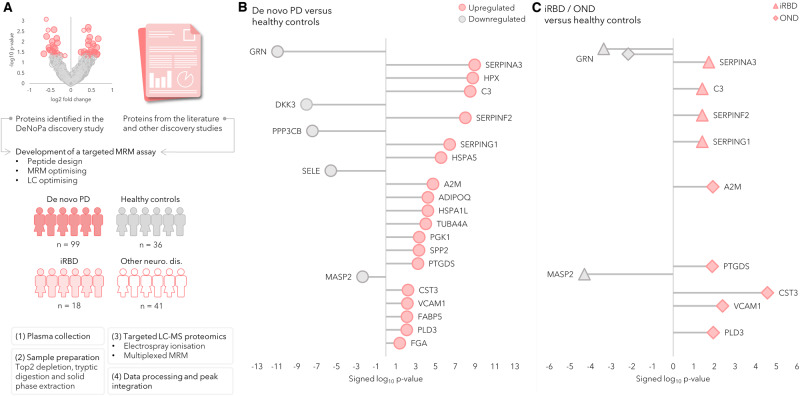
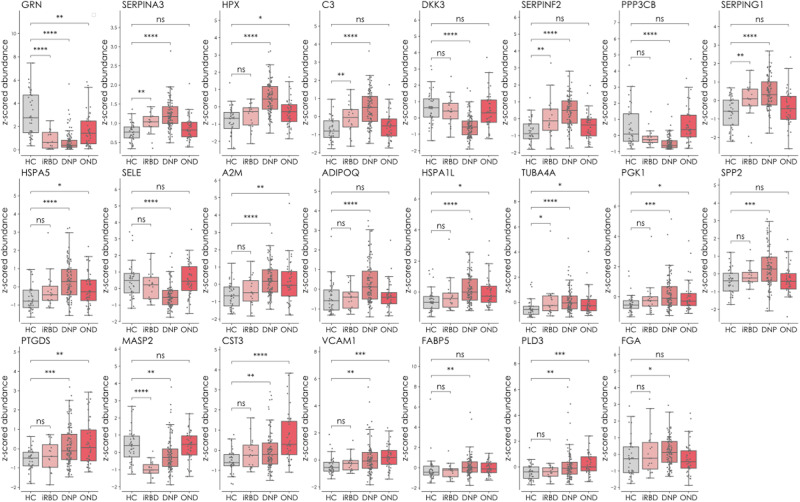
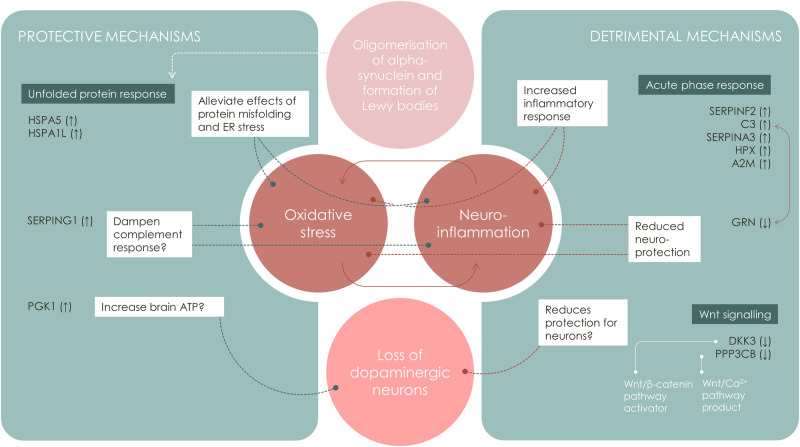
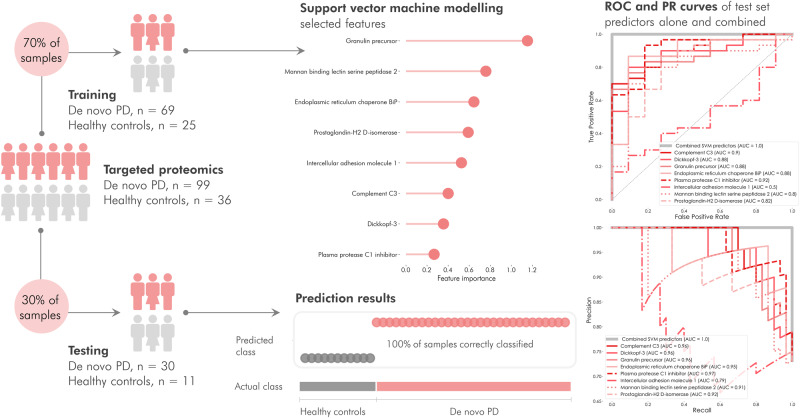
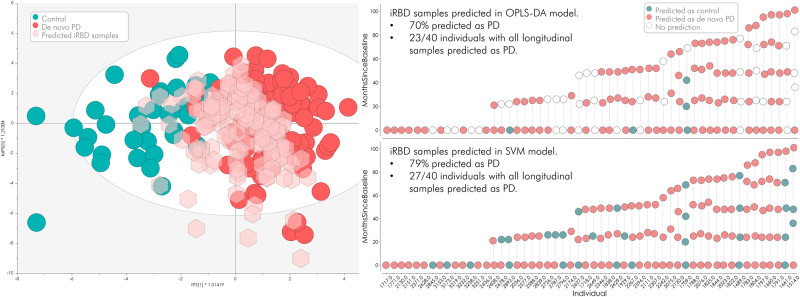
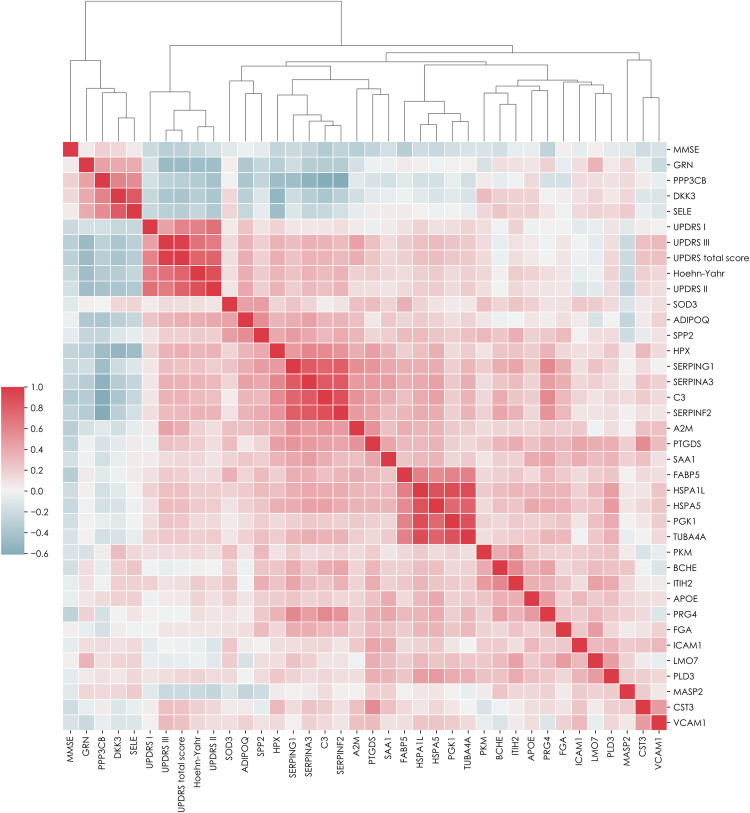
Parkinson's disease is increasingly prevalent. It progresses from the pre-motor stage (characterised by non-motor symptoms like REM sleep behaviour disorder), to the disabling motor stage. We need objective biomarkers for early/pre-motor disease stages to be able to intervene and slow the underlying neurodegenerative process. Here, we validate a targeted multiplexed mass spectrometry assay for blood samples from recently diagnosed motor Parkinson's patients (n = 99), pre-motor individuals with isolated REM sleep behaviour disorder (two cohorts: n = 18 and n = 54 longitudinally), and healthy controls (n = 36). Our machine-learning model accurately identifies all Parkinson patients and classifies 79% of the pre-motor individuals up to 7 years before motor onset by analysing the expression of eight proteins-Granulin precursor, Mannan-binding-lectin-serine-peptidase-2, Endoplasmatic-reticulum-chaperone-BiP, Prostaglaindin-H2-D-isomaerase, Interceullular-adhesion-molecule-1, Complement C3, Dickkopf-WNT-signalling pathway-inhibitor-3, and Plasma-protease-C1-inhibitor. Many of these biomarkers correlate with symptom severity. This specific blood panel indicates molecular events in early stages and could help identify at-risk participants for clinical trials aimed at slowing/preventing motor Parkinson's disease.


Conflict of interest statement

JH, MD, MX, SW, KB, ME, PG, MGB, CP, KM, ID, WH, JS, HV and CF and have no competing interests to report. MB has received funding from the Deutsche Forschungsgemeinschaft (DFG, German Research Foundation) – 413,501,650. CT has received honoraria for consultancy from Roche, and honoraria for educational lectures from UCB, and has received research funding for the PPMI study from the Michael J. Fox Foundation and funding from the EU (Horizon 2020) and stipends from the (International Parkinson’s and Movement Disorder Society) IPMDS. BM has received honoraria for consultancy from Roche, Biogen, AbbVie, UCB, and Sun Pharma Advanced Research Company. BM is a member of the executive steering committee of the Parkinson Progression Marker Initiative and PI of the Systemic Synuclein Sampling Study of the Michael J. Fox Foundation for Parkinson’s Research and has received research funding from the Deutsche Forschungsgemeinschaft (DFG), EU (Horizon 2020), Parkinson Fonds Deutschland, Deutsche Parkinson Vereinigung, Parkinson’s Foundation and the Michael J. Fox Foundation for Parkinson’s Research. MLM has received honoraria for speaking engagements from Deutsche Parkinson Gesellschaft e.V., and royalties from Gesellschaft fur Medien + Kommunikation mbH + Co. FSD has received honoraria for speaking engagements from AbbVie, Bial, Ever Pharma, Medtronic and royalties from Elsevier and Springer. She served on an advisory board for Zambon and Stada Pharma. FSD participated in Ad Boards for consultation: Abbvie, UCB, Bial, Ono, Roche and got honorary for lecturing: Stada Pharm, AbbVie, Alexion, Bial. S. Schade received institutional salaries supported by the EU Horizon 2020 research and innovation programme under grant agreement No. 863664 and by the Michael J. Fox Foundation for Parkinson’s Research under grant agreement No. MJFF-021923. He is supported by a PPMI Early Stage Investigators Funding Programme fellowship of the Michael J. Fox Foundation for Parkinson’s Research under grant agreement No. MJFF-022656. S. Schreglmann received institutional salaries supported by the EU Horizon 2020 research and innovation programme under grant agreement No. 863664, support from the Advanced Clinician Scientist programme by the Interdisciplinary Centre for Clinical Research, Wuerzburg, Germany, and from the Deutsche Forschungsgemeinschaft (DFG, German Research Foundation) Project-ID 424778381-TRR 295. He is a fellow of the Thiemann Foundation. He serves as a scientific adviser to Elemind Inc.

Figures

Fig. 1
Fig. 1. All-over workflow of the study.
The study included three phases. Phase 0 consisted of discovery proteomics by untargeted mass spectrometry to identify putative biomarkers, followed by phase I in which targets from the discovery phase were transferred to a targeted, mass spectrometric MRM method and applied to a new and larger cohort of samples, and finally phase II in which the targeted MRM method was refined and a larger number of samples were analysed to evaluate the clinical feasibility of the targeted protein panel.
Fig. 2
Fig. 2. Discovery phase in plasma samples of de novo PD (n = 10) and healthy controls (n = 10) represented by a Volcano plot showing the protein expression differences between PD and controls (phase 0).
The circle radii in the Volcano plot represent the identification certainty, where large radii represent proteins identified by at least two unique peptides and an identification score >15, smaller radii are given for proteins identified by two or more unique peptides or a confidence score >15. The horizontal axis shows log2 of the average fold-change and the vertical axis shows −log10 of the p values. The significantly different proteins are annotated by gene name and coloured in pink, while the non-significant proteins are coloured in grey. GO annotations for the significant proteins are shown, the dashed line represents p = 0.05. Disease and function annotations from IPA are shown, divided into annotations with a positive or negative activation score. Source data are provided as a Source Data file.
Fig. 3
Fig. 3. Workflow and overview of results of the targeted proteomic analysis.
Workflow and overview of the results of the targeted proteomic analysis of de novo Parkinson’s disease (PD) subjects, healthy controls (HC), and the validation cohorts of other neurological disorders (OND) and isolated REM sleep behaviour disorder (iRBD). A A targeted mass spectrometric proteomic assay was developed and optimised. The assay was then applied to plasma samples from cohorts comprising de novo PD (n = 99) and HC (n = 36), and validated in patients with OND (n = 41) and prodromal subjects with iRBD (n = 18). The protein expression difference between the groups was compared using Mann–Whitney’s two-sided U-test with Benjamini–Hochberg FDR adjustment at 5%. The lollipop charts show the log10 p values, signed according to fold-changes. Pink icons represent a protein upregulated in an affected group and grey represents a protein upregulated in controls. B Significantly differentially expressed proteins in the comparison between de novo PD and healthy controls. C Significantly differentially expressed proteins between iRBD, OND and HC. Source data are provided as a Source Data file.
Fig. 4
Fig. 4. Significantly different proteins between controls and the different disease groups de novo PD (DNP), iRBD and OND (phase II).
The data are displayed as Box and Whisker plots overlaid with scatter plots of the individual measurements. The whiskers show the minimum and maximum, and the boxes show the 25th percentile, the median and the 75th percentile. The protein expression difference between the groups was compared using Mann–Whitney’s two-sided U-test with Benjamini–Hochberg multiple testing correction (FDR adjustment at 5%). ns not significant, *p < 0.05, **p < 0.01, ***p < 0.001 and ****p < 0.0001. The proteins are represented by gene names. Source data are provided as a Source Data file.
Fig. 5
Fig. 5. Suggested involvement of the differentially expressed proteins in neuronal synuclein disease.
Oligomerisation and accumulation of α-synuclein in Lewy body inclusions is a key process in the pathophysiology of neuronal synuclein disease, i.e. Parkinson’s disease and dementia with Lewy bodies from aggregation and accumulation, the pathological pathway includes different steps finally leading to the loss of dopaminergic neurons. Protective and detrimental mechanisms influence these processes, based on the differently expressed protein profiles, assessed by targeted mass spectrometry in our study. Detailed information about the proteins can be found in Supplementary Table 2.
Fig. 6
Fig. 6. Linear support vector classification of PD and control subjects. (phase I).
The model was trained on 70% of the samples to establish the most discriminating features. Applying cross-validated recursive feature elimination, the top predictors were determined as a granulin precursor, mannan-binding lectin-serine peptidase 2, endoplasmic reticulum chaperone-BiP, prostaglandin-H2 d-isomerase, intercellular adhesion molecule-1, complement C3, dickkopf-3 and plasma protease C1 inhibitor. The remaining 30% of samples were predicted in the model and resulted in 100% prediction accuracy. Receiver operating characteristics (ROC) and precision-recall (PR) curves of the individual and combined proteins in the test set demonstrated that the individual proteins achieved ROC area under the curve (AUC) values 0.53–0.92 and PR values 0.79–0.96, while the combined predictors reached an area under the curve = 1.0. Source data are provided as a Source Data file.
Fig. 7
Fig. 7. Prediction results from of a newly acquired set of prodromal isolated REM sleep behaviour disorder (iRBD) samples (phase II).
146 new serum samples from individuals diagnosed with iRBD, several with longitudinal follow-up samples, were predicted in the OPLS-DA model. 70% of the samples were predicted as Parkinson’s disease (PD), and 23 of 40 individuals had all their longitudinal samples predicted as PD. In the more refined support vector machine (SVM) model, 79% of the 146 new samples were predicted as PD and 27 of 40 individuals consistently had all their longitudinal samples predicted as PD. Source data are provided as a Source Data file.
Fig. 8
Fig. 8. Correlation and clustering heatmap of proteins measured by targeted mass spectrometry and clinical scores in controls and Parkinson’s disease subjects. (phase I).
The correlation was performed using Spearman’s procedure, and the clustering method was set to average. The clustering metric was Euclidean. The heatmap is coloured by correlation coefficient where red represents positive and blue negative correlations. The proteins are represented by gene names. Detailed information about the protein correlations can be found in Supplementary Table 3. De novo Parkinson’s disease (n = 99) and healthy controls (n = 36). MMSE mini-mental state examination, UPDRS unified Parkinson’s disease rating Scale. Source data are provided as a Source Data file.

References

    1. Simuni T, et al. Baseline prevalence and longitudinal evolution of non-motor symptoms in early Parkinson’s disease: the PPMI cohort. J. Neurol. Neurosurg. Psychiatry. 2018;89:78–88. doi: 10.1136/jnnp-2017-316213. - DOI - PMC - PubMed
    1. Michell AW, Lewis SJ, Foltynie T, Barker RA. Biomarkers and Parkinson’s disease. Brain. 2004;127:1693–1705. doi: 10.1093/brain/awh198. - DOI - PubMed
    1. Kieburtz K, Katz R, McGarry A, Olanow CW. A new approach to the development of disease-modifying therapies for PD; fighting another pandemic. Mov. Disord. 2021;36:59–63. doi: 10.1002/mds.28310. - DOI - PMC - PubMed
    1. Shahnawaz M, et al. Development of a biochemical diagnosis of Parkinson disease by detection of α-synuclein misfolded aggregates in cerebrospinal fluid. JAMA Neurol. 2017;74:163–172,. doi: 10.1001/jamaneurol.2016.4547. - DOI - PubMed
    1. Mollenhauer, B. et al. Validation of serum neurofilament light chain as a biomarker of Parkinson’s disease progression. Mov. Disord. 10.1002/mds.28206 (2020). - PMC - PubMed