Clinical Trial
. 2024 Jun 18;15(1):5191.
doi: 10.1038/s41467-024-49050-1.

Adolescent BCG revaccination induces a phenotypic shift in CD4+ T cell responses to Mycobacterium tuberculosis

Affiliations
Clinical Trial

Adolescent BCG revaccination induces a phenotypic shift in CD4+ T cell responses to Mycobacterium tuberculosis

One B Dintwe et al. Nat Commun. .

Abstract

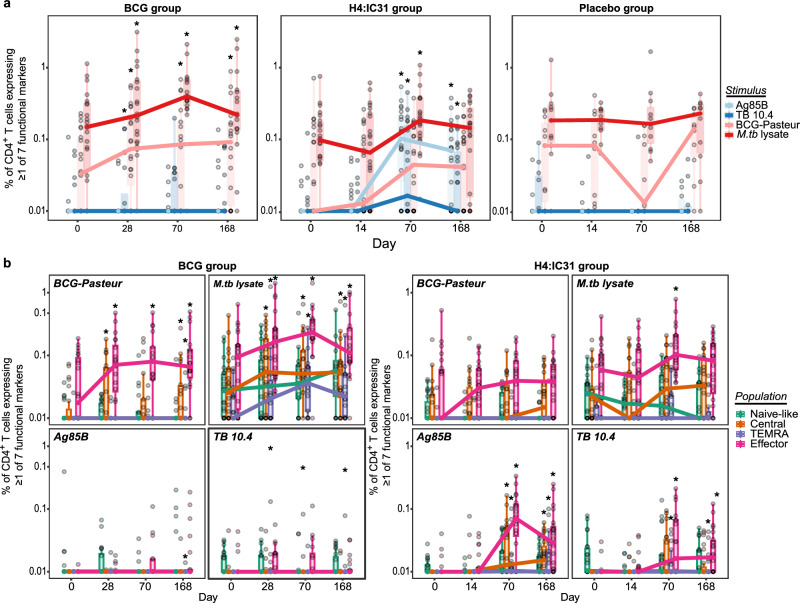
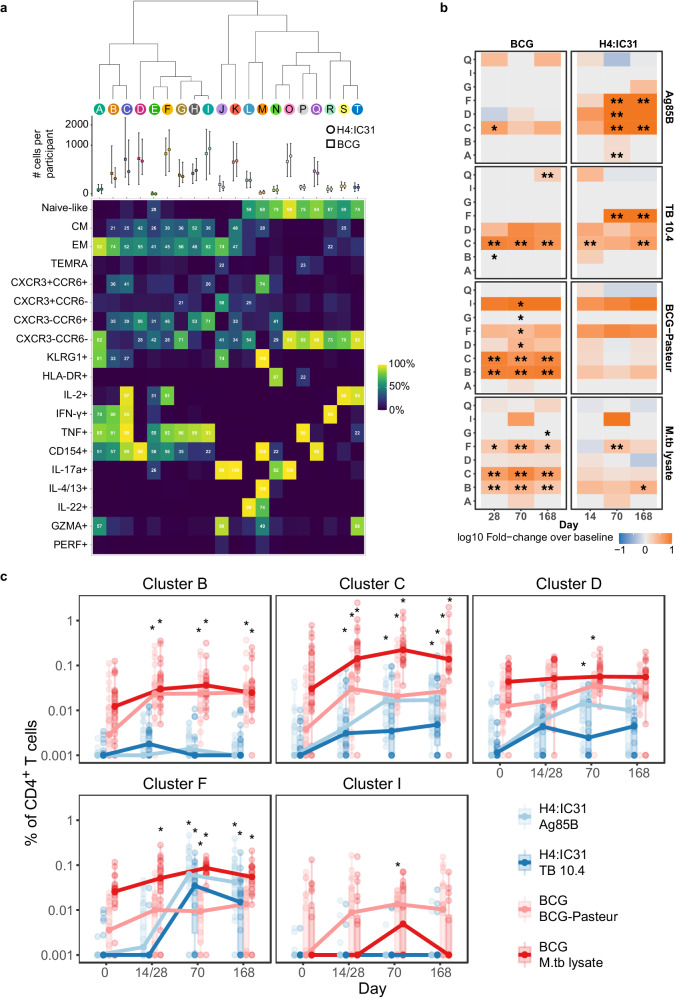
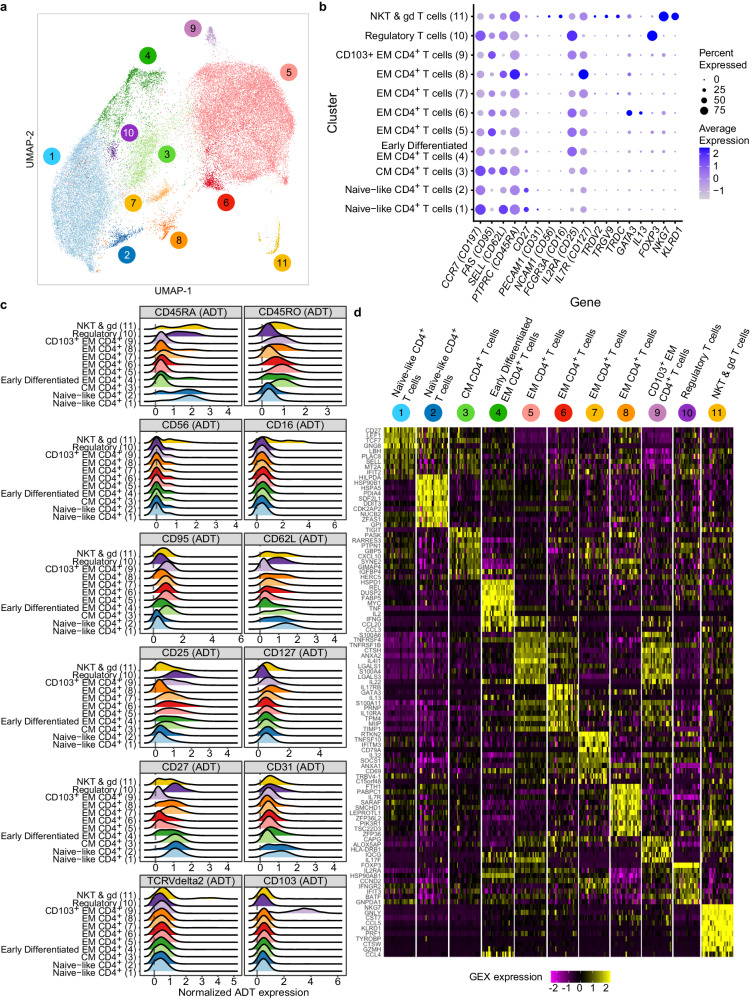
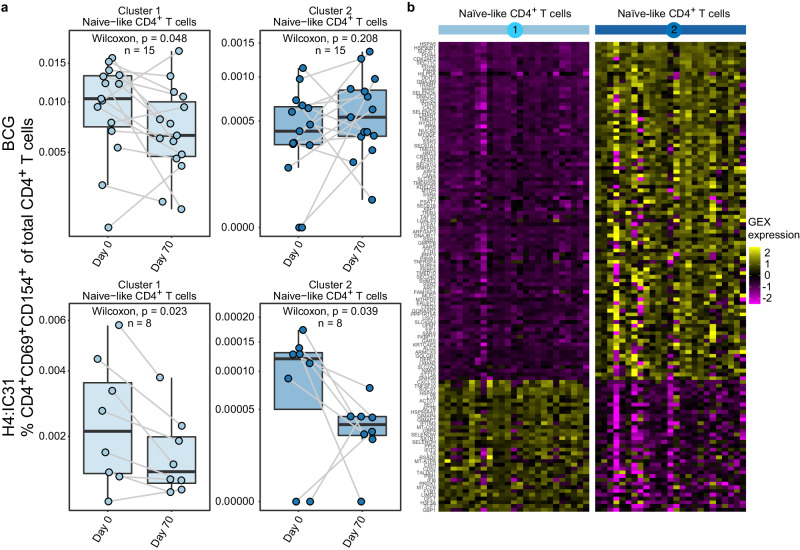
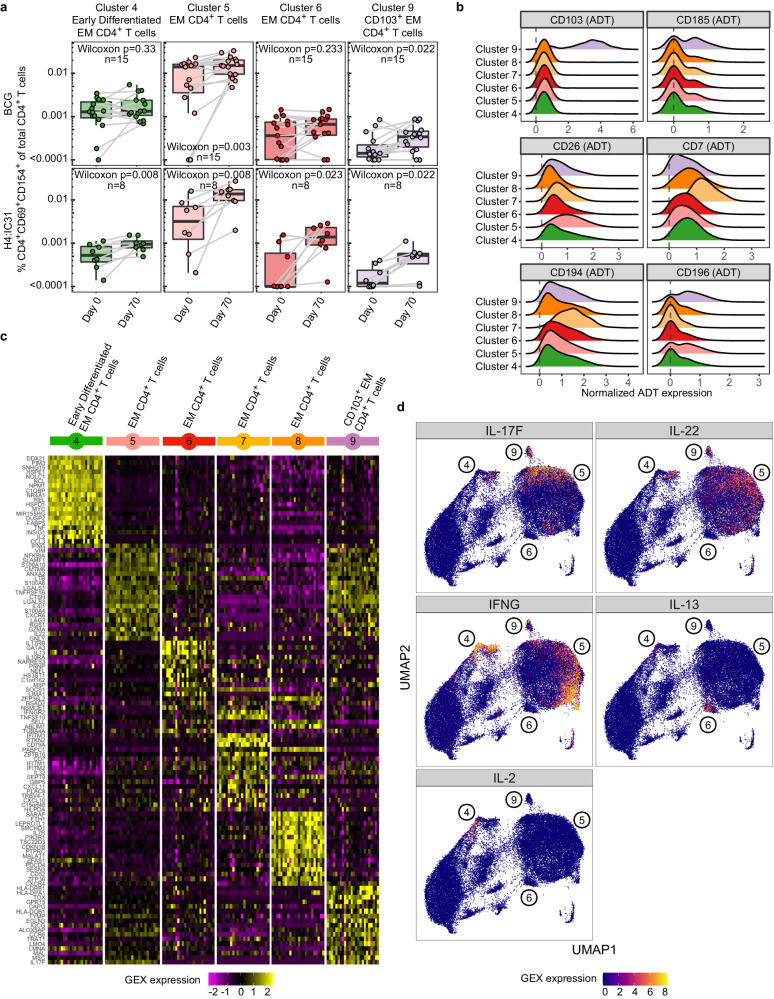
A recent clinical trial demonstrated that Bacille Calmette-Guérin (BCG) revaccination of adolescents reduced the risk of sustained infection with Mycobacterium tuberculosis (M.tb). In a companion phase 1b trial, HVTN 602/Aeras A-042, we characterize in-depth the cellular responses to BCG revaccination or to a H4:IC31 vaccine boost to identify T cell subsets that could be responsible for the protection observed. High-dimensional clustering analysis of cells profiled using a 26-color flow cytometric panel show marked increases in five effector memory CD4+ T cell subpopulations (TEM) after BCG revaccination, two of which are highly polyfunctional. CITE-Seq single-cell analysis shows that the activated subsets include an abundant cluster of Th1 cells with migratory potential. Additionally, a small cluster of Th17 TEM cells induced by BCG revaccination expresses high levels of CD103; these may represent recirculating tissue-resident memory cells that could provide pulmonary immune protection. Together, these results identify unique populations of CD4+ T cells with potential to be immune correlates of protection conferred by BCG revaccination.


Conflict of interest statement

The authors declare no competing interests.

Figures

Fig. 1
Fig. 1. BCG revaccination and H4:IC31 vaccination boost effector memory CD4+ T cell responses in South African adolescents.
Cellular responses were evaluated by 26-color intracellular cytokine staining (ICS). a Proportion of antigen reactive CD4+ T cells in the BCG revaccinated (n = 22 biologically independent samples), H4:IC31 vaccinated (n = 24 biologically independent samples) and placebo groups (n = 10 biologically independent samples) over time. Circles represent an individual participant’s response. Percentage of CD4+ T cells expressing at least 1 of the 7 functional markers (IL-2, IFN-γ, TNF, IL-17a, IL-4/13, IL-22 and CD154) is shown after stimulation with the Ag85B (light blue) or TB10.4 (dark blue) peptide pools, or BCG (light red), or M.tb lysate (dark red) in the ICS assay. The exact p values can be found in (Supplementary Data 1b). b Proportion of antigen-reactive memory CD4+ T cell populations (naïve-like [CD45RA+CCR7+], central memory [TCM; CD45RA-CCR7+], effector memory [TEM; CD45RACCR7], terminally differentiated effector memory [TEMRA; CD45RA+CCR7]) of total CD4+ T cells after BCG revaccination (n = 22 biologically independent samples) or H4:IC31 vaccination (n = 24 biologically independent samples) following stimulation with the antigens noted in the legend. Paired analysis between timepoints was performed using the two sided Wilcoxon signed-rank test, *FDR q-value p < 0.05. Boxplots indicate the median response and the first and third quartiles; whiskers extend to no further than 1.5 times the inter-quartile range. Source data are provided as a Source Data file.
Fig. 2
Fig. 2. Multiple clusters of polyfunctional effector memory CD4+ T cells increase after vaccination.
a Based on flow cytometry data, heatmap showing the proportion of cells within the 20 PhenoGraph clusters expressing each marker. Each column represents a unique cluster in one or both vaccine groups. The percentage of cells in a given cluster expressing each of the markers evaluated is shown numerically; markers expressed in fewer than 20% of the cells are not annotated. Graph above the heatmap shows the median number of cells per participant in each cluster by vaccine arm with error bars extending to no further than 1.5 times the inter-quartile range. b Heatmap showing fold-change in the frequency of CD4+ T cells in each of the clusters that showed a significant change over pre-vaccination (Day 0) in at least one timepoint in at least one of the vaccine groups. *FDR q < 0.05; **FDR q < 0.01. c Percentage of total activated CD4+ T cells for each significant cluster over the time course. Ag85B (light blue) and TB10.4 (dark blue) peptide pool stimulations; for the BCG group (n = 22 biologically independent samples), only the BCG (light red), M.tb lysate (dark red) stimulations. *FDR q < 0.05, two sided Wilcoxon Signed Rank Test. Boxplots indicate the median response and the first and third quartiles; whiskers extend to no further than 1.5 times the inter-quartile range. Source data are provided as a Source Data file.
Fig. 3
Fig. 3. TB vaccination induces distinct clusters of CD4+ T cells.
a Unsupervised WNN clustering and UMAP projection of 42,067 CD4+CD69+CD154+ T cells measured by CITE-Seq reveals 11 distinct clusters. b Graph showing select genes used in cluster annotation. The percentage of cells expressing select genes (size of circle) and the average expression of each gene (color of circle) by cluster is shown for the CD4+CD69+CD154+ T cells measured by CITE-Seq. c Ridge plot of the normalized antibody-derived tagged (ADT) surface marker expression on the CD4+ T cells by cluster. d Heatmap showing average gene expression per participant of the top 10 genes that distinguish the different clusters from each other.
Fig. 4
Fig. 4. TB vaccination alters antigen-reactive naïve-like cell clusters.
a Proportion of antigen-reactive T cells of total CD4+ T cells present in each naïve-like cluster, measured by CITE-Seq, that showed a significant change after vaccination in either the BCG (n = 15) or the H4:IC31 (n = 8) vaccine groups. *p < 0.05, **p < 0.01, two sided Wilcoxon Signed Rank test. Each point depicts the response in a single participant. Boxplots indicate the median response and the first and third quartiles; whiskers extend to no further than 1.5 times the inter-quartile range. b Heatmap showing average gene expression by participant (columns) of the genes (rows) that distinguish the 2 antigen-reactive naïve-like CD4+ T cell clusters from each other.
Fig. 5
Fig. 5. TB vaccination boosts multiple TEM clusters.
a Proportion of activated T cells of total CD4+ T cells, measured by CITE-Seq, present in each TEM cluster that showed a significant change after vaccination in either the BCG (n = 15) or the H4:IC31 (n = 8) vaccine groups. *p < 0.05, **<0.01, two sided Wilcoxon Signed Rank test. Each point depicts the response in a single participant. Boxplots indicate the median response and the first and third quartiles; whiskers extend to no further than 1.5 times the inter-quartile range. b Ridge plot showing normalized expression values of antibody-derived tags (ADT) for selected surface markers for the TEM CD4+ T cell clusters. c Heatmap showing average gene expression by participant (columns) of the top 20 genes (rows) that distinguish the 6 antigen-reactive TEM CD4+ T cell clusters from each other. d Overlay showing cells expressing transcripts of selected cytokines on the UMAP projection of all activated CD4+ T cells. Cluster numbers are shown on the figure.

References

    1. World Health Organization. Global Tuberculosis Report 2022. (WHO, Geneva, 2022; available online at https://www.who.int/teams/global-tuberculosis-programme/tb-reports).
    1. Miner MD, et al. Developing tuberculosis vaccines for people with HIV: consensus statements from an international expert panel. Lancet HIV. 2022;9:e791–e800. doi: 10.1016/S2352-3018(22)00255-7. - DOI - PMC - PubMed
    1. Mangtani P, et al. Protection by BCG vaccine against tuberculosis: a systematic review of randomized controlled trials. Clin. Infect. Dis. 2014;58:470–480. doi: 10.1093/cid/cit790. - DOI - PubMed
    1. Lange C, et al. 100 years of Mycobacterium bovis bacille Calmette-Guerin. Lancet Infect. Dis. 2022;22:e2–e12. doi: 10.1016/S1473-3099(21)00403-5. - DOI - PMC - PubMed
    1. Bunyasi EW, et al. Regional changes in tuberculosis disease burden among adolescents in South Africa (2005-2015) PLoS One. 2020;15:e0235206. doi: 10.1371/journal.pone.0235206. - DOI - PMC - PubMed

Publication types