. 2024 Jun 18;15(6):428.
doi: 10.1038/s41419-024-06791-7.

The miR-29 family facilitates the activation of NK-cell immune responses by targeting the B7-H3 immune checkpoint in neuroblastoma

Affiliations

The miR-29 family facilitates the activation of NK-cell immune responses by targeting the B7-H3 immune checkpoint in neuroblastoma

Anup S Pathania et al. Cell Death Dis. .

Abstract

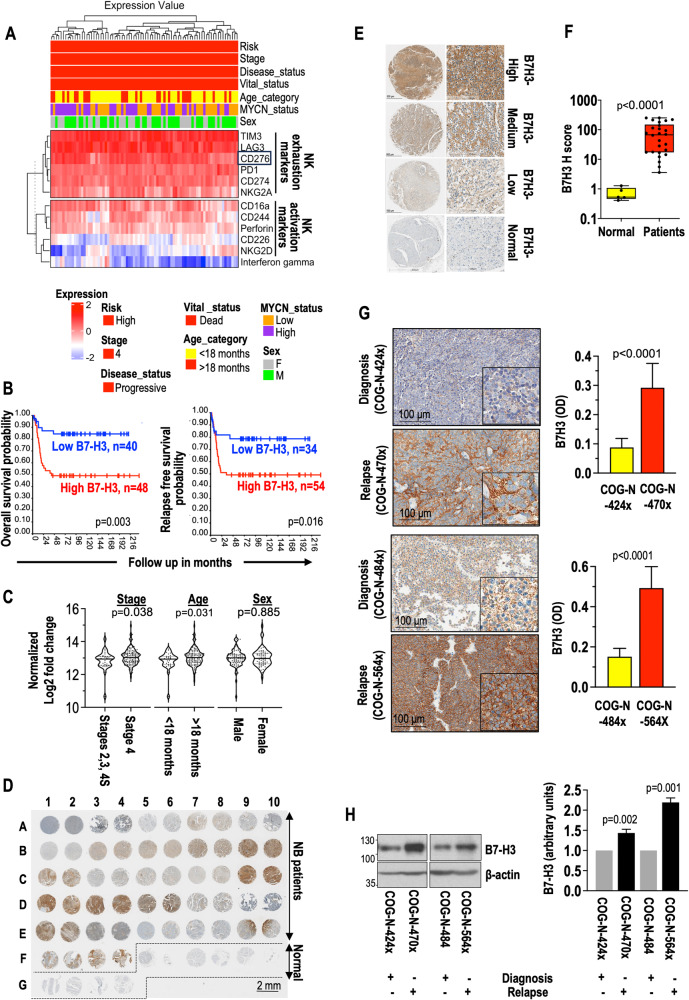
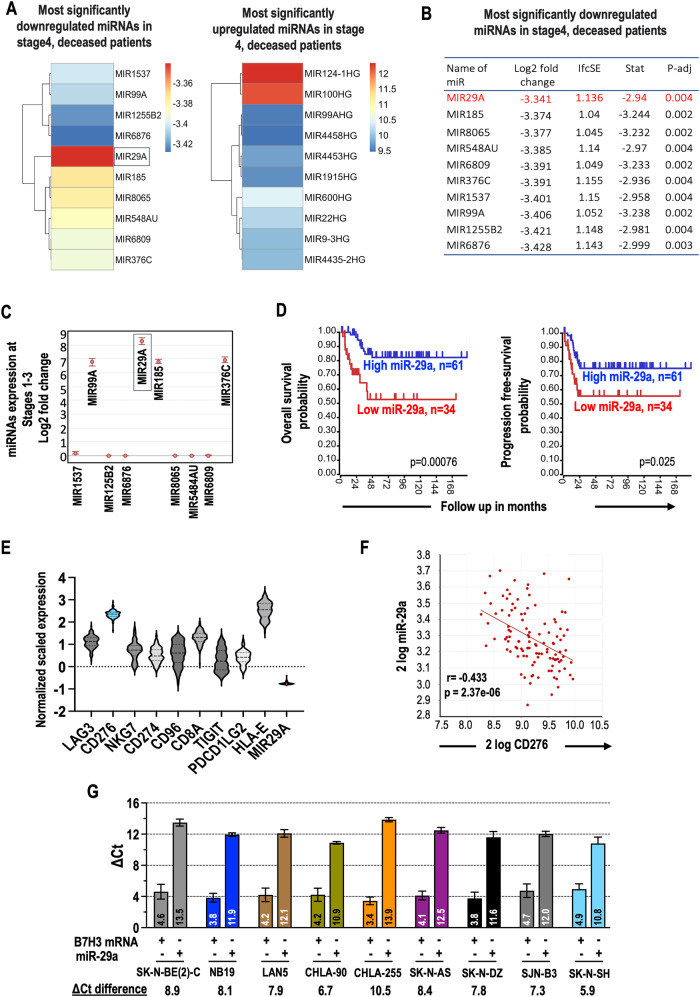
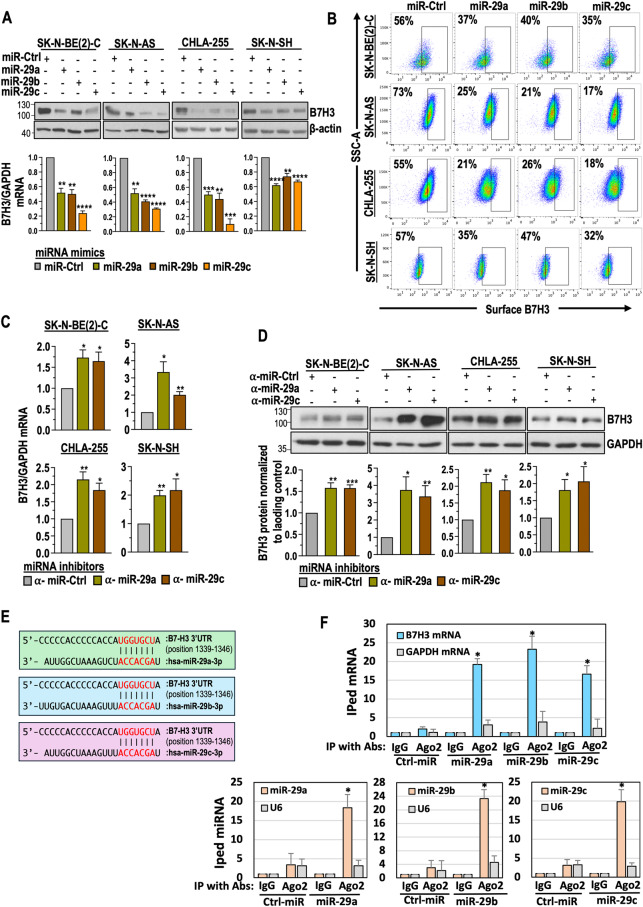
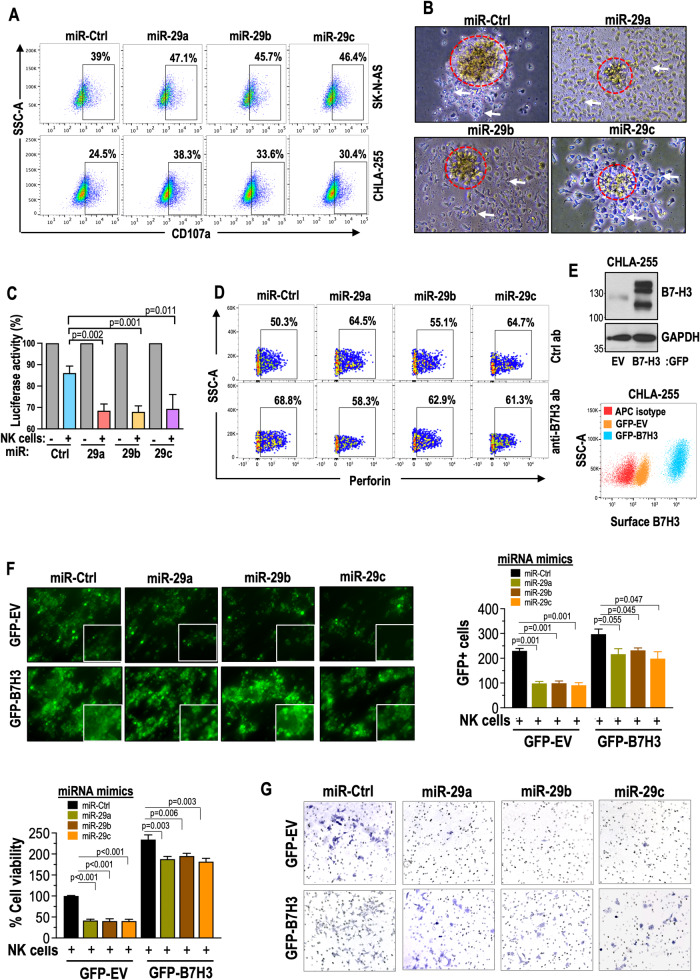
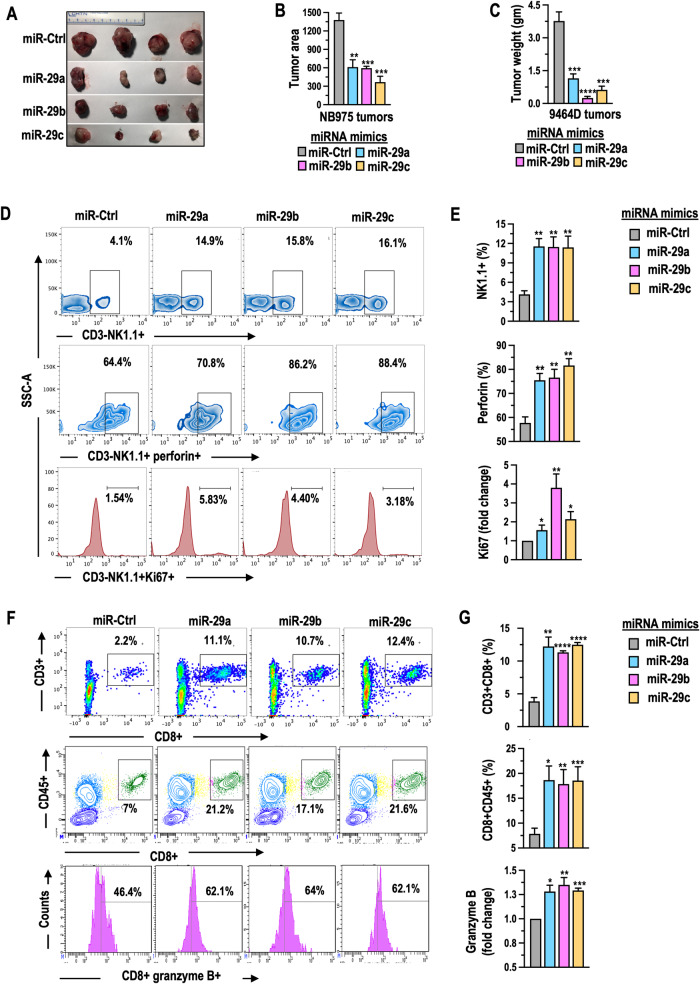
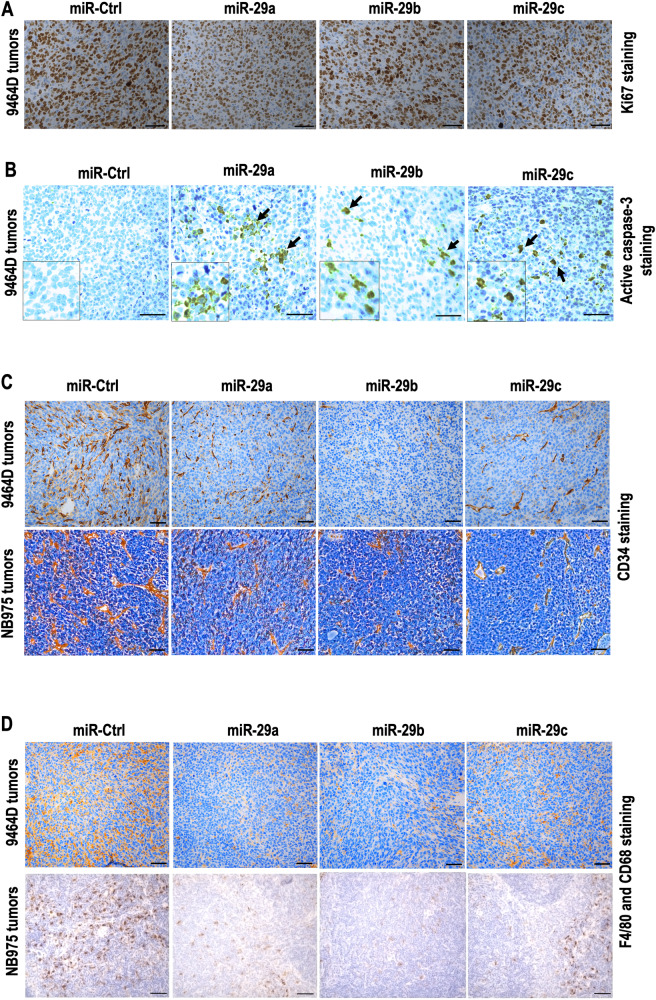
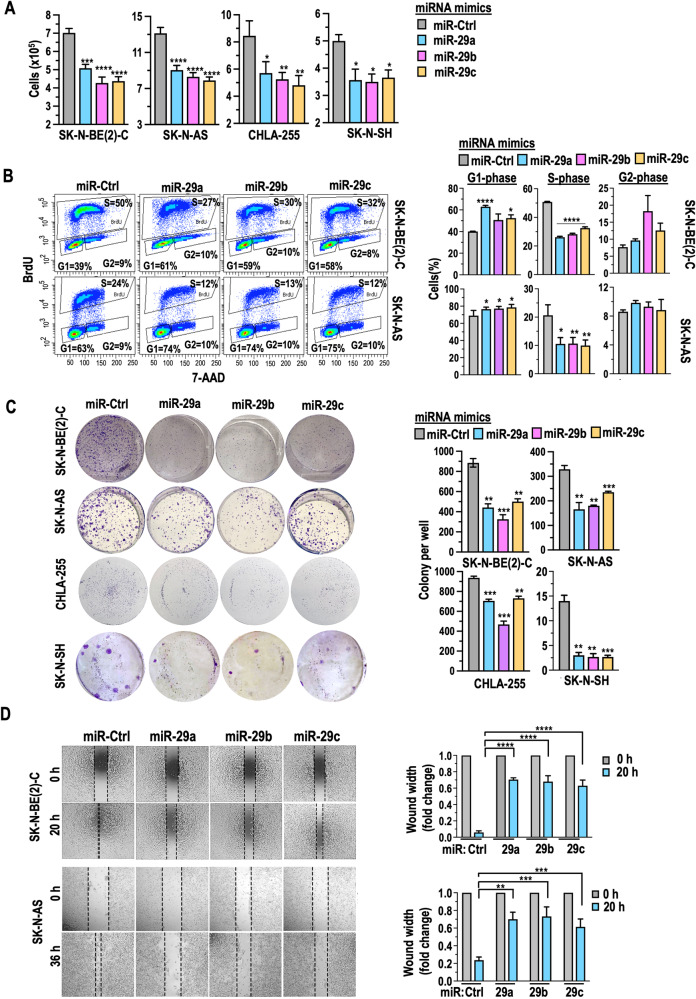
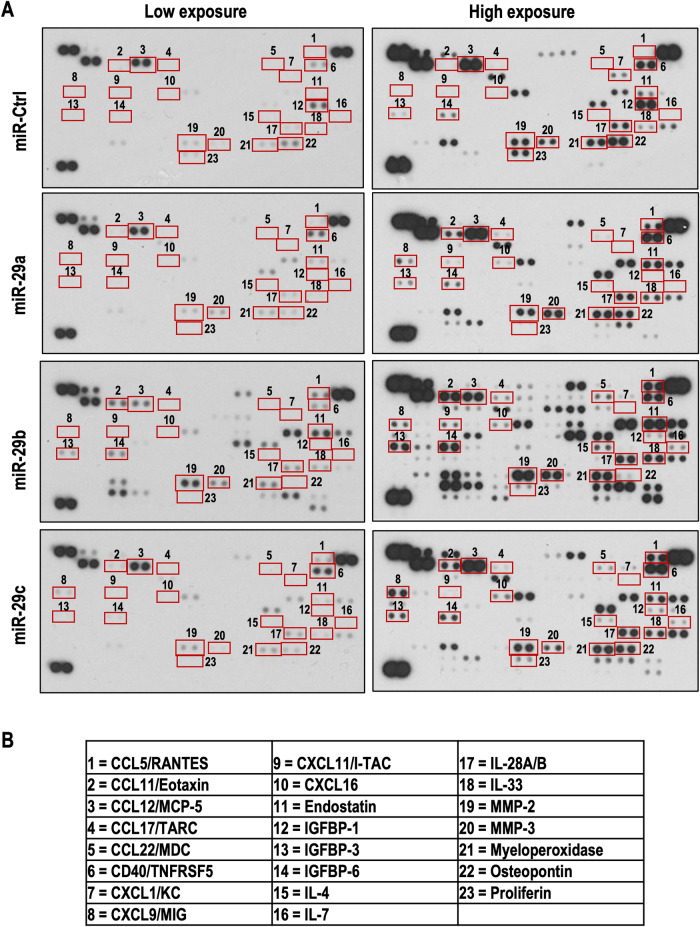
Neuroblastoma (NB) is a highly aggressive pediatric cancer that originates from immature nerve cells, presenting significant treatment challenges due to therapy resistance. Despite intensive treatment, approximately 50% of high-risk NB cases exhibit therapy resistance or experience relapse, resulting in poor outcomes often associated with tumor immune evasion. B7-H3 is an immune checkpoint protein known to inhibit immune responses. MicroRNAs (miRNAs) are small non-coding RNAs involved in post-transcriptional gene regulation. Our study aims to explore the impact of miRNAs on B7-H3 regulation, the anti-tumor immune response, and tumorigenicity in NB. Analysis of NB patients and patient-derived xenograft tumors revealed a correlation between higher B7-H3 expression and poorer patient survival. Notably, deceased patients exhibited a depletion of miR-29 family members (miR-29a, miR-29b, and miR-29c), which displayed an inverse association with B7-H3 expression in NB patients. Overexpression and knockdown experiments demonstrated that these miRNAs degrade B7-H3 mRNA, resulting in enhanced NK cell activation and cytotoxicity. In vivo, experiments provided further evidence that miR-29 family members reduce tumorigenicity, macrophage infiltration, and microvessel density, promote infiltration and activation of NK cells, and induce tumor cell apoptosis. These findings offer a rationale for developing more effective combination treatments that leverage miRNAs to target B7-H3 in NB patients.


Conflict of interest statement

The authors declare no competing interests.

Figures

Fig. 1
Fig. 1. Elevated B7-H3 expression is associated with high-risk, stage 4 disease progression, poor survival, and an increased likelihood of relapse in NB patients.
A The heatmap illustrates the differential co-expression of genes associated with NK-cell exhaustion and activation within the NB patient dataset (GSE62564, n = 498). The heatmap was generated using log-transformed and scaled expression values. B The Kaplan–Meier curves illustrate the association between different levels of B7-H3 expression and both overall survival (left) and relapse-free survival (right) in a cohort of GSE16476 (n = 88) dataset. Patients with elevated B7-H3 expression exhibited shorter survival outcomes. C The violin plot illustrates the expression of B7-H3 in NB patients from the TARGET (n = 151) dataset. D IHC images show B7-H3 staining in NB patient tumor samples (n = 27, A1-F4 in duplicates) and normal peripheral nerve tissue microarrays (n = 10, F5-G4 in duplicates). Scale bar: 2 mm. E The signal intensity of B7-H3 was further divided into higher, medium, and low and compared with normal peripheral nerve tissue samples. Scale bar: 100 µm. F The intensity of B7-H3 staining is quantified using an H-score system, and comparisons were made between NB patient samples and normal peripheral nerve tissue samples. *P < 0.0001, Mann–Whitney U-test. G IHC images of surface B7-H3 staining in two different PDX tumor samples from NB patients at the diagnosis and relapse stages. Magnified images were shown in the insets. Scale bar: 100 μm. The color intensity of B7-H3 staining was quantified and presented as optical density (OD) units. H Western blotting analysis of B7-H3 protein levels in whole lysates of two different PDX tumors from NB patients at the diagnosis and relapse stages.
Fig. 2
Fig. 2. High-risk NB patients tend to show decreased expression of miR-29a, miR-29b, and miR-29c, together with poor clinical outcome in NB patients.
A The heatmap displays miRs that are highly significant (adjusted p-value < 0.005) and are among the top-ranked upregulated and downregulated miRs in deceased patients from high-risk stage 4 NB patient cohorts. This analysis was conducted on the log-transformed TARGET dataset. B The log2fold change values of significant (adjusted p-value < 0.005), top-ranked, downregulated miRs in deceased patients from high-risk, stage 4 NB patient cohort (TARGET, n = 151). lfcSE = log 2-fold change standard error; stat = Wald statistic (larger absolute values of the stat indicate greater evidence of differential expression); padj = p adjusted values. C The log2-fold increase in the expression levels of miR-29a in low risk NB patients derived from the GSE155945 (n = 97) dataset. Notably, miR-29a showed higher expression levels in low or intermediate-risk stages compared to other miRs. D Kaplan–Meier curves display the association between varying levels of miR-29a and overall survival (left) and progression-free survival (right) in NB patients from the GSE155945 (n = 97) dataset. Patients with elevated miR-29a expression showed improved survival outcomes. E, F Graphs illustrate the inverse correlation between miR-29a and B7-H3 expression in NB patients, derived from the TARGET and Exp NB (TAE-684/shALK) - de Preter - 113 - RMA - u133p2 (n = 113) datasets. G The graph illustrates the physiological expression levels of B7-H3 mRNA and miR-29a in nine distinct NB cell lines. These results are presented as the mean ± standard error (SEM) and are derived from 3–4 independent biological experiments.
Fig. 3
Fig. 3. miR-29a, miR-29b, and miR-29c target B7-H3 in NB cells.
A Western blot (upper panel) analysis showing B7-H3 total protein levels in NB cells transfected with miR-29a, miR-29b, and miR-29c, or miR Ctrl mimics for 48 h. Quantification graph (lower panel) showing B7-H3 mRNA levels in NB cells transfected with miR-29a, miR-29b, and miR-29c, or miR Ctrl mimics for 48 h, measured using qRT-PCR. B Representative flow cytometric plots showing B7-H3 surface expression in SK-N-BE(2)-C, SK-N-AS, CHLA-255 and SK-N-SH cells transfected with miR-29a, miR-29b, and miR-29c, or miR Ctrl mimics for 48 h. RT-qPCR (C) and Western blot analysis (D) demonstrating B7-H3 mRNA and protein levels in NB cells transfected with inhibitors of miRNAs (labeled with a) such as a-miR-29a, a-miR-29c, and α-Scr Ctrl for 48 h. Densitometric quantification graph representing the relative B7-H3 protein levels normalized to the control group. E The sequence alignment shows the predicted binding sites between miR-29a, miR-29b, and miR-29c and 3’UTR of B7-H3 mRNA. Complementary sequences of B7-H3 mRNA and miRs are shown red. F A RT-qPCR quantification graph for Ago2-occupied B7-H3 mRNA (upper panel) and Ago2-occupied miR-29a, miR-29b, or miR-29c (lower panel) is shown. SK-N-BE(2) cells were transfected with miR-29a, miR-29b, miR-29c, or control miRs for 48 h followed by IP with an anti-Ago2 antibody. Ago2-bound RNA complexes were eluted, purified, and quantified for Ago2-bound mRNA and miRs by RT-qPCR using TaqMan assays. GAPDH mRNA and U6, a non-coding small nuclear RNA, were used as non-specific controls. The data were compared with the control IgG-bound mRNA or miR and set to one for normalization. Data are presented as mean ± standard error from three to four independent biological replicates. Statistical analysis was performed using a two-sided unpaired t-test. *p < 0.05, **p < 0.01, ***p < 0.001, and ****p < 0.0001.
Fig. 4
Fig. 4. miR-29a, miR-29b, and miR-29c enhance NK cell activation and NK-mediated cytotoxicity in NB cells.
A Representative flow cytometry plots illustrate the expression of CD107 in NK cells co-cultured (E:T = 1:2 for 5 h) with NB cells that were transfected with miR-29a, miR-29b, miR-29c, or miR Ctrl mimics for 48 h. The percentage of CD107 + NK cells is indicated in the plots. B Phase-contrast microscopy images of SK-N-B(E)2-C spheroids stably expressing miR-29a, miR-29b, and miR-29c, co-cultured (E:T = 2:1) with IL-15-treated NK cells for 48 h. The dotted circle represents cancer cell spheroids, whereas the white arrows indicate NK cells. C A quantification graph demonstrates normalized luciferase activity in SK-N-BE(2)-luciferase cells stably expressing miR-29a, miR-29b, and miR-29c upon co-culture (E:T = 1:1) with activated NK cells for 5 h. D Representative flow cytometry plots show the expression of perforin in NK cells co-cultured (E:T = 1:2 for 5 h) with NB cells pretreated with an anti-B7-H3 antibody (5 μg) for 24 h and transfected with miR-29a, miR-29b, miR-29c, or miR Ctrl mimics for an additional 24 h. The percentage of perforin+ NK cells is indicated in the plots. E Western blotting and flow cytometric expression of total and surface B7-H3 in CHLA-255 cells stably expressing GFP EV or GFP-B7-H3. F GFP-based digital fluorescence microscopy assay displaying GFP fluorescence in CHLA-255 cells, which stably express either GFP-B7H3 or a GFP-EV control. These cells were transfected with miR-29a, miR-29b, or miR-29c for 48 h and then co-cultured with activated NK cells (E:T = 1:2) for an additional 5 h. Quantification of GFP fluorescence is shown in the graphs on the right. After removing the NK cells, the CHLA-255 cells were allowed to grow for another 48 h before performing a cell viability assay. Live cells, identified as trypan blue negative, were manually counted, and the percentage of cell viability was calculated using GFP-EV cells as control (100%). G Transwell cell invasion assay images demonstrate the invasion ability of CHLA-255 cells stably expressing GFP-B7H3 or GFP-EV control, transfected with miR-29a, miR-29b, and miR-29c for 24–48 h. These cells were co-cultured (E:T = 1:2) with activated NK cells for an additional 5 h. After incubation, NK cells were removed from the medium, and NB cells were allowed to grow for an additional 24 h. The cells were counted, and 15,000 live cells were seeded into Corning Transwell polycarbonate membrane cell culture inserts coated with Matrigel for 72 h. The cells that migrated to the bottom chamber were stained using crystal violet and quantified. The data are presented as mean ± SEM from 3–5 independent experiments. P-values were determined using a two-sided unpaired t-test.
Fig. 5
Fig. 5. miR-29a, miR-29b, and miR-29c promote NK and T cell-mediated antitumor immune responses in NB xenografts.
Photographs displaying tumor images (A), graphs illustrating the quantification of average tumor area, tumor weight (B, C) in C57BL/6 mice that received subcutaneous injections of murine 9464D cells (n = 5) or NB-975 cells (n = 4) expressing GFP-miR-29a, miR-29b, miR-29c, or GFP-control (ctrl) miRs. D Representative flow cytometry plots showing NK cell infiltration and the expression of perforin and Ki67 in NK cells (CD3-NK1.1 + ) gated on CD45+ cells, as analyzed from single-cell suspensions of tumor tissues obtained from C57BL/6 mice that received a single injection of murine 9464D cells expressing GFP-miR-29a, miR-29b, miR-29c, or GFP-control (ctrl) miRs and were observed for 30 days. E Quantification graphs corresponding to (D). F Representative flow cytometry plots demonstrating CD8 + T cell infiltration and the expression of granzyme in CD8+ cells (CD3 + CD8 + ) gated on CD45+ cells, as analyzed from single-cell suspensions of tumor tissues obtained from C57BL/6 mice that received a single injection of murine 9464D (upper panel) or NB975 (lower panels) cells expressing GFP-miR-29a, miR-29b, miR-29c, or GFP-control (ctrl) miRs and were observed for 30 days. G Quantification graphs corresponding to (F).
Fig. 6
Fig. 6. miR-29a, miR-29b, and miR-29c inhibit tumor proliferation, microvessel density and macrophage infiltration in vivo.
Representative IHC images depict the expression of (A) Ki67, a marker of proliferation, (B) cleaved caspase-3, a marker of apoptosis, (C) murine endothelial cell marker CD34, indicating microvessel density and (D) F4/80 and CD68, indicating tumor-associated macrophage infiltration in tumors derived from mice subcutaneously injected with 9464D ((A, B) and upper panels of (C, D)) and NB975 ((C, D)—lower panels) cells stably expressing miR-29a, miR-29b, miR-29c, or miR-Ctrl (scale bar = 50 μm).
Fig. 7
Fig. 7. miR-29a, miR-29b, and miR-29c inhibit cell growth, proliferation, colony formation, and migration in NB cells.
A A quantification graph illustrating cell number, indicating the percentage of viable cells, (B) representative flow cytometry plots illustrating the percentage of BrdU-positive cells, indicating cells in the S-phase of the cell cycle, and 7AAD-positive cells indicating cells in G1 and G2 phases, along with a quantification graph displaying the percentage of cells in each phase, (C) colony formation images depicting the formation of colonies and quantification graphs accompany the images, showing the number of colonies per well, and (D) representative images of wound healing assays demonstrate the closure of a wound over time and quantification graphs accompany the images, illustrating the width of the wound, in NB cells transfected with miR-29a, miR-29b, miR-29c, or a miR-Ctrl for a duration of 48 h. Data points represent the mean ± SEM from three biological replicates. P-values were calculated using two-tailed unpaired t-tests to compare the different experimental groups.
Fig. 8
Fig. 8. The expression profile of cytokines, chemokines, and growth factors.
A The expression of cytokines, chemokines, and growth factors was analyzed in tumors from C57BL/6 mice that had received subcutaneous injections of 9464D cells stably expressing miR-Ctrl, miR-29a, miR-29b, and miR-29c. B The name of cytokines, chemokines, and growth factors were given.

Similar articles

Cited by

References

    1. Siegel RL, Miller KD, Fuchs HE, Jemal A. Cancer statistics, 2021. CA Cancer J Clin. 2021;71:7–33. doi: 10.3322/caac.21654. - DOI - PubMed
    1. Mueller S, Matthay KK. Neuroblastoma: biology and staging. Curr Oncol Rep. 2009;11:431–8. doi: 10.1007/s11912-009-0059-6. - DOI - PubMed
    1. London WB, Castel V, Monclair T, Ambros PF, Pearson AD, Cohn SL, et al. Clinical and biologic features predictive of survival after relapse of neuroblastoma: a report from the International Neuroblastoma Risk Group project. J Clin Oncol. 2011;29:3286–92. doi: 10.1200/JCO.2010.34.3392. - DOI - PMC - PubMed
    1. Smith MA, Seibel NL, Altekruse SF, Ries LA, Melbert DL, O’Leary M, et al. Outcomes for children and adolescents with cancer: challenges for the twenty-first century. J Clin Oncol. 2010;28:2625–34. doi: 10.1200/JCO.2009.27.0421. - DOI - PMC - PubMed
    1. Spix C, Pastore G, Sankila R, Stiller CA, Steliarova-Foucher E. Neuroblastoma incidence and survival in European children (1978–1997): report from the Automated Childhood Cancer Information System project. Eur J Cancer. 2006;42:2081–91. doi: 10.1016/j.ejca.2006.05.008. - DOI - PubMed

Publication types