. 2024 Jun 18;15(1):5201.
doi: 10.1038/s41467-024-49493-6.

Chemogenomics for NR1 nuclear hormone receptors

Affiliations

Chemogenomics for NR1 nuclear hormone receptors

Laura Isigkeit et al. Nat Commun. .

Abstract

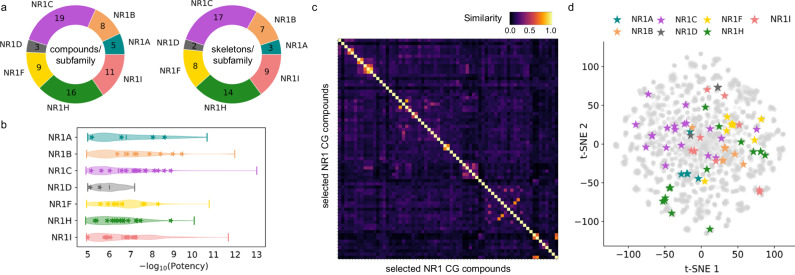
Nuclear receptors (NRs) regulate transcription in response to ligand binding and NR modulation allows pharmacological control of gene expression. Although some NRs are relevant as drug targets, the NR1 family, which comprises 19 NRs binding to hormones, vitamins, and lipid metabolites, has only been partially explored from a translational perspective. To enable systematic target identification and validation for this protein family in phenotypic settings, we present an NR1 chemogenomic (CG) compound set optimized for complementary activity/selectivity profiles and chemical diversity. Based on broad profiling of candidates for specificity, toxicity, and off-target liabilities, sixty-nine comprehensively annotated NR1 agonists, antagonists and inverse agonists covering all members of the NR1 family and meeting potency and selectivity standards are included in the final NR1 CG set. Proof-of-concept application of this set reveals effects of NR1 members in autophagy, neuroinflammation and cancer cell death, and confirms the suitability of the set for target identification and validation.


Conflict of interest statement

The authors declare no competing interests.

Figures

Fig. 1
Fig. 1. Structure and function of NR1 receptors.
a Phylogenetic tree of the NR family comprising 48 members in humans. NR1 family in red. b The archetypal domain structure of NRs is composed of an unordered N-terminal domain (NTD), containing the ligand-independent activation function 1 (AF-1), a DNA binding domain (DBD) comprising two zinc finger motifs, a flexible hinge region, and a ligand binding domain (LBD) with the ligand-dependent activation function AF-2. c Molecular mechanism of NR activity. The example shows the full-length PPARγ-RXRα heterodimer (pdb id: 3dzy, colors corresponding to modular domain structure in (b)) bound to DNA (gray). In their inactive conformation, in the absence of a ligand, NRs bind co-repressors (dark purple), resulting in repression of gene expression. Agonist binding (blue) induces the active conformation, leading to co-repressor displacement and co-activator (cyan, pdb id: 2fvj for co-activator placement) recruitment to activate gene expression. d NR modulation by different types of ligands involves different conformational changes in the NR LBD affecting the position of the AF-2 (red): agonists stabilize an active conformation with AF-2 bound to the LBD core (PPARγ with bound agonist rosiglitazone; pdb id: 7awc); partial agonists cause weaker stabilization with potentially shifted AF-2 (PPARγ with bound partial agonist AL26-29; pdb id: 5hzc); antagonists prevent agonist binding and do not stabilize the active conformation (PPARγ with bound antagonist SR11023; pdb id: 6c5t); inverse agonists block the constitutive activity of NRs like RORs by stabilizing the inactive state (RORγ with bound inverse agonist; pdb id: 6slz). Structural and molecular mechanisms of NR modulation have been reviewed in,,. e Some NRs like NR1D act primarily as transcriptional repressors and recruit co-repressors (revERBα with agonist and co-repressor NCoR1 in purple; pdb id: 8d8i).
Fig. 2
Fig. 2. Toxicity and off-target liability profiling of the NR1 CG set.
a CG compound candidate (10 µM) profiling for cytotoxic (GR < 0.5) or phenotypic effects on three cell lines (HEK293T, U-2 OS and MRC-9) after 24 h incubation; n = 2. b CG compound candidate (20 µM) profiling for off-target binding in a liability target screening by differential scanning fluorimetry. Proteins were used at 2 µM; staurosporine (ABL1, AURKA, CDK2, FGFR3 and GSK3B), (+)-JQ1 (BRD4), GSK6853 (BRPF1), PK016714a (CSNK1D), GDC-0994 (MAPK1) and IACS-9571 (TRIM24) served as positive controls (pos. ctrl) at a concentration of 20 µM. The heatmap shows the mean ΔTm calculated by the Boltzmann fit; n = 2.
Fig. 3
Fig. 3. Selectivity screening of the NR1 CG set.
a In-family selectivity profiles of NR1 CG compounds at the recommended concentrations (cf. Figure 4). The heatmap shows NR mediated activation (red; agonists) and inhibition of reporter gene expression (blue; antagonists and inverse agonists), expressed as mean log10 fold reporter activity. Since revERBs (NR1D) act as transcriptional repressors, inverse agonists cause activation and agonists cause inhibition of gene expression; all activities within a compound’s target subfamily were determined in uniform hybrid reporter gene assays; n = 3; activities outside the subfamilies reported in literature (retinoic acid, GW7647, SR9009, LXR-623) were checked and only confirmed for retinoic acid (NR1F) and LXR-623 (NR1I) at the recommended concentrations (cf. Figure 4). b Effects of NR1 CG compounds on RXRα activity (NR2B1). Heatmap shows the mean relative RXR activation by the CG compounds at the recommended concentrations compared to reference agonist bexarotene (1 µM); n = 3. c Effects of the NR1 CG compounds on the ligand-independent transcriptional inducer Gal4-VP16, to capture non-specific effects on transcriptional activity. The heatmap shows the significance level of effects on the main NR1 target vs. effects on VP16 activity (n.s. – not significant (p ≥ 0.05), * p < 0.05, ** p < 0.01, *** p < 0.001; two-sided t-test); n = 3. d Selectivity profiling of NR1 CG compounds at the recommended concentrations on representative NRs outside the NR1 family. The heatmap shows NR mediated activation (red; agonists) and inhibition of reporter gene expression (blue; antagonists and inverse agonists), expressed as mean reporter activity relative to DMSO control. Since TR2 (NR2C1) and TLX (NR2E1) act as transcriptional repressors, inverse agonists cause activation and agonists cause inhibition of reporter gene expression. HNF4α (NR2A1), Nur77 (NR4A1) and SF1 (NR5A1) exhibit constitutive activity. Activities were determined in uniform hybrid reporter gene assays; n = 3.
Fig. 4
Fig. 4. Final set of 69 NR1 CG compounds.
Main targets, potency, activity type, relevant NR off-targets and recommended concentrations of the final 69 NR1 CG compounds. p(Potency) values refer to the pEC50 for agonists and to pIC50 for antagonists/inverse agonists. Colors denote different NR1 subfamilies and match with the colors in Fig. 5. a ML-209 is recommended for CG at two different concentrations: 1 µM is selective for NR1F3 (RORγ); 10 µM inhibits both NR1F2 (RORβ) and NR1F3 (RORγ) and has weak inhibitory effects on NR1F1 (RORα; NR off-target).
Fig. 5
Fig. 5. Structures of the final set of NR1 CG compounds.
Shown are the structures of the selected CG compounds as well as the most commonly used names in the literature. Colors denote different NR1 subfamilies and match with the colors in Fig. 4.
Fig. 6
Fig. 6. Feature analysis of the NR1 CG compounds.
a Pie charts of the number of compounds per subfamily and the number of diverse skeletons per subfamily. b Potency distribution of the CG compounds is shown as the negative decadic logarithm of potency. Violin plots represent the potency distribution of all known ligands of the respective subfamily (≤ 100 µM from dataset) and stars represent the selected CG compounds. c Pairwise Jaccard-Tanimoto similarity heatmap of the selected NR1 CG compounds computed on Morgan fingerprints. d t-SNE plot of known NR1 ligands (gray, ≤ 100 µM from dataset) with the selected NR1 CG compounds highlighted and colored by their NR target subfamilies.
Fig. 7
Fig. 7. Applications of the NR1 CG set to target identification in vitro.
(a) Effects of the NR1 CG set on NFκB activity in astrocytes (T98G). The heatmap shows mean NF-κB activity compared to DMSO (0.1%) treated cells; n = 4. (b) Effects of the NR1 CG set on autophagic flux over time (hours after treatment) in RPE1 GFP-LC3-RPF-LC3∆G cells. The heatmap shows the mean normalized green/red fluorescence ratio compared to DMSO (0.1%) treated cells; n = 3. A lower green/red fluorescence ratio indicates increased autophagic flux. (c) Induction of cell death by the NR1 CG set in A549, T98G and HT29 cells expressed as necrotic cell counts (=ROC, red fluorescent dye detecting permeable cell membranes) per total cell counts (=BOC, blue fluorescent dye detecting cell nuclei). The heatmap shows the red/blue object count ratio normalized to DMSO (0.1%) treated cells; n = 3.

Similar articles

Cited by

References

    1. Jones LH, Bunnage ME. Applications of chemogenomic library screening in drug discovery. Nat. Rev. Drug Discov. 2017;16:285–296. doi: 10.1038/nrd.2016.244. - DOI - PubMed
    1. Bredel M, Jacoby E. Chemogenomics: an emerging strategy for rapid target and drug discovery. Nat. Rev. Genet. 2004;5:262–275. doi: 10.1038/nrg1317. - DOI - PubMed
    1. Müller, S. et al. Donated chemical probes for open science. Elife7, e34311 (2018). - PMC - PubMed
    1. Müller S, et al. Target 2035 – update on the quest for a probe for every protein. RSC Med Chem. 2022;13:13–21. doi: 10.1039/D1MD00228G. - DOI - PMC - PubMed
    1. Wells CI, et al. The kinase chemogenomic set (KCGS): an open science resource for kinase vulnerability identification. Int J. Mol. Sci. 2021;22:1–18. doi: 10.3390/ijms22020566. - DOI - PMC - PubMed