. 2024 Jun 18;15(1):5199.
doi: 10.1038/s41467-024-49597-z.

Augmented microglial endoplasmic reticulum-mitochondria contacts mediate depression-like behavior in mice induced by chronic social defeat stress

Affiliations

Augmented microglial endoplasmic reticulum-mitochondria contacts mediate depression-like behavior in mice induced by chronic social defeat stress

Jia-Rui Zhang et al. Nat Commun. .

Abstract

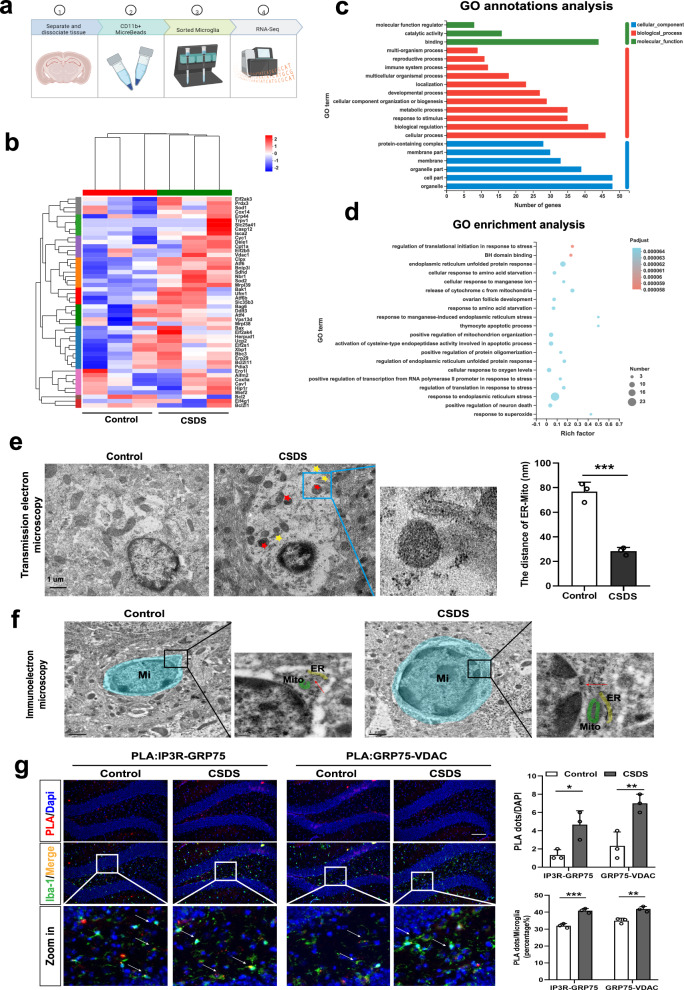
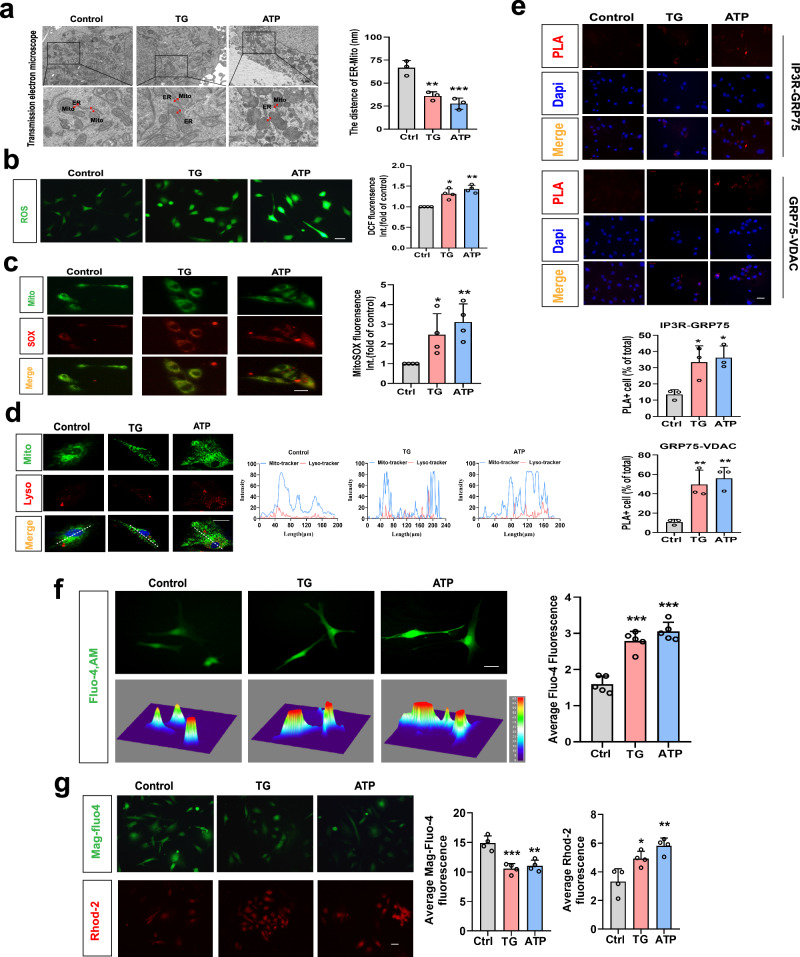
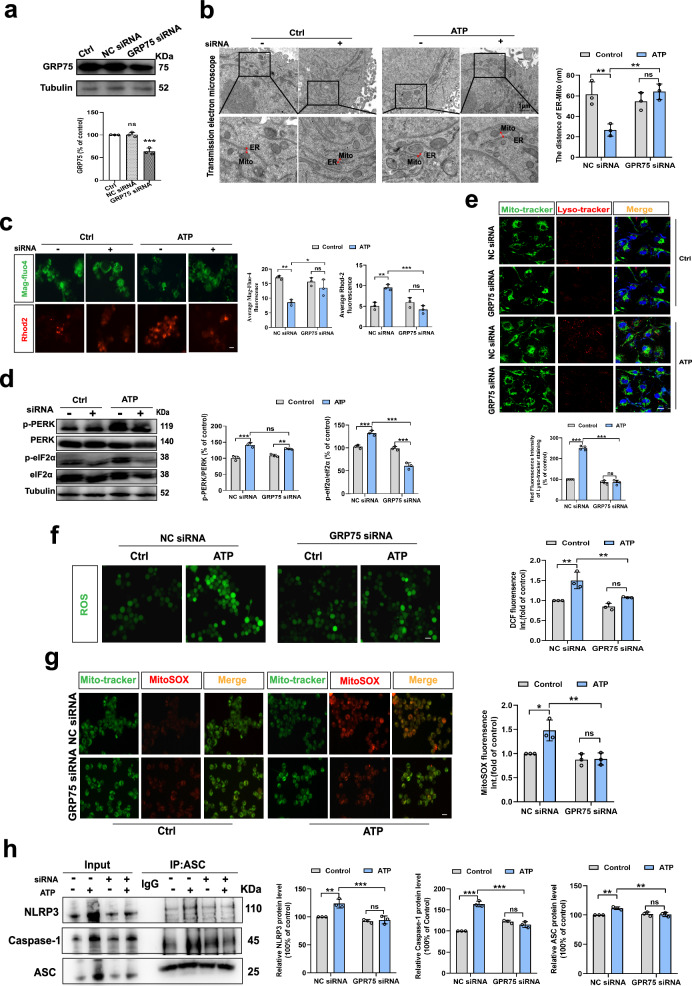
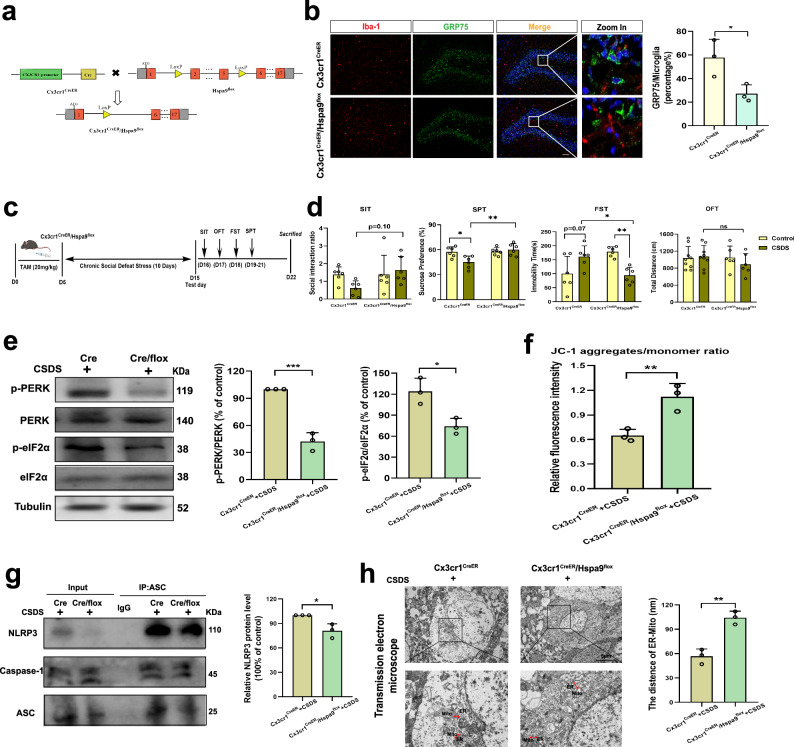
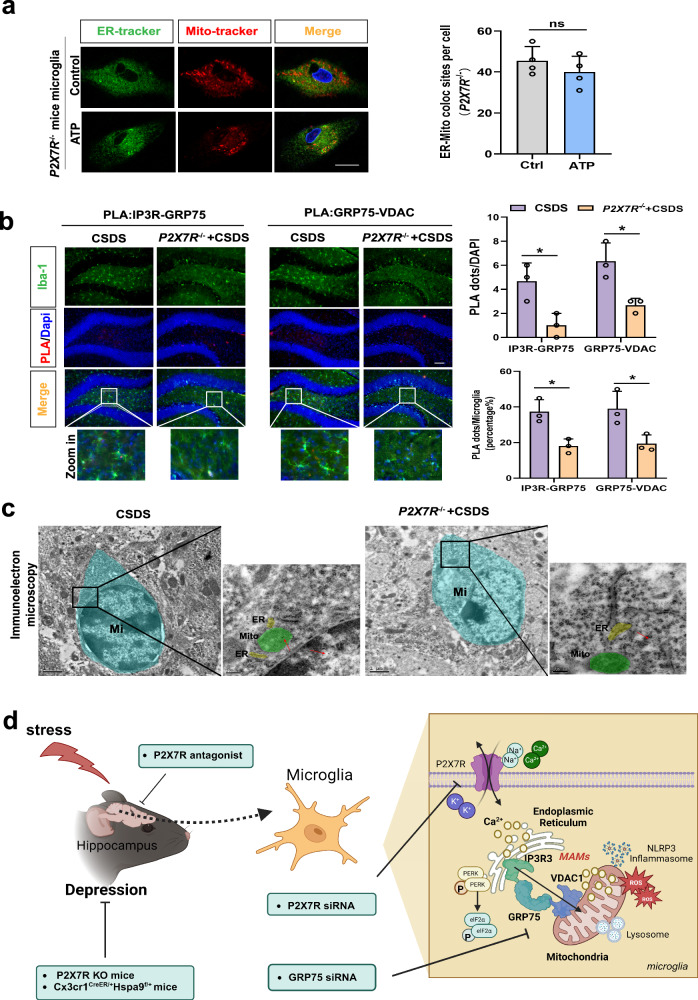
Extracellular ATP (eATP) signaling through the P2X7 receptor pathway is widely believed to trigger NLRP3 inflammasome assembly in microglia, potentially contributing to depression. However, the cellular stress responses of microglia to both eATP and stress itself remain largely unexplored. Mitochondria-associated membranes (MAMs) is a platform facilitating calcium transport between the endoplasmic reticulum (ER) and mitochondria, regulating ER stress responses and mitochondrial homeostasis. This study aims to investigate how MAMs influence microglial reaction and their involvement in the development of depression-like symptoms in response to chronic social defeat stress (CSDS). CSDS induced ER stress, MAMs' modifications, mitochondrial damage, and the formation of the IP3R3-GRP75-VDAC1 complex at the ER-mitochondria interface in hippocampal microglia, all concomitant with depression-like behaviors. Additionally, exposing microglia to eATP to mimic CSDS conditions resulted in analogous outcomes. Furthermore, knocking down GRP75 in BV2 cells impeded ER-mitochondria contact, calcium transfer, ER stress, mitochondrial damage, mitochondrial superoxide production, and NLRP3 inflammasome aggregation induced by eATP. In addition, reduced GRP75 expression in microglia of Cx3cr1CreER/+Hspa9f/+ mice lead to reduce depressive behaviors, decreased NLRP3 inflammasome aggregation, and fewer ER-mitochondria contacts in hippocampal microglia during CSDS. Here, we show the role of MAMs, particularly the formation of a tripartite complex involving IP3R3, GRP75, and VDAC1 within MAMs, in facilitating communication between the ER and mitochondria in microglia, thereby contributing to the development of depression-like phenotypes in male mice.


Conflict of interest statement

The authors declare no competing interests.

Figures

Fig. 1
Fig. 1. Chronic stress induces ER stress, structural and functional changes in MAMs, and mitochondrial damage in hippocampal microglia.
a Flow chart for isolating microglia via CD11b+ magnetic beads from adult mouse hippocampus and subsequent RNA-Sequencing of microglia. Figure 1a was created with BioRender.com released under a Creative Commons Attribution-Non Commercial-No Derivs 4.0 International license. b Heatmap showing the different expressed genes in microglia isolated from hippocampus of the Control (n = 15) and chronic social defeat stress (CSDS) mice (n = 15), as determined by RNA-seq data. Ten hippocampi from 5 mice were combined to one sample. c, d Gene Ontology (GO) annotations and enrichment of the DEGs between Control and CSDS. Using Fisher’s exact test, when the corrected P value (Padjust) is less than 0.05, it is considered that there is a significant enrichment of this GO function. e Representative Transmission Electronic Microscope (TEM) images (left panel) and quantitative analysis of the distance between mitochondria and ER (right panel) of microglia in the hippocampus of control group and CSDS group mice. Scale bar: 1.0 μm; Student’s t test (P = 0.0006). Data are expressed as mean ± SEM (n =  3 per group). ***p < 0.001. f Immunoelectron microscope images with higher magnification of the inset showing the intimate proximity between mitochondria (M) and ER in a gold labeled microglia (Mi) (Red arrow: dense black dots) located in the hippocampal DG from Control and CSDS mice. g Representative images of PLA targeting IP3R3-GRP75 or GRP75-VDAC1 interactions in the hippocampal DG (left panel) and Quantification of the PLA red fluorescent dots (Top line, Interaction, F (1, 8) = 0.8889, P = 0.3734) and the percentage of PLA dots in microglia (Bottom line, Interaction, F (1, 8) = 1.575, P = 0.2449) were performed using Image J (right panel). Scale bar: 20 μm; Microglia (Iba-1, green), Nuclei (DAPI, blue). Two-way ANOVA with Sidak’s multiple comparisons test. Data are expressed as mean ± SEM (n = 3 mouse brain slices). *p < 0.05, **p < 0.01, ***p < 0.001. Source data are provided as a Source Data file.
Fig. 2
Fig. 2. Extracellular ATP (eATP) leads to ER stress, alterations in MAMs, and mitochondria damage in microglia.
a Representative TEM images of ER-mitochondria contact in primary microglia untreated (Ctrl) or treated with Thapsigargin (TG) or Adenosine Triphosphate (ATP, left panel) and the quantitative analysis of the distance between mitochondria and the ER (right panel, n = 3 mitochondria in 3 fields per condition; P = 0.0020, P = 0.0006). Scale bar: 1 μm. b Representative photographs of DCF fluorescence in the experimental groups (left panel) and Relative DCF fluorescence was quantitatively analyzed (right panel, n = 4 per condition; P = 0.0012, P = 0.0001). Scale bar: 20 μm. c Representative images of MitoSOX (red) and Mito-tracker (green) fluorescence in primary microglia (left panel). Relative MitoSOX fluorescence was quantitatively analyzed (right panel, n = 4 per condition; P = 0.0159, P = 0.0050). Scale bar: 20 μm. d Representative confocal images (left panel) and the fluorescence intensity at the line of the arrow in left images (right panel) of intracellular localization of lysosome (Lyso-Tracker, red), mitochondria (Mito-Tracker, green) and nucleus (Hoechst, blue). Scale bar: 20 μm. e Representative images of proximity ligation assay (PLA) targeting IP3R3-GRP75 or GRP75-VDAC1 interactions (above panel) and quantification of the PLA red fluorescent dots in microglia (below panel, n = 3 batches of primary microglia; P = 0.0283, P = 0.0164; P = 0.0090, P = 0.0042). Scale bar: 20 μm. f Representative fluorescence images, 3D thermograms (left panel) and quantitative analysis (right panel, n = 5 per condition; P < 0.0001, P < 0.0001) of Fluo-4 in microglia. Scale bar: 20 μm. g Representative fluorescence images (left panel) and quantitative analysis (right panel, n = 4 per condition; P = 0.0005; P = 0.0012) of Mag-Fluo-4 and Rhod-2 in microglia. Scale bar: 20 μm. One-way ANOVA with Dunnett’s multiple comparisons test. Data are expressed as mean ± SEM *p < 0.05, **p < 0.01, ***p < 0.001, vs. Ctrl. Source data are provided as a Source Data file.
Fig. 3
Fig. 3. IP3R3-GRP75-VDAC1 complex participates in the changes in MAMs structure and function induced by eATP.
a Western blot analysis of GRP75 proteins expression in BV2 cells subjected to transfection of GRP75 siRNA or negative control (NC) siRNA (n = 3 batches of transfected cell samples; P = 0.9897; P = 0.0003). b Representative TEM images of ER-mitochondria contact (left panel) and the quantitative analysis of the distance (right panel, n = 3 mitochondria in 3 fields per condition; Interaction, F (1, 8) = 19.14, P = 0.0024). Scale bar: 1 μm. c Representative fluorescence images (left panel) and quantitative analysis (right panel, n = 3 per condition; Interaction, F (1, 8) = 11.11, P = 0.0103; Interaction, F (1, 8) = 33.60, P = 0.0004) of Mag-Fluo-4 and Rhod-2 in BV2 cells. Scale bar: 20 μm. d Western blot analysis of PERK and elf2α phosphorylation proteins (n = 3 batches of transfected cell samples; Interaction, F (1, 8) = 10.79, P = 0.0111; Interaction, F (1, 8) = 124.7, P < 0.0001). e Representative confocal images (above panel) of the intracellular localization of lysosome (Lyso-Tracker, red), mitochondria (Mito-Tracker, green) and nucleus (Hoechst, blue) in BV2 cells and the statistical analysis (below panel, n = 4; Interaction, F (1, 8) = 77.58, P < 0.0001) of the fluorescence intensity. Scale bar: 20 μm. f Representative photographs of DCF fluorescence (left panel) and Relative DCF fluorescence was quantitatively analyzed (right panel, n = 3; Interaction, F (1, 8) = 4.353, P = 0.0704). Scale bar: 20 μm. g Representative images of MitoSOX (red) and Mito-tracker (green) fluorescence in BV2 cells (left panel). And relative MitoSOX fluorescence was quantitatively analyzed (right panel, Interaction, F (1, 8) = 8.536, P = 0.0192). Scale bar: 20 μm. h Representative blots of co-immunoprecipitation (IP, left panel) and quantification of the NLRP3, Caspase-1 and ASC protein changes (n = 3 batches of transfected cell samples; Interaction, F (1, 8) = 11.48, P = 0.0095; Interaction, F (1, 8) = 140.9, P < 0.0001; Interaction, F (1, 8) = 14.41, P = 0.0053). One-way or Two-way ANOVA with Tukey’s multiple comparisons test. Data are expressed as mean ± SEM. ns, p > 0.05, *p < 0.05, **p < 0.01, ***p < 0.001. Source data are provided as a Source Data file.
Fig. 4
Fig. 4. Conditional knockdown of GRP75 in hippocampal microglia attenuates CSDS-induced depression-like behaviors.
a Traditional Cre-loxP method for generating GRP75 (Hspa9) gene deficient mouse models in microglia. Breeding scheme of the Cx3cr1CreER/+ mice crossed with Hspa9f/+. b Representative immunofluorescent images (left panel) and percentage of positive microglia (right panel, n = 3; P = 0.0378) of GRP75 in Iba-1 cells in hippocampal DG from Cx3cr1CreER/+ and Cx3cr1CreER/+/Hspa9f/+ mice. GRP75 (green), Iba-1 (red), DAPI (blue). Scale bar: 20 μm. c Experimental timeline of tamoxifen (TAM) injection, CSDS, and behavioral testing. Figure 4c was created with BioRender.com released under a Creative Commons Attribution-Non Commercial-No Derivs 4.0 International license. d Behavioral tests including Social Interaction Test (SIT, Interaction, F (1, 20) = 2.986, P = 0.0994), sucrose preference test (SPT, Interaction, F (1, 20) = 8.064, P = 0.0101), forced swim test (FST, Interaction, F (1, 20) = 19.58, P = 0.0003), and open-field test (OFT, Interaction, F (1, 20) = 0.9916, P = 0.3285) were performed (n = 6 in each group). e Western blot analysis of PERK and elf2α phosphorylation proteins from Cx3cr1CreER/+ mice or Cx3cr1CreER/+/Hspa9f/+ mice treated with CSDS (n = 3 mouse tissue samples; P = 0.0005; P = 0.0167). f Ratios of JC-1 aggregates to JC-1 monomer in two groups (n = 3 mouse tissue samples; P = 0.0099). g Representative blots of CO-IP (left panel) and quantification of the protein changes of NLRP3 in two groups (n = 3 mouse tissue samples; P = 0.0183). h Ultrastructural analysis of ER-mitochondria contact in two groups. Representative TEM images of ER-mitochondria contact (left panel) and the quantitative analysis of the distance between mitochondria and the ER (right panel, n = 3 mitochondria in 3 fields per condition; P = 0.0024). Scale bar: 5 μm. Student’s t test or Two-way ANOVA with Tukey’s multiple comparisons test. Data are expressed as mean ± SEM. ns, p > 0.05, *p < 0.05, **p < 0.01, ***p < 0.001. Source data are provided as a Source Data file.
Fig. 5
Fig. 5. P2X7 Receptors mediate CSDS-induced alterations in MAMs within hippocampal microglia.
a Representative confocal images of primary microglia untreated (Control) or treated with ATP (1 mM) from P2X7R−/− mice stained for nuclei (Hoechst 33342, blue), endoplasmic reticulum (ER-Tracker, green), and mitochondria (Mito-Tracker, red, left panel) and quantification of the colocalization between ER and mitochondria (right panel). Scale bar: 20 μm; Student’s t test (P = 0.3313). Data are expressed as mean ± SEM (n = 4 batches of mouse extracted cell samples). ns, p > 0.05. b Representative images of PLA targeting IP3R3-GRP75 or GRP75-VDAC1 interactions in the hippocampal DG (left panel) and Quantification of the PLA red fluorescent dots (Top line, Interaction, F (1, 8) = 0.000, P > 0.9999) and the percentage of PLA dots in microglia (Bottom line, Interaction, F (1, 8) = 0.001815, P = 0.9671) were performed using Image J (right panel). Scale bar: 20 μm; Microglia (Iba-1, green), Nuclei (DAPI, blue). Two-way ANOVA with Sidak’s multiple comparisons test. Data are expressed as mean ± SEM (n = 3 mouse brain slices). *p < 0.05. c Immunoelectron microscope images with higher magnification of the inset showing the intimate proximity between mitochondria (M) and ER in a gold labeled microglia (Mi) (Red arrow: dense black dots) located in the hippocampal DG from CSDS and P2X7R−/− mice with CSDS. Source data are provided as a Source Data file. d Schematic diagram of the involvement of mitochondria-associated membranes (MAMs) in mediating extracellular ATP (eATP)/P2X7R-induced microglial responses and chronic social defeat stress (CSDS)-induced depression-like behaviors. CSDS induces ER stress, structural and functional alterations in MAMs, and mitochondrial impairment in hippocampal microglia. Reduced GRP75 expression in microglia of Cx3cr1CreER/+Hspa9f/+ mice or knockout P2X7 in P2X7R-/- mice results in decreased depressive behaviors, reduced NLRP3 inflammasome aggregation, and fewer ER-mitochondria contacts in hippocampal microglia during CSDS. Figure 5d was created with BioRender.com released under a Creative Commons Attribution-Non-Commercial-No Derivs 4.0 International license.

References

    1. McIntyre RS, et al. Bipolar disorders. Lancet. 2020;396:1841–1856. doi: 10.1016/S0140-6736(20)31544-0. - DOI - PubMed
    1. Nemeroff CB. The state of our understanding of the pathophysiology and optimal treatment of depression: glass half full or half empty? Am. J. Psychiatry. 2020;177:671–685. doi: 10.1176/appi.ajp.2020.20060845. - DOI - PubMed
    1. Wilson MA, Grillo CA, Fadel JR, Reagan LP. Stress as a one-armed bandit: differential effects of stress paradigms on the morphology, neurochemistry and behavior in the rodent amygdala. Neurobiol. Stress. 2015;1:195–208. doi: 10.1016/j.ynstr.2015.06.001. - DOI - PMC - PubMed
    1. Iwata M, et al. Psychological stress activates the inflammasome via release of adenosine triphosphate and stimulation of the purinergic type 2X7 receptor. Biol. Psychiatry. 2016;80:12–22. doi: 10.1016/j.biopsych.2015.11.026. - DOI - PubMed
    1. Yue N, et al. Activation of P2X7 receptor and NLRP3 inflammasome assembly in hippocampal glial cells mediates chronic stress-induced depressive-like behaviors. J. Neuroinflamm. 2017;14:102. doi: 10.1186/s12974-017-0865-y. - DOI - PMC - PubMed

MeSH terms