. 2024 Jun 18;15(1):5217.
doi: 10.1038/s41467-024-49589-z.

Protein restriction slows the development and progression of pathology in a mouse model of Alzheimer's disease

Affiliations

Protein restriction slows the development and progression of pathology in a mouse model of Alzheimer's disease

Reji Babygirija et al. Nat Commun. .

Abstract

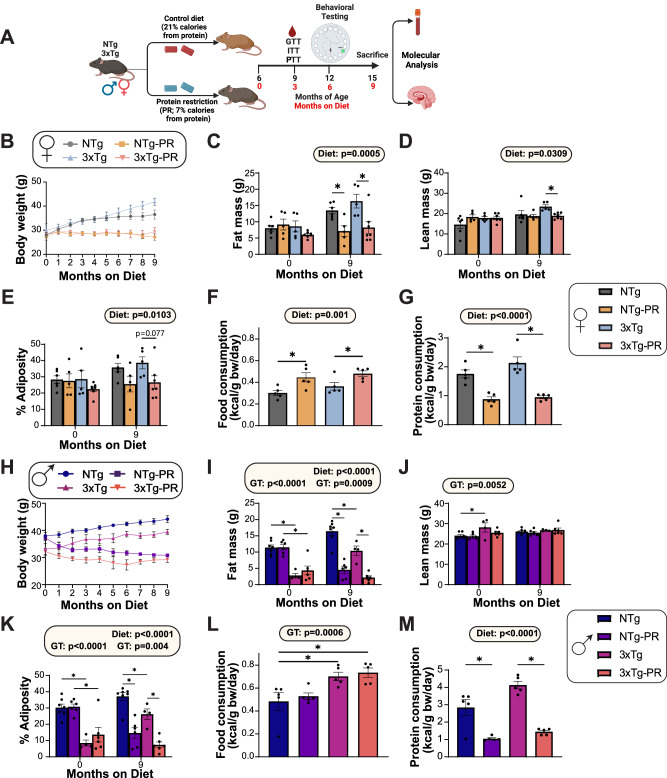
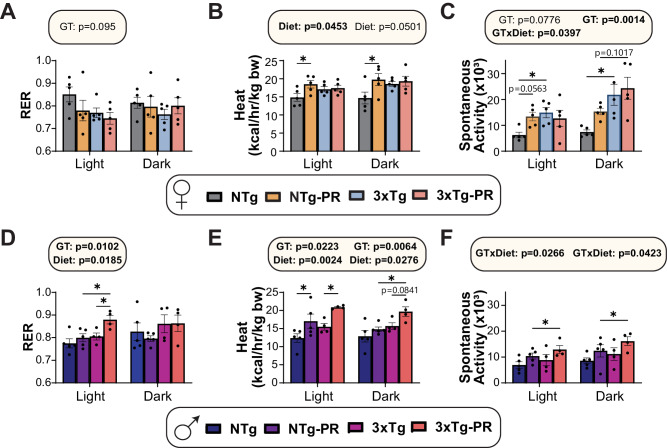
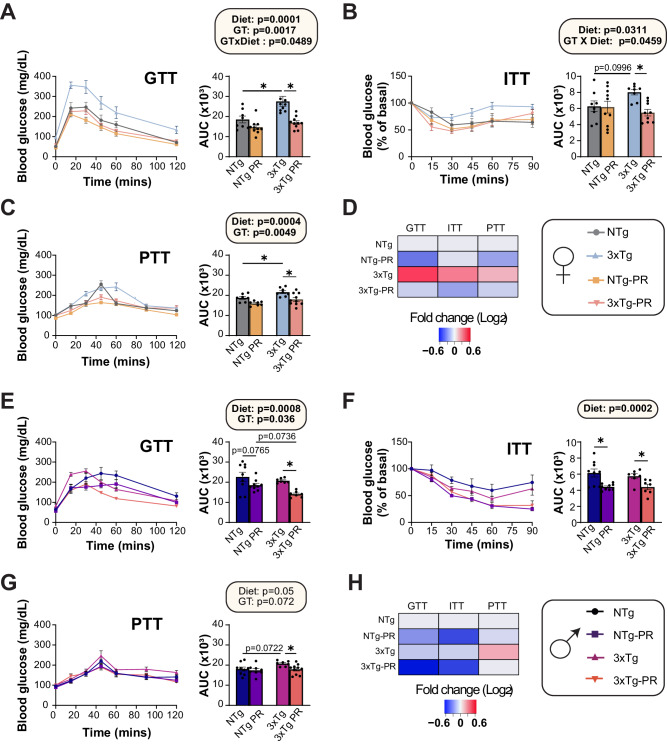
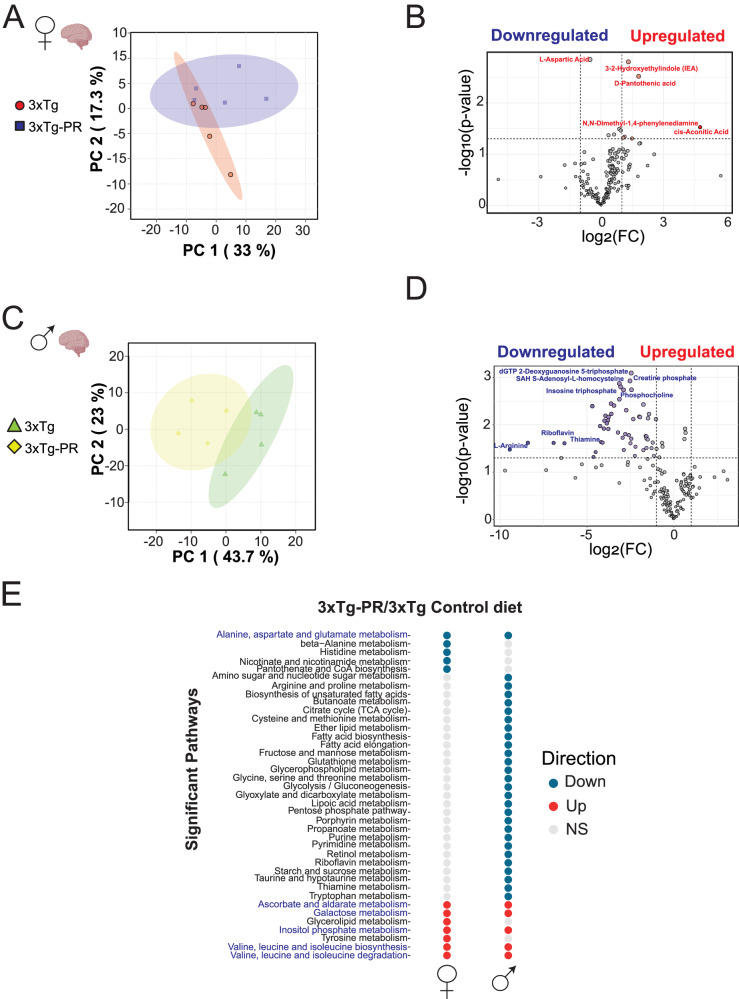
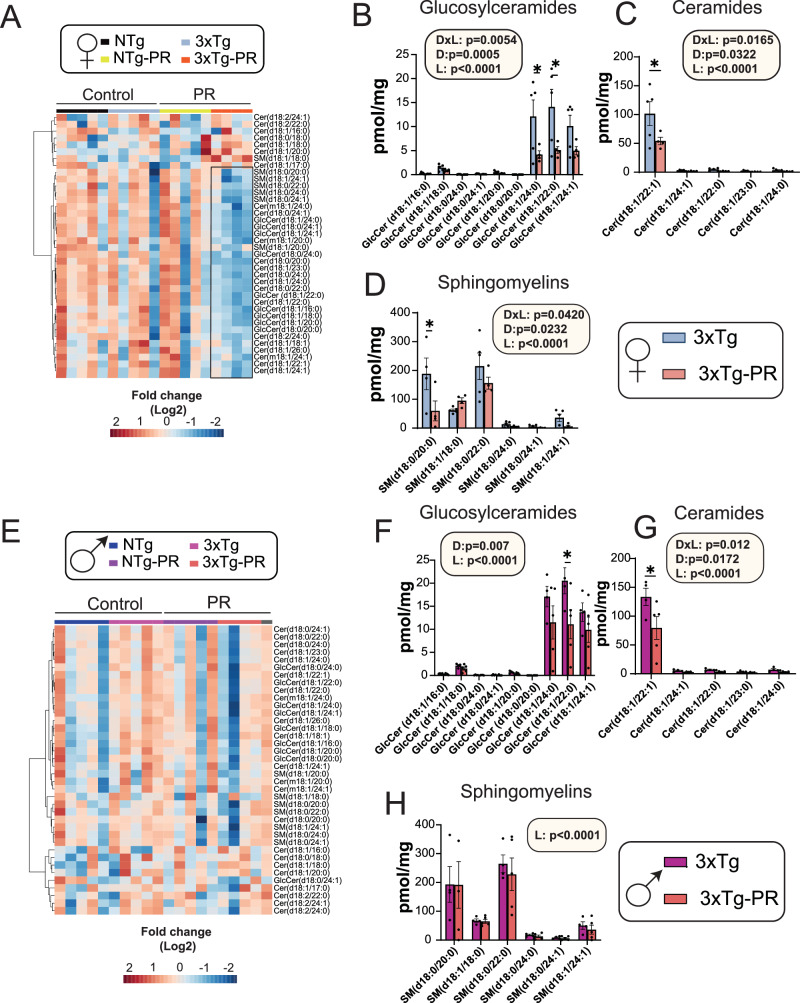
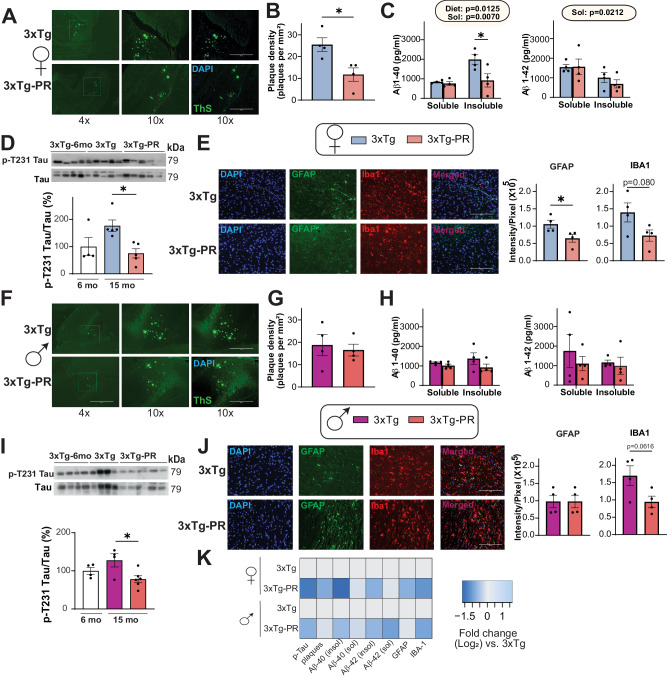
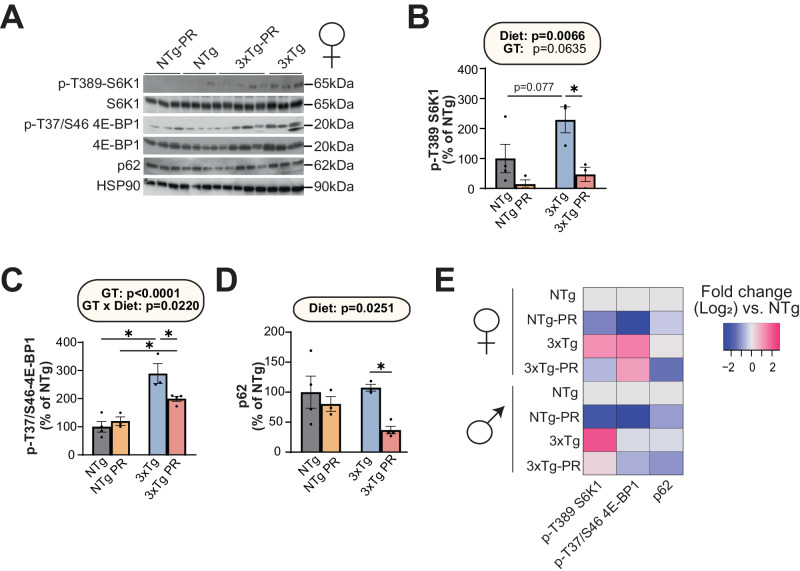
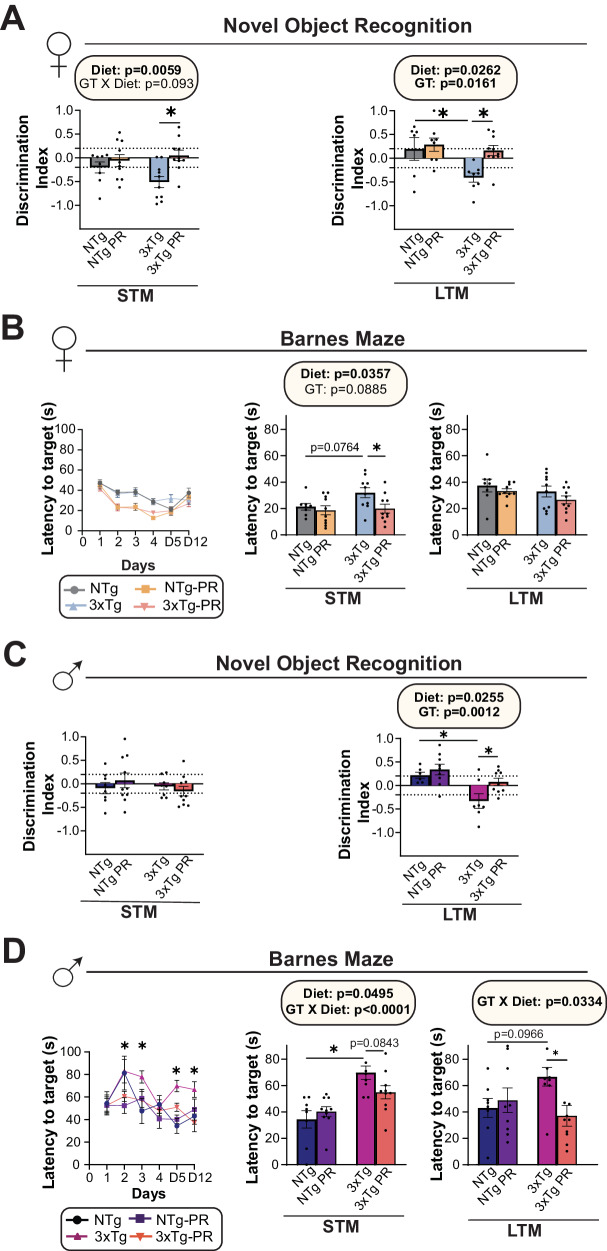
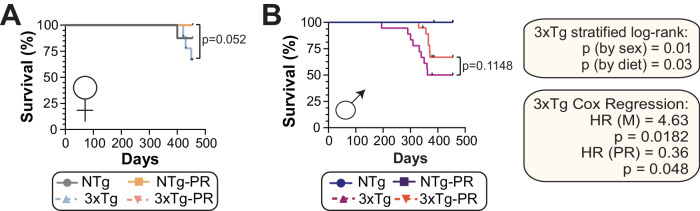
Dietary protein is a critical regulator of metabolic health and aging. Low protein diets are associated with healthy aging in humans, and dietary protein restriction extends the lifespan and healthspan of mice. In this study, we examined the effect of protein restriction (PR) on metabolic health and the development and progression of Alzheimer's disease (AD) in the 3xTg mouse model of AD. Here, we show that PR promotes leanness and glycemic control in 3xTg mice, specifically rescuing the glucose intolerance of 3xTg females. PR induces sex-specific alterations in circulating and brain metabolites, downregulating sphingolipid subclasses in 3xTg females. PR also reduces AD pathology and mTORC1 activity, increases autophagy, and improves the cognition of 3xTg mice. Finally, PR improves the survival of 3xTg mice. Our results suggest that PR or pharmaceutical interventions that mimic the effects of this diet may hold promise as a treatment for AD.


Conflict of interest statement

D.W.L. has received funding from, and is a scientific advisory board member of, Aeovian Pharmaceuticals, which seeks to develop novel, selective mTOR inhibitors for the treatment of various diseases. J.M.D. is a consultant for Evrys Bio and co‐founder of Galilei BioSciences. The remaining authors declare no competing interests.

Figures

Fig. 1
Fig. 1. Protein restriction prevents weight and fat mass gain in 6-month-old 3xTg mice and NTg controls of both sexes.
A Experimental design: male and female 3xTg and non-transgenic (NTg) mice were placed on either a Control or a PR diet starting at 6 months of age, and phenotyped over the course of the next 9 months. The body weight (B) of female mice was followed over the course of the experiment, fat mass (C) and lean mass (D) was determined at the start and end of the experiment, and the adiposity (E) was calculated. n = 6 Control-fed NTg, 5 PR-fed NTg, 5 Control-fed 3xTg and 7 PR-fed 3xTg biologically independent mice. Data from female Control-fed and PR-fed NTg mice are plotted with gray and yellow bars respectively and data from Control-fed and PR-fed 3xTg mice are plotted with blue and pink bars. Food (F) and protein (G) consumption normalized to body weight of female mice at 9 months of age; n = 5 biologically independent mice per group. The body weight (H) of male mice was followed over the course of the experiment, fat mass (I) and lean mass (J) were determined at the start and end of the experiment, and the adiposity (K) was calculated. n = 7 Control-fed NTg, 6 PR-fed NTg, 4 Control-fed 3xTg and 6 PR-fed 3xTg biologically independent mice. Data from male Control-fed and PR-fed NTg mice are plotted with blue and purple bars respectively and data from Control-fed and PR-fed 3xTg mice are plotted with fuchsia pink and coral pink bars. Food (L) and protein (M) consumption normalized to body weight of male mice at 9 months of age; n = 5 biologically independent mice per group. CG, IM statistics for the overall effects of genotype (GT), diet, and the interaction represent the p value from a 2-way ANOVA conducted separately for each time point; *p < 0.05, from a Sidak’s post-test examining the effect of parameters identified as significant in the 2-way ANOVA. (F) NTg vs NTg-PR *p = 0.013, 3xTg vs 3xTg-PR *p = 0.0420. (G) NTg vs NTg-PR *p = 0.0005, 3xTg vs 3xTg-PR *p < 0.0001. (L) NTg vs 3xTg *p = 0.0411, NTg vs 3xTg-PR *p = 0.0157. (M) NTg vs NTg-PR *p = 0.0003, 3xTg vs 3xTg-PR *p < 0.0001. Data represented as mean ± SEM. Figure 1 schematic in (A) created with BioRender.com, released under a Creative Commons Attribution-Non-Commercial-No Derivs 4.0 International license. Source data are provided as a Source Data file.
Fig. 2
Fig. 2. Sex-specific effects of PR on aspects of energy balance in 3xTg mice.
Metabolic chambers were used to determine fuel source utilization, energy expenditure, and spontaneous activity over 24 h in female (AC) and male (DF) 6-month-old 3xTg and NTg mice fed Control or PR diets for 3 months. Respiratory exchange ratio (RER) in females (A) and males (D). Energy expenditure normalized to body weight in females (B) and males (E). Spontaneous activity of females (C) and males (F). AC n = 5 biologically independent mice per group, data from female Control and PR NTg mice are plotted with gray and yellow bars respectively and data from Control and PR 3xTg mice are plotted with blue and pink bars. DF n = 5 Control-fed NTg, 5 PR-fed NTg, 4 Control-fed 3xTg, and 4 PR-fed biologically independent mice per group. Data from male NTg Control and PR mice are plotted with blue and purple bars respectively and data from 3xTg Control and PR mice are plotted with fuchsia pink and coral pink bars. AF Statistics for the overall effects of genotype (GT), diet, and the interaction represent the p value from a 2-way ANOVA conducted separately for the light and dark cycles, *p < 0.05, from a Sidak’s post-test examining the effect of parameters identified as significant in the 2-way ANOVA. Data represented as mean ± SEM. Source data is provided as a Source Data file.
Fig. 3
Fig. 3. A PR diet ameliorates the impaired glycemic control of 3xTg female mice.
Glucose (A), insulin (B), and pyruvate (C) tolerance tests were performed in female mice after three months on Control or PR diets. A GTT: n = 8 Control-fed NTg,10 PR-fed NTg, 9 Control-fed 3xTg and 10 PR-fed 3xTg biologically independent mice. B ITT: n = 8 Control-fed NTg, 10 PR-fed NTg, 8 Control-fed 3xTg, and 9 PR-fed 3xTg biologically independent mice. C PTT: n = 7 Control-fed NTg, 7 PR-fed NTg, 8 Control-fed 3xTg and 10 PR fed 3xTg biologically independent mice. Data from female NTg Control-fed and PR-fed mice are plotted with gray and yellow bars respectively and data from 3xTg Control-fed and PR-fed mice are plotted with blue and pink bars. D Heat map representation of all the metabolic parameters in 3xTg and NTg female mice; color represents the log2 fold-change vs. NTg mice fed a Control diet. Glucose (E), insulin (F), and pyruvate (G) tolerance tests were performed in male mice after 3 months on Control or PR diets. E n = 8 Control-fed NTg, 10 PR-fed NTg, 7 Control-fed 3xTg, and 7 PR-fed 3xTg biologically independent mice. F ITT: n = 9 Control-fed NTg, 9 PR-fed NTg, 7 Control-fed 3xTg, and 7 PR-fed 3xTg biologically independent mice. G PTT n = 9 Control-fed NTg, 8 PR-fed NTg, 7 Control-fed 3xTg, and 10 PR-fed 3xTg biologically independent mice. Data from male NTg Control-fed and PR-fed mice are plotted with blue and purple bars respectively and data from 3xTg Control-fed and PR-fed mice are plotted with fuchsia pink and coral pink bars. H Heat map representation of all the metabolic parameters in 3xTg and NTg male mice; color represents the log2 fold-change vs. NTg mice fed a Control diet. AC, EG statistics for the overall effects of genotype (GT), diet, and the interaction represent the p value from a 2-way ANOVA, *p < 0.05, from a Sidak’s post-test examining the effect of parameters identified as significant in the 2-way ANOVA. Data represented as mean ± SEM. Source data are provided as a Source Data file.
Fig. 4
Fig. 4. PR induces sex-specific shifts in the brain metabolome of 3xTg mice.
Untargeted metabolomics analysis was conducted on the whole brain of 3xTg (A, B) female and (C, D) male mice fed the indicated diets. A, C Principal Component Analysis (PCA) of brain metabolites from 3xTg females and males. B, D Volcano plots display altered brain metabolites, with blue and red indicating significantly decreased and increased metabolites between Control-fed and PR-fed 3xTg groups. Gray dots indicate metabolites that exhibited no significant differences. (two-tailed, t test, unadjusted P value < 0.05) with a >2-fold change are labeled on the volcano plot. E Significantly up and down regulated pathways for each sex and diet were determined using metabolite set enrichment analysis (MSEA). Shared pathways between females and males are highlighted in blue. A, B n = 5 Control-fed and 5 PR-fed 3xTg female biologically independent mice. C, D n = 4 Control-fed and 4 PR-fed 3xTg male biologically independent mice. E p < 0.05 for listed pathways, two-tailed t test. Figure 4 brain icons in (A and C) created with BioRender.com, released under a Creative Commons Attribution-Non Commercial-No Derivs 4.0 International license. Source data are provided as a Source Data file.
Fig. 5
Fig. 5. PR induces sex-specific shifts in the brain sphingolipids of 3xTg mice.
AH Targeted analysis of sphingolipids in the whole brain of NTg and 3xTg mice fed the indicated diets. A, E Heat map of the sphingolipid classes (ceramides, sphingomyelins, and glucosylceramides) that are altered by PR feeding in NTg and 3xTg female and male mice. The black box highlights the sphingolipid subclasses downregulated in 3xTg-PR fed females. BD, FH Statistically significant subclasses of sphingolipids in 3xTg females (BD) and males (FH). B, F Glucosylceramides, C, G Ceramides and D, H Sphingomyelins in the brains of 3xTg female and male mice. BD n = 5 Control-fed 3xTg and 4 PR-fed 3xTg biologically independent mice. FH n = 4 Control-fed 3xTg, and 5 PR-fed 3xTg biologically independent mice. Data from female Control-fed and PR-fed 3xTg mice are plotted with blue and pink bars respectively and data from male Control-fed and PR-fed 3xTg mice are plotted with fuchsia pink and coral pink bars. BD, FH Statistics for the overall effects of diet, lipid and the interaction represent the p value from a 2-way ANOVA; *p < 0.05, from a Sidak’s post-test for the effect of PR on each lipid. (B) *(leftmost)p = 0.0035, *(rightmost)p = 0.0007 (C) *p = 0.0006 (D) *p = 0.005 (F) *p = 0.0021 (G) *p = 0.0003. Data represented as mean ± SEM. Cer Ceramides, SM Sphingomyelins, GlcCer Glucosylceramides. Source data are provided as a Source Data file.
Fig. 6
Fig. 6. PR improves AD neuropathology in both female and male 3xTg mice.
A-K Analysis of AD neuropathology in female (AE) and male (FJ) 3xTg mice fed the indicated diets from 6 to 15 months of age. Representative images of Thioflavin-S staining of plaques in the hippocampus of female (A) and male (F) 3xTg mice. 4x and 10x magnification shown with and without DAPI; scale bar in the 10× image is 400 µM. Quantification of plaque density in females (B) and males (G), n = 4 biologically independent mice per group. Soluble and insoluble fractions of Aβ (1–40) and Aβ (1–42) concentration in the brain of female (C) and male (H) 3xTg mice was determined by ELISA, n = 4 biologically independent mice per group. Western blot analysis of phosphorylated T231 Tau in (D) female 3xTg mice (n = 4 6-month-old, 5 Control-fed and 5 PR-fed 3xTg biologically independent mice) and (I) male 3xTg mice (n = 4 6-month-old, 4 Control-fed 3xTg and 6 PR-fed 3xTg biologically independent mice). B, G two-tailed t test, *p = 0.020 (B), (C, H) statistics for the overall effects of diet, and solubility represent the p value from a 2-way ANOVA, *p < 0.05, from a Sidak’s post-test examining the effect of parameters identified as significant in the 2-way ANOVA. D, I *p = 0.0215 (D), *p = 0.0282 (I), one way ANOVA followed by Tukey’s test (E, J) Immunostaining and quantification of 5 μm paraffin-embedded brain slices for astrocytes (GFAP) and microglia (Iba1) in female (E) and male (J) 3xTg mice. Scale bar is 200 µM. E, J *p = 0.0434 (E), two-tailed t test. Data from female Control-fed and PR-fed 3xTg mice are plotted with blue and pink bars respectively and data from male Control-fed and PR 3xTg-fed mice are plotted with fuchsia pink and coral pink bars. K Heat map representation of the neuropathological findings in female and male 3xTg mice; log2 fold-change relative to 3xTg Control-fed mice of each sex. Data represented as mean ± SEM. Source data is provided as a Source Data file.
Fig. 7
Fig. 7. PR reduces mTORC1 signaling and p62 expression in the brain of female 3xTg-mice.
A The phosphorylation of S6K1 and 4E-BP1, and the expression of p62, was assessed by western blotting of whole brain lysate. Quantification of the phosphorylation of T389 S6K1 (B) and T37/S46 4E-BP1 (C), relative to expression of S6K1 and 4E-BP1, respectively. D Quantification of p62 expression relative to expression of HSP90. E Heatmap representation of the western blot substrates in both females and males. BD n = 4 Control-fed NTg, 3 PR-fed NTg, 3 Control-fed 3xTg and 4 PR-fed 3xTg biologically independent mice; statistics for the overall effects of genotype (GT), diet, and the interaction represents the p value from a 2-way ANOVA, *p < 0.05, from a Sidak’s post-test examining the effect of parameters identified as significant in the 2-way ANOVA. Data from female Control-fed and PR-fed NTg mice are plotted with gray and yellow bars respectively and data from female Control-fed and PR-fed 3xTg mice are plotted with blue and pink bars. Data represented as mean ± SEM. Source data is provided as a Source Data file.
Fig. 8
Fig. 8. PR improves cognitive performance of 3xTg female and male mice.
The behavior of female mice was examined at 12 months of age after mice were fed the indicated diets for 6 months. A The preference for a novel object over a familiar object was assayed in female mice via short-term (STM) and long-term memory (LTM) tests. B Latency of target in Barnes Maze acquisition period over the five days of training and in STM and LTM tests by female mice. The behavior of male mice was examined at 12 months of age after mice were fed the indicated diets for 6 months. C The preference for a novel object over a familiar object was assayed in male mice via short term (STM) and long-term memory (LTM) tests. D Latency of target in Barnes Maze acquisition period over the five days of training and in STM and LTM tests by male mice. A For STM: n = 8 Control-fed NTg, 10 PR-fed NTg, 10 Control-fed 3xTg, and 10 PR-fed 3xTg; for LTM: n = 7 Control-fed, 7 PR-fed NTg, 8 Control-fed 3xTg and 10 PR-fed 3xTg biologically independent female mice. B For STM: n = 8 Control-fed NTg, 10 PR-fed NTg, 10 Control-fed 3xTg, and 10 PR-fed 3xTg; for LTM: n = 8 Control-fed, 10 PR-fed NTg, 10 Control-fed 3xTg and 10 PR-fed 3xTg biologically independent female mice. Data from female Control-fed and PR-fed NTg mice are plotted with gray and yellow bars respectively and data from female Control-fed and PR-fed 3xTg mice are plotted with blue and pink bars. C For STM: n = 8 Control-fed NTg, 10 PR-fed NTg, 8 Control-fed 3xTg, and 10 PR-fed 3xTg; for LTM n = 6 Control-fed NTg, 9 PR-fed NTg, 7 Control-fed 3xTg and 9 PR-fed 3xTg biologically independent mice. D For STM: n = 8 Control-fed NTg, 10 PR-fed NTg, 9 Control-fed 3xTg, and 10 PR-fed 3xTg; for LTM n = 8 Control-fed NTg, 9 PR-fed NTg, 9 Control-fed 3xTg and 10 PR-fed 3xTg biologically independent mice. Data from male Control-fed and PR-fed NTg mice are plotted with blue and purple bars respectively and data from Control-fed and PR-fed 3xTg mice are plotted with fuchsia pink and coral pink bars. A, C, B and D (middle and right panels) statistics for the overall effects of genotype (GT), diet, and the interaction represent the p value from a 2-way ANOVA, *p < 0.05, from a Sidak’s post-test examining the effect of parameters identified as significant in the 2-way ANOVA. (B and D, left panel) *p < 0.05, 3xTg vs. 3xTg-PR, Sidak’s test post 2-way RM ANOVA. Data represented as mean ± SEM. Source data are provided as a Source Data file.
Fig. 9
Fig. 9. PR promotes survival of 3xTg mice.
Kaplan-Meier plots of the survival of female (A) and male (B) NTg and 3xTg mice fed the indicated diets starting at 6 months of age. A, B For females: n = 8 Control-fed NTg, 10 PR-fed NTg, 9 Control-fed 3xTg and 10 PR-fed 3xTg; for males: n = 21 Control-fed NTg, 10 PR-fed NTg, 18 Control-fed 3xTg, and 19 PR-fed 3xTg biologically independent mice; p value from log-rank test, 3xTg vs. 3xTg-PR. The two‐tailed stratified log‐rank p value for the decrease in lifespan because of the male sex and the increase in lifespan because of PR diet is shown. The overall effect of male sex (M) and PR diet (PR) was determined using a Cox proportional hazards test (HR, hazard ratio). Source data are provided as a Source Data file.

Update of

Similar articles

Cited by

References

    1. Sibener L, et al. Alzheimer’s disease prevalence, costs, and prevention for military personnel and veterans. Alzheimer’s Dement. 2014;10:S105–S110. doi: 10.1016/j.jalz.2014.04.011. - DOI - PubMed
    1. Duran-Aniotz C, Hetz C. Glucose metabolism: a sweet relief of Alzheimer’s disease. Curr. Biol. 2016;26:R806–R809. doi: 10.1016/j.cub.2016.07.060. - DOI - PubMed
    1. Schneider LS, Insel PS, Weiner MW, Alzheimer’s Disease Neuroimaging I. Treatment with cholinesterase inhibitors and memantine of patients in the Alzheimer’s Disease Neuroimaging Initiative. Arch. Neurol. 2011;68:58–66. doi: 10.1001/archneurol.2010.343. - DOI - PMC - PubMed
    1. Shi M, Chu F, Zhu F, Zhu J. Impact of anti-amyloid-beta monoclonal antibodies on the pathology and clinical profile of Alzheimer’s disease: a focus on aducanumab and lecanemab. Front. Aging Neurosci. 2022;14:870517. doi: 10.3389/fnagi.2022.870517. - DOI - PMC - PubMed
    1. Soderberg L, et al. Lecanemab, aducanumab, and gantenerumab—binding profiles to different forms of amyloid-beta might explain efficacy and side effects in clinical trials for Alzheimer’s disease. Neurotherapeutics. 2023;20:195–206. doi: 10.1007/s13311-022-01308-6. - DOI - PMC - PubMed

Substances

Grants and funding