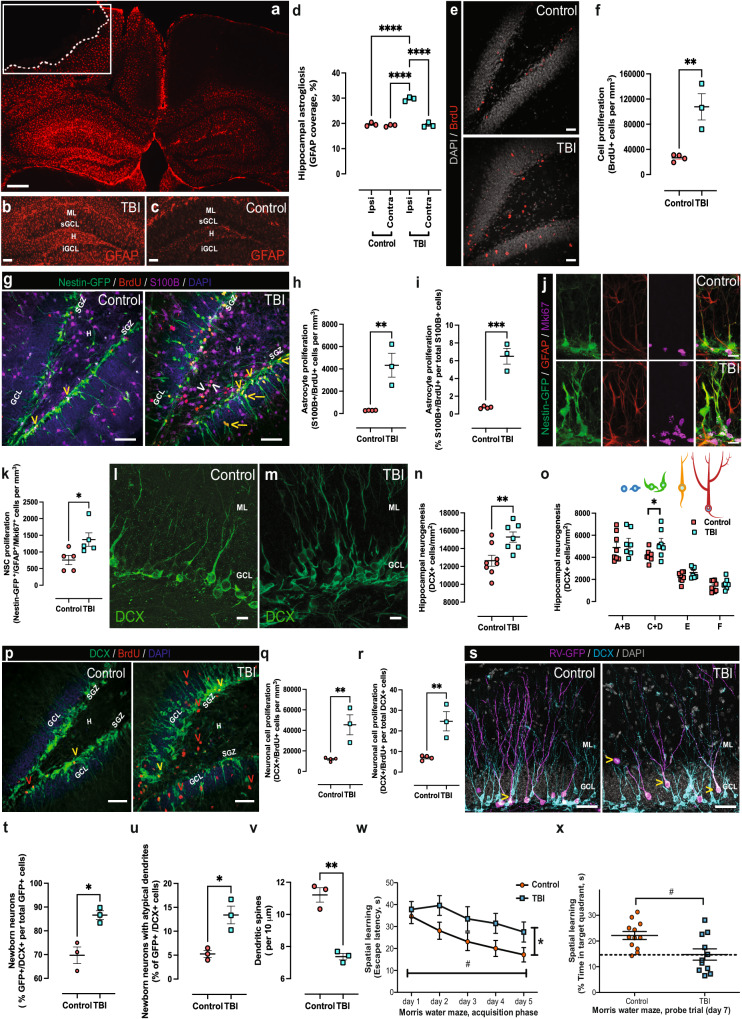
Fig. 1. Immunohistochemical and behavioral characterization of hippocampal changes following TBI.
Micrograph representative of three independent experiments. Red: GFAP immunohistochemistry showing ipsilateral astrogliosis (a), white box: the location of the controlled cortical impact, dotted line: approximate boundary of the cortical lesion, scale bar, 250 µm. Micrographs representative of three independent experiments showing increased astrogliosis in the hippocampus of Control (b) vs. TBI (c) mice. ML molecular layer, sGCL suprapyramidal granule cell layer, H hilus, iGCL infrapyramidal granule cell layer. Scale bars, 100 µm. Quantification of GFAP surface coverage in the dentate gyrus, n = 3 mice. Data are presented as mean values +/− SEM, ***P < 0.0001 one-way ANOVA with Tukey’s post hoc test (d). Micrographs representative of three independent experiments showing proliferative cells in the DG. Red: BrdU, gray: cell nuclei labeled DAPI, scale bars, 40 µm (e). Quantification of cell proliferation in the DG, n = 4 mice. Data are presented as mean values +/− SEM, **P = 0.0061 two-tailed, unpaired t test (f). Micrographs representative of three independent experiments. Green: Nestin-GFP, red: BrdU (red), magenta: mature astrocyte marker S100B. Cell nuclei were labeled with the DNA marker DAPI (blue). Yellow arrowheads: Nestin-GFP+/BrdU+ cells, yellow arrows: Nestin-GFP+/BrdU+ cells in the GCL. Deep pink: S100B+/BrdU+ astrocytes, white arrowheads S100B+/BrdU+ astrocytes in the hilus. Scale bars, 60 µm (g). Quantification of astrocyte proliferation in the DG expressed as the total number of S100B+/BrdU+ cells per mm3, n = 4 mice. Data are presented as mean values +/− SEM, **P = 0,0060 two-tailed, unpaired t test (h). Quantification of astrocyte proliferation in the DG expressed as the % of total S100B+ cells that incorporated BrdU, n = 4 mice. Data are presented as mean values +/− SEM, ***P = 0,0063 two-tailed, unpaired t test (i). Micrographs representative of three independent experiments showing proliferative NSCs in the DG (Nestin-GFP+/GFAP+/Mki67+ cells). Green: Nestin-GFP, red: GFAP, magenta: Mki67, merge: Nestin-GFP+/GFAP+/Mki67+, scale bars, 15 µm (j). Quantification of NSC proliferation in the DG expressed as the total number of Nestin-GFP+/GFAP+/Mki67+ per mm3, n = 5 mice. Data are presented as mean values +/− SEM, *P = 0.0374 two-tailed, unpaired t test (k). Micrographs representative of three independent experiments showing cells expressing DCX in the DG of Control (l) or TBI (m) mice, scale bars, 10 µm. Quantification of hippocampal neurogenesis expressed as total numbers of DCX+ cells in the dentate gyrus, Control n = 5 mice, TBI n = 4 mice. Data are presented as mean values +/− SEM, *P < 0.0078 two-tailed unpaired t test (n). Quantification of six DCX+ cell phenotypes according to the presence, shape and orientation of apical dendrites within the DG. Control n = 5 mice, TBI n = 4 mice. Data are presented as mean values +/− SEM, *P = 0.0431 one-way ANOVA with Tukey’s post hoc test (o). Micrographs representative of three independent experiments showing proliferative cells in the DG, Green: DCX antibodies, red: BrdU, blue: cell nuclei labeled DAPI. Yellow somas indicated by yellow arrowheads: DCX+/BrdU+ cells, red somas indicated by red arrowheads: (DCX-/BrdU+) cells, scale bars, 80 µm (p). Quantification of neuronal cell proliferation in the DG expressed as the total number of DCX+/BrdU+ cell per mm3, n = 4 mice. Data are presented as mean values +/− SEM, **P = 0.0095 two-tailed, unpaired t test (q). Quantification of neuronal cell proliferation in the DG expressed as the % of total DCX+ cells that incorporated BrdU, n = 4 mice. Data are presented as mean values +/− SEM, **P = 0.0068 two-tailed, unpaired t test (r). Micrographs representative of three independent experiments. Magenta: RV-GFP, cyan: DCX. Yellow arrows: RV-GFP+/ DCX+ cells in the external half of the GCL or the ML, scale bars, 20 µm (s). Quantification of newborn neuron numbers expressed as the % of DCX+ cells that were positive for RV-GFP, n = 4 mice. Data are presented as mean values +/− SEM, *P = 0.0129 two-tailed, unpaired t test (t). Quantification of the number of newborn neurons with two primary dendrites emerging directly from the soma, or a main dendrite bifurcating within the first 10 µm from the soma (atypical dendrites) expressed as the % of total newborn neurons, n = 4 mice. Data are presented as mean values +/− SEM, *P = 0.0146 two-tailed, unpaired t test (u). Quantification of dendritic spines density in secondary and tertiary dendrites of newborn cells expressed as the number of spines per 10 μm long dendritic segment, n = 4 mice. Data are presented as mean values +/− SEM, **P = 0.0014 two-tailed, unpaired t test (v). Escape latency in the Morris Water Maze test Control n = 12 mice, TBI n = 11 mice. Data are presented as mean values +/− SD, #F(1, 109) = 67,0012, P = 5,56 10−13 time, *F(4, 109) = 19,6203, P = 3, 47 10−12 treatment, two-way repeated measures ANOVA with Bonferroni post hoc test. Exact P values were calculated using P = F.DIST.RT(F, DFn, DFd) (w). Percentage of time spent in the target quadrant during the Morris water maze probe trial, Control n = 12 mice, TBI n = 11 mice. Data are presented as mean values +/− SEM, #P = 0.011 two-tailed, unpaired t test (x). Source data are provided as a Source Data file.