. 2024 Jul;43(31):2389-2404.
doi: 10.1038/s41388-024-03080-7. Epub 2024 Jun 18.

Tumor-resident microbiota contributes to colorectal cancer liver metastasis by lactylation and immune modulation

Affiliations

Tumor-resident microbiota contributes to colorectal cancer liver metastasis by lactylation and immune modulation

Jian Gu et al. Oncogene. 2024 Jul.

Erratum in

Abstract

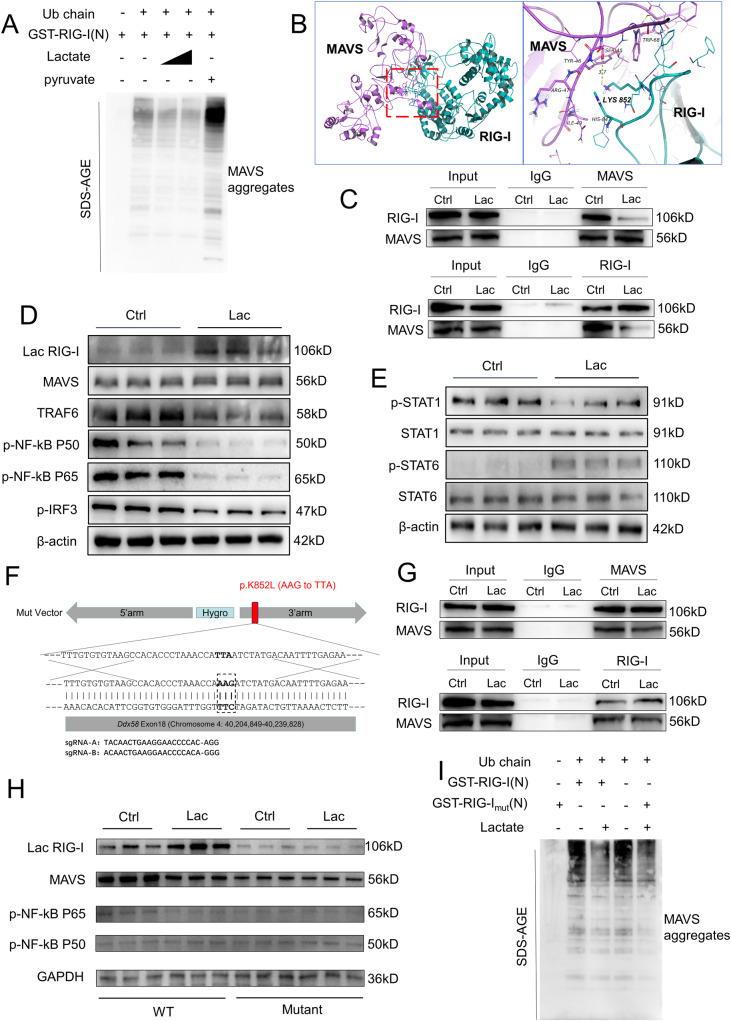
The role of tumor-resident microbiota in modulating tumor immunity remains unclear. Here, we discovered an abundance of intra-tumoral bacteria, such us E.coli, residing and resulting in Colorectal cancer liver metastasis (CRLM). E.coli enhanced lactate production, which mediated M2 macrophage polarization by suppressing nuclear factor-κB -gene binding (NF-κB) signaling through retinoic acid-inducible gene 1 (RIG-I) lactylation. Lactylation of RIG-I suppressed recruitment of NF-κB to the Nlrp3 promoter in macrophages, thereby reducing its transcription. This loss of Nlrp3 affected the immunosuppressive activities of regulatory T cells (Tregs) and the antitumor activities of and CD8+ T cells. Small-molecule compound screening identified a RIG-I lactylation inhibitor that suppressed M2 polarization and sensitized CRLM to 5-fluorouracil (5-FU). Our findings suggest that tumor-resident microbiota may be a potential target for preventing and treating CRLM.


Conflict of interest statement

The authors declare no competing interests.

Figures

Fig. 1
Fig. 1. CRLM has significant amounts of microbiota, which promotes disease progression.
A Overview of the fraction of microbiota from the tumor samples by 16 s rDNA sequencing. Patients are grouped into separate plots based on sample location and with or without liver metastasis (CRC-C, CRLM-C, and CRLM-L). Each color represents a kind of microbiota, and the length of each color represents the abundance of the microbiota in each kind of tumor sample in general. B The numbers of microbiota from the tumors (n = 20) in CRC-C, CRLM-C, and CRLM-L were collected and detected by qPCR. Error bars indicate SEM. Statistics were determined using a t-test with significance indicated (ns, not significant. **p < 0.01). C Representative whole-body bioluminescence images (up) of mice orthotopically xenografted after intravenous injection with MC38-luc+ cells and representative images of liver metastasis (down) from control, antibiotics-treated group (Abx) and E.coli-treated group mice (n = 10). D Representative co-immunofluorescence images of CD206(M2 marker) and DAPI (nuclear counterstain) in tumors from mice in (C). Scale bars, 100 μm. Objective, 10x. E Representative immunofluorescence images of mCherry(E.coli marker) in para tumor (PT) and liver tumor (T) from mice gavaged with mCherry-E.coli at day 21. Scale bars, 100 μm. Objective, 5x. F Representative co-immunofluorescence images of staining for mCherry(E.coli marker), CD206(M2 marker), Foxp3(Treg marker), and DAPI(nuclear counterstain) in tumors from mice in liver metastasis from control, low dose and high dose E.coli-treated group mice (n = 10) at day 21. Scale bars, 100 μm Objective, 10x and 5x. G Representative co-immunofluorescence images of staining for CD206(M2 marker) and DAPI (nuclear counterstain) liver metastasis from control, antibiotics-treated, and E.coli(iv) injected group mice (n = 10) at day 21. Scale bars, 100 μm. Objective, 10x. H Representative co-immunofluorescence images of staining for iNOS(M1 marker) and DAPI(nuclear counterstain) liver metastasis from control, antibiotics-treated, and E.coli(iv) injected group mice (n = 10) at day 21. Scale bars, 100 μm. Objective, 10x.
Fig. 2
Fig. 2. Microbiota promote CRLM by increasing tumor glycolysis and M2 polarization of macrophages.
A ECAR (mpH/min) of control and E.coli-treated MC38 cells. Curves(left) show a change in lactic acid production within 90 min. n = 3/group. Each symbol represents the average ECAR. Histogram(mid) represents the basal respiration of control and E.coli-treated MC38 cells. Histogram(right) represents glycolytic function control and E.coli-treated MC38 cells. Error bars indicate SEM. Statistics were determined using a t-test with significance indicated (***p < 0.001). Data are representative of 3 independent experiments. B Lactic acid concentration in culture environment of MC38 cells (n = 3) in (A). Error bars indicate SEM. Statistics were determined using a t-test with significance indicated (**p < 0.01). C Lactic acid concentration in liver metastasis from the control group and mice treated with E.coli alone or + LDHi (n = 10). Error bars indicate SEM. Statistics were determined using a t-test with significance indicated (*p < 0.05, **p < 0.01). D Representative whole-body bioluminescence images (left) of mice orthotopically xenografted after intravenous injection with MC38-luc+ cells and representative images of liver metastasis (right) from the control group and mice treated with E.coli alone or + LDHi (n = 10). Scale bars: 1 cm. E Representative co-immunofluorescence images of staining for CD206(M2 marker) and DAPI(nuclear counterstain) in tumors from mice in (C). Scale bars, 100 μm. Objective, 10x. F Representative whole-body bioluminescence images (up) of mice orthotopically xenografted after intravenous injection with MC38-luc+ cells and representative images of liver metastasis (down) from E.coli-injected and E.coli/CLD-injected group mice (n = 10). Scale bars: 1 cm. G The detectable tumor numbers(left), lactic acid concentration(mid), and numbers of microbiota(right) in liver metastasis (n = 10) from mice treated with E.coli alone or + the CLD liposomes. Error bars indicate SEM. Statistics were determined using a t-test with significance indicated (ns, not significant, ****p < 0.0001). H Representative co-immunofluorescence images and mean gray value of staining for CD206(M2 marker), Foxp3(Treg marker), and DAPI (nuclear counterstain) in tumors from mice in (F). Scale bars, 100 μm. Objective, 10x. I Gene expression of Tnfa, Il6, Il1b, and Cxcl10 in liver tissues from mice in (K) (*p < 0.05).
Fig. 3
Fig. 3. Lactate promotes M2 polarization of macrophages through lactylation of RIG-IK852.
A Representative co-immunofluorescence images and mean gray value of staining for iNOS, CD206, and DAPI in Kupffer cells isolated from C57BL/6 mice after treatment with lactate (5 mmol/l) at day 3. Scale bars, 100 μm. Objective, 10x. B Representative histograms show different mRNA levels of ARG1, CD86, MRC1 and NOS2 in Kupffer cells treated with lactate (5 mmol/l). Error bars indicate SEM. Statistics were determined using a t-test with significance indicated (*p < 0.05, ***p < 0.001). Data are representative of 3 independent experiments. C Protein lactylation modification in Kupffer cells after treatment with PBS or lactate with different concentrations (5, 15, or 25 mmol/L) at day 3. D Protein lactylation modification in liver metastasis from the mice after treatment with PBS or C646 with different concentrations (2.5, 5 or 10 umol/L) at day 3. E Representative whole-body bioluminescence images (up) of mice orthotopically xenografted after intravenous injection with MC38-luc+ cells and representative images of liver metastases (down) from control, E.coli (1 × 109 CFUs)-treated and E.coli (1 × 109 CFUs)-treated + C646 (5 μmol/l)-injected group mice at day 21. n = 10/group. Scale bars: 1 cm. F Histograms of detectable surface tumor numbers in liver metastases from control, E.coli (1 × 109 CFUs)-treated and E.coli (1 × 109 CFUs)-treated + C646 (5 μmol/l)-injected group mice. n = 10/group. Error bars indicate SEM. Statistics were determined using a t-test with significance indicated (ns, not significant, *p < 0.05, **p < 0.01). Data are representative of 3 independent experiments. G Representative histograms of lactic acid concentration in liver metastasis from the three groups in (E). Error bars indicate SEM. Statistics were determined using a t-test with significance indicated (ns, not significant; **p < 0.01). Data are representative of 3 independent experiments. H Representative co-immunofluorescence images for iNOS, CD206, and DAPI in Kupffer cells treated with lactate (5 mmol/l) + RIG-IK852 Ab (1 mmol/l), HMGB1 K88 Ab (1 mmol/l) and HMGB1 K114 Ab (1 mmol/l) or lactate (5 mmol/l) alone at day 3. S Scale bars, 100 μm. Objective, 10x. I Mean gray value of staining of (H). J Gene expression of Tnfa, Il6, Il1b, and Cxcl10 from cells in (H) (*p < 0.05).
Fig. 4
Fig. 4. Lactylation of RIG-IK852 reduces the aggregation of mitochondrial antiviral signaling protein and NF-κB activation.
A Immunoblot analysis of in vitro MAVS aggregation. GST-RIG-I(N) was incubated with K63-Ub4 and then with mitochondria isolated from RAW264.7 cells preincubated with or without lactate (5 mM,10 mM) or pyruvate, followed by an analysis of mitochondria extracts using SDD-AGE. B Protein-protein docking pose of RIG-I and MAVS before and after Lys852 lactylation predicted by three-dimensional modeling. C Co-IP assays confirmed that the binding strength of RIG-I to MAVS was obviously decreased after the lactylation modification. D Kupffer cells isolated from C57BL/6 mice were treated with lactate (5 mmol/l) at day 3. Afterward, the protein expression levels of lac-RIG-I, MAVS, TRAF6, p-NF-kB P50, p-NF-kB P65, and p-IRF3 were detected via western blot. E The protein expression levels of p-STAT1, STAT1, p-STAT6, and STAT6 in Kupffer cells after treatment with lactate (5 mmol/l) at day 3 were measured by western blot. F Mutation of lysine to arginine at site 852 of RIG-I in macrophages by using CRISPR-Cas9 gene editing in RAW264.7 cells. G Co-IP assays confirmed that the binding strength of RIG-I to MAVS was no significant difference whether or not treated with lactate after the RIG-I K852 site mutation. H Normal RAW264.7 cells or the RAW264.7 cells with RIG-I K852 site mutation were treated with lactate (5 mmol/l) or not at day 3. Afterward, the protein expression levels of lac-RIG-I, MAVS, p-NF-kB P50, and p-NF-kB P65 were detected via western blot. I Immunoblot analysis of in vitro MAVS aggregation. GST-RIG-I(N) or GST-RIG-I(N)mu was incubated with K63-Ub4 and then with mitochondria isolated from RAW264.7 or RAW264.7mut cells preincubated with or without lactate (5 mM), followed by an analysis of mitochondria extracts using SDD-AGE. All samples derive from the same experiment or parallel experiments and that gels/blots were processed in parallel.
Fig. 5
Fig. 5. RIG-I depletion reduces inflammasome activation and promotes CRLM progression by decreasing NF-κB phosphorylation and NLRP3 transcription.
A Representative images of surface tumor numbers in liver metastases from RIG-IFL/FL + E.coli (1 × 109CFUs)-treated, RIG-IΔMø, and RIG-IΔMø + E.coli (1 × 109CFUs)-treated mice at day 21. n = 10/group. Scale bars: 1 cm. B Representative whole-body bioluminescence images (up) of mice orthotopically xenografted after intravenous injection with MC38-luc+ cells and representative images of liver metastasis (down) from the three groups in (A). C Representative co-immunofluorescence images of staining for CD206 (M2 macrophage marker) and DAPI (nuclear counterstain) in liver metastasis between the three groups in (A). Scale bars, 100 μm. Objective, 10x. D Kupffer cells were isolated from RIG-IFL/FL + E.coli (1 × 109CFUs)-treated, RIG-IΔMø, and RIG-IΔMø + E.coli (1 × 109CFUs)-treated mice, respectively at day 21. Afterward, Nlrp3, C-caspase-1, Pro-C-caspase-1, IL-1β, and Pro-IL-1β expression levels were detected via western blot. E Schematic of the CHIP–seq workflow. F Representative whole-body bioluminescence images (up) of mice orthotopically xenografted after intravenous injection with MC38-luc+ cells and representative images of liver metastasis (down) from Nlrp3FL/FL, Nlrp3FL/FL + E.coli (1 × 109CFUs)-injected, Nlrp3ΔMø and Nlrp3ΔMø+E.coli (1 × 109CFUs)-injected mice at day 21. n = 10/group. Scale bars: 1 cm. G Representative histograms of the equivalent bacteria per gram tissue, lactic acid concentration in liver metastasis between the four groups in (F). Error bars indicate SEM. Statistics were determined using a t-test with significance indicated (ns, not significant, *p < 0.05, **p < 0.01). Data are representative of 3 independent experiments. H Kupffer cells were isolated from Nlrp3FL/FL, Nlrp3FL/FL + E.coli (1 × 109CFUs)-injected, Nlrp3ΔMø and Nlrp3ΔMø+E.coli (1 × 109CFUs)-injected mice respectively at day 3. Then, the protein expression of Nlrp3, C-caspase-1, Pro-C-caspase-1, IL-1β, and Pro-IL-1β were detected by western blot. All samples derive from the same experiment or parallel experiments and that gels/blots were processed in parallel.
Fig. 6
Fig. 6. RIG-I K852 lactylation in M2 macrophages regulates PD-1+ Tregs and CD8 + T cells in TME.
A Schematic showing of Naïve T cells did or did not co-cultured with Kupffer cells or lactate-treated Kupffer cells from WT mice with or without using transwell. B Representative plots of the percentages of FOXP3+ or PD-1+ cells(left), a representative histogram of the percentages of FOXP3+(mid) or PD-1+(right) cells at day 3 of Naïve T cells in (A). Error bars indicate SEM. Statistics were determined using a t-test with significance indicated (ns, not significant, **p < 0.01). Data are representative of 3 independent experiments. C Representative plots of the percentages of FOXP3+(top) or PD1+(mid) cells, a representative histogram of the percentages of FOXP3+ or PD-1+ cells(bottom) at day 3 of Naïve T cells cultured with medium supplemented with supernatant of cultured Kupffer cells from RIG-IFL/FL or RIG-IΔMø mice with or without lactate. Error bars indicate SEM. Statistics were determined using a t-test with significance indicated (ns, not significant, *p < 0.05). Data are representative of 3 independent experiments. D Representative plots of the percentages of FOXP3+(top) or PD-1+(mid) cells, a representative histogram of the percentages of FOXP3+ or PD-1+ cells(bottom) at day 3 of Naïve T cells cultured with medium supplemented with supernatant of cultured Kupffer cells from Nlrp3FL/FL or Nlrp3ΔMø mice with or without lactate. Error bars indicate SEM. Statistics were determined using a t-test with significance indicated (ns, not significant, *p < 0.05, ***p < 0.001). Data are representative of 3 independent experiments. E Representative plots(left) and a representative histogram of the reproductive capacity(right) of CD8+ T cells in the presence of PBS or Kupffer cells from WT mice with or without using transwell at day 3. Error bars indicate SEM. Statistics were determined using a t-test with significance indicated (ns, not significant, *p < 0.05, ***p < 0.001). Data are representative of 3 independent experiments. F Representative histogram of IL-2(left) and IFN-γ(right) secretion at day 3 of CD8+ T cells cultured with medium supplemented with supernatant of cultured Kupffer cells from WT mice with or without lactate. Error bars indicate SEM. Statistics were determined using a t-test with significance indicated (ns, not significant, *p < 0.05). Data are representative of 3 independent experiments. G Protein expression levels of mTOR in CD8+ T cells cultured with medium supplemented with supernatant of cultured Kupffer cells from WT mice with or without lactate at day 3 were detected by western blot. Data are representative of 3 independent experiments. All samples derive from the same experiment or parallel experiments and that gels/blots were processed in parallel.
Fig. 7
Fig. 7. Natural small molecule compounds slow the progression of CRLM by inhibiting the lactytation of RIG-IK852.
A Statistical results of the numbers of microbiota from the tumor in liver metastasis of colorectal cancer (CRLM_L) and its para-tumor (CRLM_L-PT), hepatocellular carcinoma (HCC) and its para-tumor (HCC-PT). n = 10/group. Error bars indicate SEM. Statistics were determined using a t-test with significance indicated (ns, not significant, *p < 0.05, ***p < 0.001). Data are representative of 3 independent experiments. B Protein expression levels of Lac RIG-I and RIG-I in macrophages isolated from CRLM_L, CRLM_L-PT, HCC-T, and HCC-PT respectively were detected via western blot. Data are representative of 3 independent experiments. C The discovery and design diagram and binding analysis of three kinds of compounds. D Kupffer cells isolated from C57BL/6 mice were cultured with small-molecule compound inhibitor 1 (1 mmol/l), 2 (1 mmol/l), or 3 (1 mmol/l) at day 3. Afterward, Lac RIG-I and RIG-I expression levels were detected via western blot. Data are representative of 3 independent experiments. E Representative histograms show different mRNA levels of ARG1 and MRC1 in Kupffer cells treated with lactate (5 mmol/l) alone or combined with inhibitor1 (1 mmol/l) at day 3. Error bars indicate SEM. Statistics were determined using a t-test with significance indicated (*p < 0.05, **p < 0.01, ***p < 0.001). Data are representative of 3 independent experiments. F Representative co-immunofluorescence images of staining for CD206 (M2 macrophage marker) and DAPI (nuclear counterstain) in Kupffer cells treated with lactate alone or + inhibitor1 at day 3. Scale bars, 100 μm. Objective, 10x. G Representative whole-body bioluminescence images (up) of mice orthotopically xenografted after intravenous injection with MC38-luc+ cells and representative images of liver metastasis from WT, 5-FU (5 mg/kg)-treated alone or 5-FU (5 mg/kg)/inhibitor1 (200 mg/kg)-treated mice. H Representative histograms show differences in surface tumor numbers between the three groups in (G) at day 21. n = 10/group. Scale bars: 1 cm. Error bars indicate SEM. Statistics were determined using a t-test with significance indicated (*p < 0.05, **p < 0.01, ***p < 0.001). All samples derive from the same experiment or parallel experiments and that gels/blots were processed in parallel.

Similar articles

Cited by

References

    1. Keum N, Giovannucci E. Global burden of colorectal cancer: emerging trends, risk factors and prevention strategies. Nat Rev Gastroenterol Hepatol. 2019;16:713–32. - PubMed
    1. Dekker E, Tanis PJ, Vleugels JLA, Kasi PM, Wallace MB. Colorectal cancer. Lancet. 2019;394:1467–80. - PubMed
    1. Zhao S, Mi Y, Guan B, Zheng B, Wei P, Gu Y, et al. Tumor-derived exosomal miR-934 induces macrophage M2 polarization to promote liver metastasis of colorectal cancer. J Hematol Oncol. 2020;13:156. - PMC - PubMed
    1. Binnewies M, Roberts EW, Kersten K, Chan V, Fearon DF, Merad M, et al. Understanding the tumor immune microenvironment (TIME) for effective therapy. Nat Med. 2018;24:541–50. - PMC - PubMed
    1. Zhang Q, He Y, Luo N, Patel SJ, Han Y, Gao R, et al. Landscape and dynamics of single immune cells in hepatocellular carcinoma. Cell. 2019;179:829–845 e820. - PubMed

MeSH terms