. 2024 Jun 18;7(1):734.
doi: 10.1038/s42003-024-06359-3.

Membrane depolarization mediates both the inhibition of neural activity and cell-type-differences in response to high-frequency stimulation

Affiliations

Membrane depolarization mediates both the inhibition of neural activity and cell-type-differences in response to high-frequency stimulation

Jae-Ik Lee et al. Commun Biol. .

Abstract

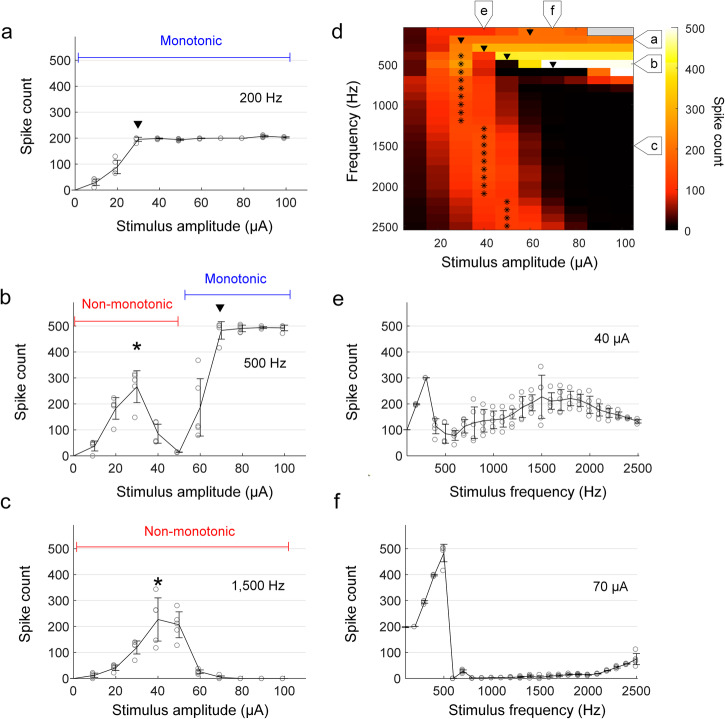
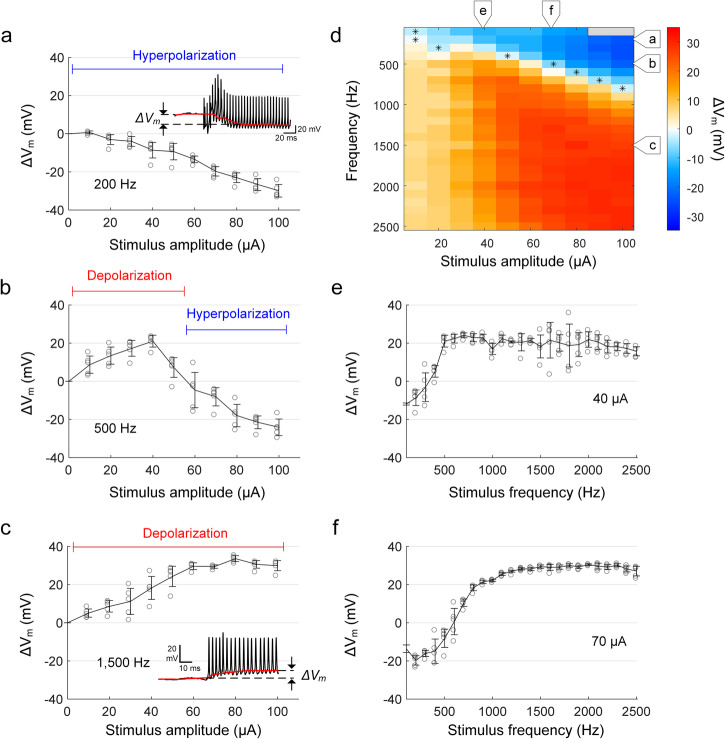
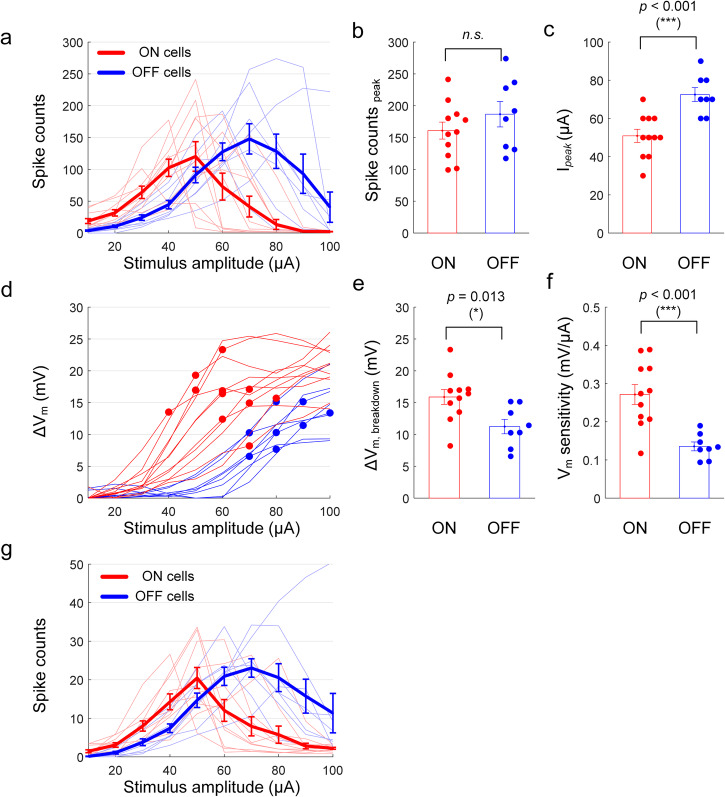
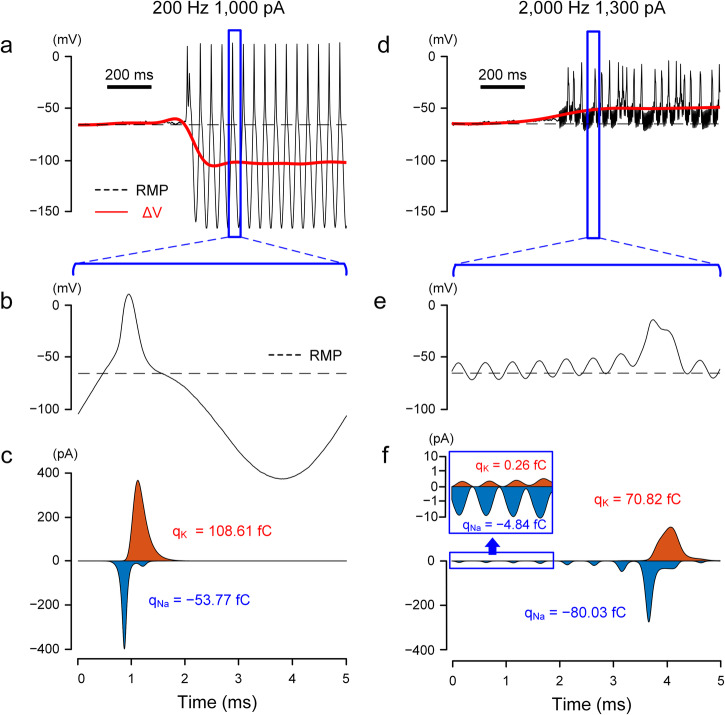
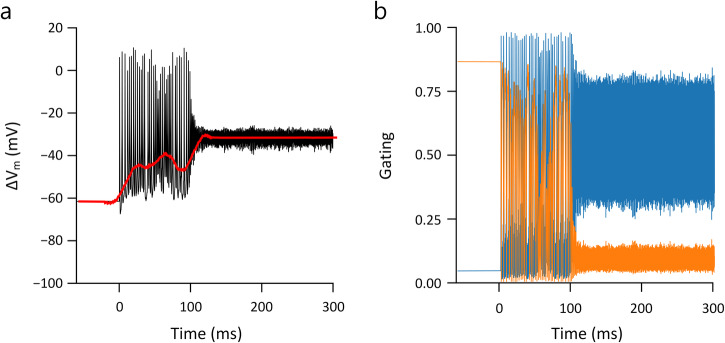
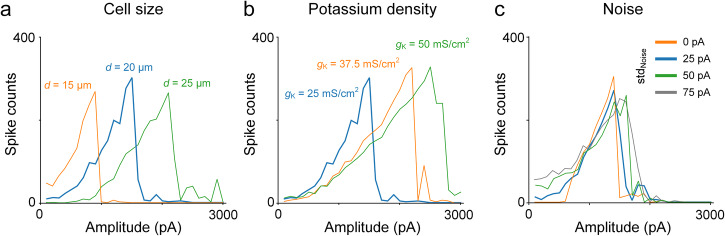
Neuromodulation using high frequency (>1 kHz) electric stimulation (HFS) enables preferential activation or inhibition of individual neural types, offering the possibility of more effective treatments across a broad spectrum of neurological diseases. To improve effectiveness, it is important to better understand the mechanisms governing activation and inhibition with HFS so that selectivity can be optimized. In this study, we measure the membrane potential (Vm) and spiking responses of ON and OFF α-sustained retinal ganglion cells (RGCs) to a wide range of stimulus frequencies (100-2500 Hz) and amplitudes (10-100 µA). Our findings indicate that HFS induces shifts in Vm, with both the strength and polarity of the shifts dependent on the stimulus conditions. Spiking responses in each cell directly correlate with the shifts in Vm, where strong depolarization leads to spiking suppression. Comparisons between the two cell types reveal that ON cells are more depolarized by a given amplitude of HFS than OFF cells-this sensitivity difference enables the selective targeting. Computational modeling indicates that ion-channel dynamics largely account for the shifts in Vm, suggesting that a better understanding of the differences in ion-channel properties across cell types may improve the selectivity and ultimately, enhance HFS-based neurostimulation strategies.


Conflict of interest statement

The authors declare no competing interests.

Figures

Fig. 1
Fig. 1. RGC response patterns show variation with stimulus frequency.
ac The number of spikes elicited in an ON α sustained RGC from the explanted mouse retina is plotted as a function of current amplitude for stimulus frequencies of 200 (a), 500 (b), and 1500 Hz (c). Arrowheads indicate the amplitude level at which monotonic responses saturated, and asterisks indicate the amplitude at which non-monotonic responses peaked. The duration of the stimulus was 1 s. d The number of spikes elicited in a representative cell for all combinations of frequency and amplitude is mapped. Consistent with (ac), arrowheads and asterisks indicate plateau levels and peak responses, respectively. The stimulus amplitudes of 90–100 μA for 100 Hz (colored in gray) were not tested to prevent potential damage on stimulating electrodes and neurons by excessive electric charge. e, f The number of spikes is plotted as a function of stimulus frequency for current amplitudes of 40 (e) and 70 µA (f). In all plots, each combination of frequency and amplitude was applied at least five times. Error bars indicate the standard deviation.
Fig. 2
Fig. 2. Sinusoidal stimulation leads to changes in baseline membrane potential.
a An in vitro whole-cell recording of a representative RGC response to 2000 Hz sinusoidal stimulation (duration of 1 s and amplitude of 50 µA). An expanded view of the recording at stimulus onset (blue box) is shown below. b Stimulus artifact extracted from the whole-cell recording by fitting with a sinusoidal function. c After removing the stimulus artifact from the raw recording (i.e., a, b), the baseline membrane potential (red trace) is obtained by median filtering (see “Methods”). ΔVm was quantified by the difference between resting membrane potential (i.e., membrane potential before stimulus onset; blue trace) and shifted baseline membrane potential during stimulation. The scale bar in the inset of (a) applies to both (b) and (c). d Strong HFS resulting in a substantial depolarization was followed by a momentary hyperpolarization below the resting level. This post-stimulus changes in the membrane potential typically lasted for less than 500 ms. Same as in (c), the red and blue traces indicate the baseline membrane potential and resting membrane potential level, respectively.
Fig. 3
Fig. 3. The change in baseline membrane potential varies with stimulus frequency.
ac The average membrane potential changes (ΔVm) induced by stimulus frequencies of 200 (a), 500 (b), and 1500 Hz (c) are plotted as a function of the stimulus amplitude. d The heat map shows ΔVm induced by each stimulus condition in a representative cell from the explanted mouse retina (the same cell in Fig. 1). The positive and negative signs in the legend indicate depolarization and hyperpolarization, respectively. e, f The level of ΔVm is plotted as a function of stimulus frequency for current amplitudes of 40 (e) and 70 µA (f). In all plots, each combination of frequency and amplitude was applied at least five times. Error bars indicate the standard deviation.
Fig. 4
Fig. 4. Excessive depolarization leads to spike suppression.
ac Typical in vitro whole-cell patch recordings (artifact-subtracted, see “Methods”) at low, medium, and high levels of depolarization, respectively. Red traces show the shift in baseline membrane potential. Stimulus currents are 20 (a), 40 (b), and 60 µA (c). The dotted blue horizontal lines are arbitrarily positioned to help facilitate comparisons of spike amplitude. d, e The number of spikes is plotted as a function of ΔVm (d) and current amplitude (e) for stimulation frequencies of 1000, 1500, and 2500 Hz. Each combination of frequency and amplitude was applied at least three times and error bars indicate the standard deviation. f, g The number of spikes is plotted as a function of ΔVm (f) and current amplitude (g) in response to 2000 Hz stimulation. The black and gray line segments indicate portions of the curve below and above the peak firing rate, respectively. Error bars are omitted for clarity.
Fig. 5
Fig. 5. The differences in the responses of ON vs. OFF RGCs to HFS arise from differences in their depolarization sensitivity as well as the voltage level at which depolarization block occurs in each type.
a The number of spikes elicited in ON (n = 11) and OFF (n = 8) cells from explanted mice retinas as a function of stimulus amplitude of 2000 Hz stimulation. Thin lines indicate the average per cell, and the thick solid lines indicate the average per population. Error bars indicate the standard error of the mean (SEM). b, c Comparisons of peak spike counts (b; p = 0.279, 95% CI [−22.87, 74.41], Cohen’s d value of 0.52) and stimulus amplitudes at which peak responses were elicited, Ipeak, (c; p = 5.51e − 4, 95% CI [10.85, 32.33], Cohen’s d value of 1.97) between the ON and OFF cells. d The induced membrane potential change, ΔVm, as a function of stimulus amplitude. Each line indicates the average per cell, and the circles indicate the breakdown point where the elicited spikes begin to decrease. e, f Comparisons of breakdown ΔVm (E; p = 0.013, 95% CI [1.12, 8.18], Cohen’s d value of 1.29) and sensitivity (F; p = 5.66e − 4, 95% CI [0.07, 0.20], Cohen’s d value of 1.96) between the ON and OFF cells. The sensitivity was defined by breakdown ΔVm divided by the corresponding stimulus amplitude. g For the same dataset used in (a), the number of spikes elicited only during the first 100 ms post-stimulus onset were counted. Error bars indicate the standard error of the mean (SEM).
Fig. 6
Fig. 6. Modeling results closely match the results from physiological experiments.
a Schematic of the stimulation and recording configuration as well as the equivalent electric circuit of the single-compartment model. Stimulation was applied intracellularly by injecting a sinusoidal waveform with the same frequencies used physiologically. b Representative trace of membrane potential over time in response to high-frequency stimulation. c Spiking response is plotted versus the amplitude of the injected current for stimulus rates of 200, 700, and 2000 Hz. d, e Heat maps showing spike counts (d) and ΔVm (e) for all frequency and amplitude combinations tested. Color bars at right.
Fig. 7
Fig. 7. Sodium and potassium channels have different sensitivities to low vs. high-frequency stimulation.
a Artifact-subtracted membrane potential (black) and ΔVm (red) in response to 200 Hz stimulation. The dotted line indicates the resting membrane potential. b Expanded view of the membrane potential in (a), corresponding to one period of the sinusoidal waveform. c Sodium (blue) and potassium (orange) currents correspond to (b). The x-axis applies to both (b) and (c). The total charges transferred through the sodium (qNa) and potassium (qK) channels were calculated by the area under each curve. df Same as (ac) but for 2000 Hz stimulation. (e) and (f) display the traces for the membrane potential and ion currents for 5 ms, corresponding to ten periods of the sinusoidal waveform. In the inset of (f), the logarithmic scale was used on the y-axis to visually accommodate both sodium and potassium currents of which peak values differ by more than one order.
Fig. 8
Fig. 8. Ionic current imbalance leads to differential membrane polarization during HFS.
a For 200 Hz stimulation, sodium (blue), potassium (orange), and the summed (black) charges were plotted as a function of stimulus amplitude. The charge was recorded for a period of 10 ms starting 500 ms after pulse onset. b, c Same as (a) but for 500 (b) and 2000 Hz (c). d ΔVm induced by each stimulus amplitude of 200, 500, and 2000 Hz stimulation is plotted as a function of the summed charge (Pearson’s r value: 0.99).
Fig. 9
Fig. 9. The inactivation of the sodium channel underlies the depolarization block.
a Transition into depolarization block during 2000 Hz stimulation. The black trace represents the membrane potential after artifact-subtracted, while the red line indicates the baseline membrane potential (ΔVm). b Corresponding sodium m and h gating variables (blue and orange, respectively) are plotted over time.
Fig. 10
Fig. 10. Variation in non-monotonic response curves depending on modeling parameters.
ac The spiking responses to 2000 Hz stimulation were simulated using a single-compartment model. While maintaining other parameters consistent with those in Fig. 6, we investigated the impact of changes in cell size (a), potassium channel density (b), and noise level (c) on the response curves. Blue traces indicate standard parameters.

Similar articles

Cited by

References

    1. Cai C, Ren Q, Desai NJ, Rizzo JF, 3rd, Fried SI. Response variability to high rates of electric stimulation in retinal ganglion cells. J. Neurophysiol. 2011;106:153–162. doi: 10.1152/jn.00956.2010. - DOI - PMC - PubMed
    1. Kilgore KL, Bhadra N. Reversible nerve conduction block using kilohertz frequency alternating current. Neuromodulation. 2014;17:254–245. doi: 10.1111/ner.12100. - DOI - PMC - PubMed
    1. Bhadra N, Vrabec TL, Bhadra N, Kilgore KL. Reversible conduction block in peripheral nerve using electrical waveforms. Bioelectron. Med. 2018;1:39–54. doi: 10.2217/bem-2017-0004. - DOI - PMC - PubMed
    1. Patel YA, Butera RJ. Challenges associated with nerve conduction block using kilohertz electrical stimulation. J. Neural Eng. 2018;15:031002. doi: 10.1088/1741-2552/aaadc0. - DOI - PubMed
    1. Patel YA, Butera RJ. Differential fiber-specific block of nerve conduction in mammalian peripheral nerves using kilohertz electrical stimulation. J. Neurophysiol. 2015;113:3923–3929. doi: 10.1152/jn.00529.2014. - DOI - PMC - PubMed

Publication types