. 2024 Sep;56(9):1868-1877.
doi: 10.1038/s41588-024-01785-9. Epub 2024 Jun 18.

Analysis of 10,478 cancer genomes identifies candidate driver genes and opportunities for precision oncology

Affiliations

Analysis of 10,478 cancer genomes identifies candidate driver genes and opportunities for precision oncology

Ben Kinnersley et al. Nat Genet. 2024 Sep.

Abstract

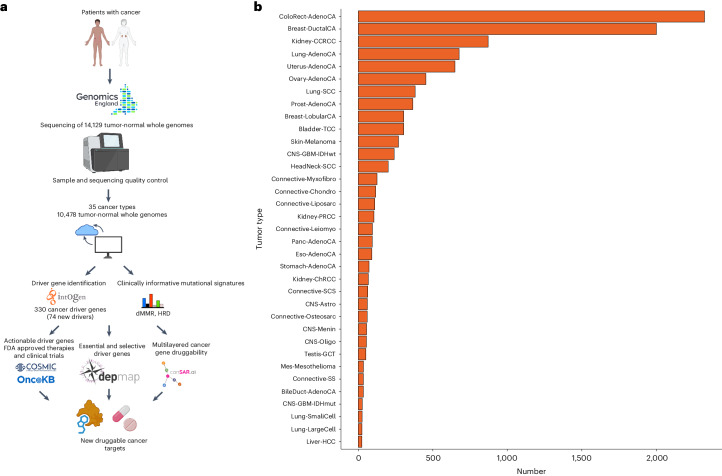
Tumor genomic profiling is increasingly seen as a prerequisite to guide the treatment of patients with cancer. To explore the value of whole-genome sequencing (WGS) in broadening the scope of cancers potentially amenable to a precision therapy, we analysed whole-genome sequencing data on 10,478 patients spanning 35 cancer types recruited to the UK 100,000 Genomes Project. We identified 330 candidate driver genes, including 74 that are new to any cancer. We estimate that approximately 55% of patients studied harbor at least one clinically relevant mutation, predicting either sensitivity or resistance to certain treatments or clinical trial eligibility. By performing computational chemogenomic analysis of cancer mutations we identify additional targets for compounds that represent attractive candidates for future clinical trials. This study represents one of the most comprehensive efforts thus far to identify cancer driver genes in the real world setting and assess their impact on informing precision oncology.


Conflict of interest statement

The authors declare no competing interests.

Figures

Fig. 1
Fig. 1. Study design and number of samples per tumor type included in the analysis.
a, Study design. b, Number of samples per tumor type. BileDuct-AdenoCA, bile duct adenocarcinoma; Bladder-TCC, bladder transitional cell carcinoma; Breast-DuctalCA, breast ductal carcinoma; Breast-LobularCA, breast lobular carcinoma; CNS-Astro, astrocytoma; CNS-GBM-IDHmut, IDH mutated glioblastoma; CNS-GBM-IDHwt, IDH wild-type glioblastoma; CNS-Menin, meningioma; CNS-Oligo, oligodendroglioma; ColoRect-AdenoCA, colorectal adenocarcinoma; Connective-Chondro, chondrosarcoma; Connective-Leiomyo, leiomyosarcoma; Connective-Liposarc, liposarcoma; Connective-Myxofibro, myxofibrosarcoma; Connective-Osteosarc, osteosarcoma; Connective-SCS, spindle cell sarcoma; Connective-SS, synovial sarcoma; Eso-AdenoCA, esophageal adenocarcinoma; HeadNeck-SCC, squamous cell carcinoma of the head and neck; Kidney-CCRCC, clear cell renal cell carcinoma; Kidney-ChRCC, chromophobe renal cell carcinoma; Kidney-PRCC, papillary renal cell carcinoma; Liver-HCC, hepatocellular carcinoma; Lung-AdenoCA, lung adenocarcinoma; Lung-LargeCell, large cell lung cancer; Lung-SCC, squamous cell carcinoma of the lung; Lung-SmallCell, small cell carcinoma of the lung; Mes-Mesothelioma, mesothelioma; Ovary-AdenoCA, ovarian adenocarcinoma; Panc-AdenoCA, pancreatic adenocarcinoma; Prost-AdenoCA, prostate adenocarcinom; Skin-Melanoma, melanoma of the skin; Stomach-AdenoCA, gastric adenocarcinoma; Testis-GCT, testicular germ cell tumor; Uterus-AdenoCA, uterine adenocarcinoma. Fig. 1a created with BioRender.com.
Fig. 2
Fig. 2. Power estimates for driver gene identification per tumor type.
The number of samples needed to achieve 90% power for 90% of genes (y axis). Gray vertical lines indicate exome-wide background mutation rates (x axis). Black dots indicate sample sizes and mutation rates in the current study.
Fig. 3
Fig. 3. Heatmap of candidate cancer driver genes identified in at least two different cancer types.
Heatmap intensity proportional to q value.
Fig. 4
Fig. 4. Distribution and predicted function of candidate cancer driver genes across tumor types.
a, Distribution of driver genes across different types of cancer: y axis, maximal mutational prevalence in a tumor type; x axis, number of tumor types in which the driver gene is identified. Genes labeled are candidate drivers in at least six tumor types or have a maximum mutation prevalence in a tumor type of >17%. b, Distribution of cancer driver gene function associated with each cancer type: y axis, tumor group; x axis, percentage of tumor-specific driver genes.
Fig. 5
Fig. 5. Comparison of driver gene somatic mutation rates between tumor histologies.
Expected mutation rate and 95% confidence intervals of each driver in the cohort (2,306 breast, 440 central nervous system (CNS), 1,045 kidney, 1,110 lung and 607 connective tissue tumors in the 100kGP cohort) based on the number of samples in which the driver gene is mutated for the given tumor histology. Binomial P values are shown. The dashed red line corresponds to a false discovery rate of 0.01.
Fig. 6
Fig. 6. Distribution of clonal and subclonal oncogenic mutations in candidate cancer driver genes.
a, Distribution of clonal oncogenic mutations in candidate cancer driver genes across all cancer types: y axis, percentage of all clonal oncogenic mutations of all oncogenic mutations; x axis, total number of clonal oncogenic mutations. Clonal oncogenic mutations include clonal mutations that occurred before duplications involving the relevant chromosome (early), clonal mutations that occurred after such duplications (late), and mutations that occurred when no duplication was observed. Genes labeled are those with >250 clonal oncogenic mutations or clonal oncogenic mutations represent >95% of all oncogenic mutations. b, Distribution of all subclonal oncogenic mutations in candidate cancer driver genes across all cancer types: y axis, percentage of all subclonal oncogenic mutations of all oncogenic mutations; x axis, total number of subclonal oncogenic mutations. Genes labeled are those with >50 subclonal oncogenic mutations and >5% of all oncogenic mutations as subclonal.
Fig. 7
Fig. 7. Clinical actionability ascribable to each candidate cancer driver gene.
a, Clinical actionability ascribable to each candidate cancer driver gene according to COSMIC by cancer type. Tumors were annotated by the highest scoring gene mutation–indication pairing, with ‘None’ indicating no actionable mutations were detected in the tumor. b, Clinical actionability ascribable to each candidate cancer driver gene according to OncoKB by cancer type. Tumors were annotated by the highest scoring gene mutation–indication pairing, with ‘None’ indicating no actionable mutations were detected in the tumor.
Extended Data Fig. 1
Extended Data Fig. 1. Comparison of number of samples per tumour type in the pan-cancer cohort compared to all cancer diagnosed in England in 2019.
Upper panel: the 100kGP cohort; lower panel: incidence of the different cancer types reported in the general population.
Extended Data Fig. 2
Extended Data Fig. 2. Mutation burden of tumours by each tumour type. The number of samples contributing to each tumour type are shown above the plot.
SNV, single nucleotide variant.
Extended Data Fig. 3
Extended Data Fig. 3. Circos heatmap of candidate cancer driver genes identified.
Heatmap intensity proportional to the q value.
Extended Data Fig. 4
Extended Data Fig. 4. Mutation plots and pfam domain overlap for: (a) EGFR mutations in lung adenocarcinoma and GBM IDH wildtype; (b) PIK3CA mutations in uterine adenocarcinoma and breast ductal carcinoma.
Domain specific mutations were assessed by considering the cancer drivers where smRegions is a significant bidder (Q-value < 0.1) and the driver is annotated in multiple cancer types.
Extended Data Fig. 5
Extended Data Fig. 5. Hierarchical clustering of tumour types based on P-value of candidate driver genes across the 35 different tumour types.
Clustering performed using the hclust function in R.
Extended Data Fig. 6
Extended Data Fig. 6. Per-tumour distribution of oncogenic mutations in tumour specific candidate cancer driver genes, across the 35 cancer types.
Analysis restricted to driver genes as predicted by IntOGen in the given cancer type. Oncogenicity predicted using OncoKB. The line within the box shows the median number of oncogenic mutations per sample in the cancer type. The box represents the interquartile range and whiskers represent the range.
Extended Data Fig. 7
Extended Data Fig. 7. Oncogenic clonal and subclonal mutations across candidate driver genes across all tumor types.
Oncogenic clonal and subclonal mutations across candidate driver genes pan-cancer.
Extended Data Fig. 8
Extended Data Fig. 8. Oncogenic clonal and subclonal mutations across candidate driver genes.
Oncogenic clonal and subclonal mutations across candidate driver genes in: a) Meningioma; b) Large cell lung cancer; c) Testicular germ cell tumour; d) Oligodendroglioma.
Extended Data Fig. 9
Extended Data Fig. 9. Example druggability network for colorectal cancer.
Nodes acting as cancer- specific drivers are shaded purple. Edge visual properties are as follows: OncoKB interactions, red contiguous arrow; Signor interactions, green contiguous arrow; Signor inhibitors, black vertical slash; complex, black zigzag; direct interaction, red solid line; direct X-ray interaction, green solid line; direct non-protein data bank interaction, blue solid line; reaction, blue contiguous arrow; transcriptional interaction, black sinewave. Figure generated using Cytoscape.
Extended Data Fig. 10
Extended Data Fig. 10. Violin plot of estimated tumour purity per cancer type.
Black square within each violin corresponds to the median value. Violin trimmed to the lowest and highest tumour purity estimate per cancer group. Purity estimates from Battenberg or Ccube.

References

    1. Topol, E. J. Individualized medicine from pre-womb to tomb. Cell157, 241–253 (2014). 10.1016/j.cell.2014.02.012 - DOI - PMC - PubMed
    1. Schwartzberg, L., Kim, E. S., Liu, D. & Schrag, D. Precision oncology: who, how, what, when and when not? Am. Soc. Clin. Oncol. Educ. Book37, 160–169 (2017). 10.1200/EDBK_174176 - DOI - PubMed
    1. Stratton, M. R., Campbell, P. J. & Futreal, P. A. The cancer genome. Nature458, 719–724 (2009). 10.1038/nature07943 - DOI - PMC - PubMed
    1. Martínez-Jiménez, F. et al. A compendium of mutational cancer driver genes. Nat. Rev. Cancer20, 555–572 (2020). 10.1038/s41568-020-0290-x - DOI - PubMed
    1. Chakravarty, D. & Solit, D. B. Clinical cancer genomic profiling. Nat. Rev. Genet.22, 483–501 (2021). 10.1038/s41576-021-00338-8 - DOI - PubMed

LinkOut - more resources