. 2024 Jun 18;4(1):120.
doi: 10.1038/s43856-024-00542-7.

Sepsis endotypes identified by host gene expression across global cohorts

Affiliations

Sepsis endotypes identified by host gene expression across global cohorts

Josh G Chenoweth et al. Commun Med (Lond). .

Abstract

Background: Sepsis from infection is a global health priority and clinical trials have failed to deliver effective therapeutic interventions. To address complicating heterogeneity in sepsis pathobiology, and improve outcomes, promising precision medicine approaches are helping identify disease endotypes, however, they require a more complete definition of sepsis subgroups.

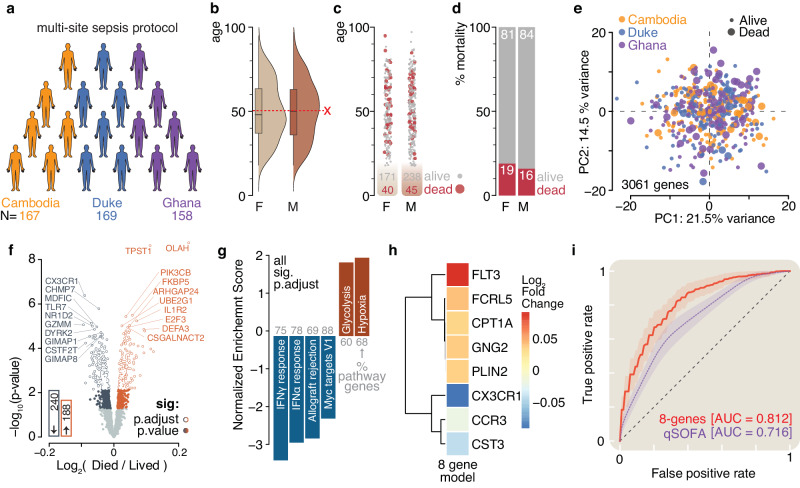
Methods: Here, we use RNA sequencing from peripheral blood to interrogate the host response to sepsis from participants in a global observational study carried out in West Africa, Southeast Asia, and North America (N = 494).

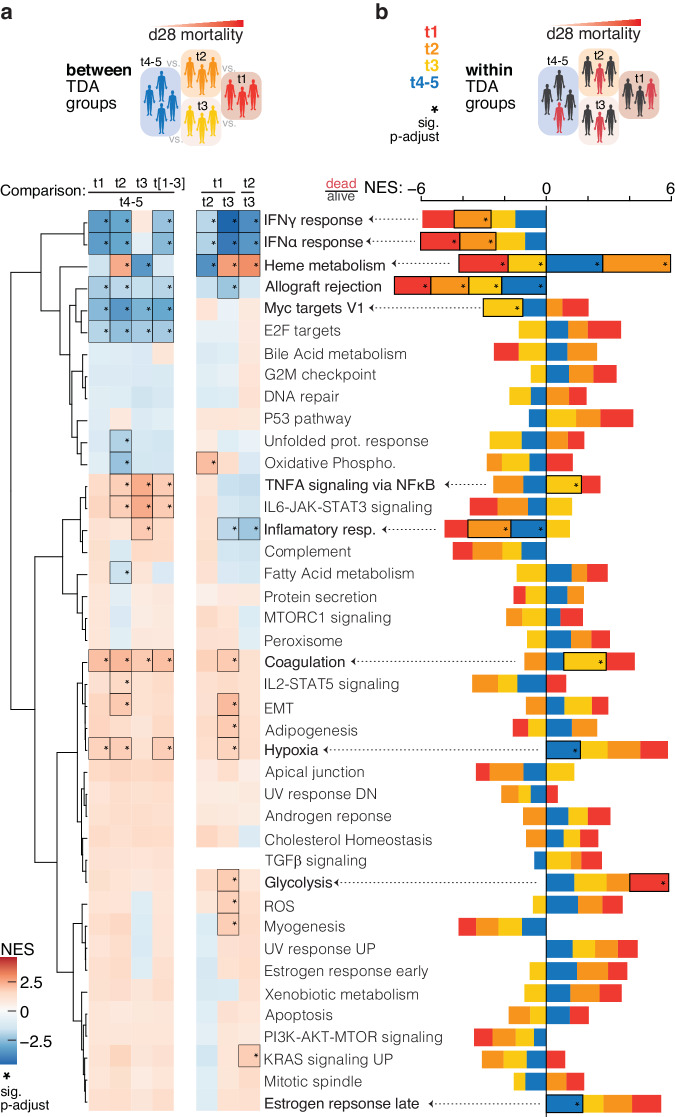
Results: We identify four sepsis subtypes differentiated by 28-day mortality. A low mortality immunocompetent group is specified by features that describe the adaptive immune system. In contrast, the three high mortality groups show elevated clinical severity consistent with multiple organ dysfunction. The immunosuppressed group members show signs of a dysfunctional immune response, the acute-inflammation group is set apart by molecular features of the innate immune response, while the immunometabolic group is characterized by metabolic pathways such as heme biosynthesis.

Conclusions: Our analysis reveals details of molecular endotypes in sepsis that support immunotherapeutic interventions and identifies biomarkers that predict outcomes in these groups.

Plain language summary

Sepsis is a life-threatening multi-organ failure caused by the body’s immune response to infection. Clinical symptoms of sepsis vary from one person to another likely due to differences in host factors, infecting pathogen, and comorbidities. This difference in clinical symptoms may contribute to the lack of effective interventions for sepsis. Therefore, approaches tailored to targeting groups of patients who present similarly are of great interest. This study analysed a large group of sepsis patients with diverse symptoms using laboratory markers and mathematical analysis. We report four patient groups that differ by risk of death and immune response profile. Targeting these defined groups with tailored interventions presents an exciting opportunity to improve the health outcomes of patients with sepsis.


Conflict of interest statement

The authors declare the following competing interests: D.V.C., J.B., J.G.C., and D.A.S. are listed as inventors on a U.S. Provisional Application No. 63/578,492, entitled: “Prediction of Mortality of Patients Diagnosed with Sepsis,” applied for by the Henry M. Jackson Foundation for the Advancement of Military Medicine, Inc., on the identification of molecular endotypes that predict sepsis mortality. E.L.T is an employee and has equity in Danaher. E.L.T and C.W.W have received consulting fees from Biomeme. All other authors have no competing interests to declare.

Figures

Fig. 1
Fig. 1. Experimental design, demographics, and initial prognostic modeling.
a Data for this study was generated from subjects enrolled in three different sites located in Cambodia (orange), Duke (blue) (USA), and Ghana (purple). b The mean and median age were nearly identical (~50 years of age) for each gender (F: female – light tan; M: male – light brown). The median and quartiles are indicated by boxplot and the mean as red dotted lines. c, d The 28-day mortality was also very similarly distributed between genders and averaged a ~ 17% death ratio for the entire study cohort. Red spheres and bar fill indicate patients that died. e Principal component analysis of the 3061 selected genes did not reveal any site-specific or mortality-specific patient clustering. Point color indicates site, and point size indicates mortality. f Volcano plot of differential gene expression analysis comparing subjects that died by day 28 to those that survived. Labels show for top ten most significantly changed genes (p.adjust ≤ 0.05). The bar insert shows a total number of significantly changed genes (p.adjust ≤ 0.05, blue – decrease, red – increase). g Results of gene set enrichment analysis using Molecular Signature Database Hallmark gene data sets show significantly different pathways (p.adjust ≤ 0.05). Numbers in gray show the percentage of pathway coverage. h The 28-day mortality-based log2 fold changes of eight genes were used for prognostic mortality modeling. i Receiver operating characteristic curve showing performance of eight-gene model (AUC = 0.812 ± 0.070) in predicting 28-day mortality relative to the predictive power of quick sepsis-related organ failure assessment (qSOFA, AUC = 0.716 ± 0.075) score. The lightly shaded regions surrounding the curves correspond to 0.5 standard deviations. All modeled curves were generated with repeated stratified k-fold cross-validation described in the methods.
Fig. 2
Fig. 2. Topological Data Analysis of the combined global sepsis cohort.
The normalized expression of the top 1000 genes from 506 subjects was used to perform Topological Data Analysis (TDA). This decomposition method groups patients based on their gene expression profiles and produces a relationship network consisting of nodes (clusters of patients with similar gene expression) and edges (one or more patients are shared between two adjacent nodes). a The sepsis TDA network was divided into four groups along a left-to-right axis, which corresponded to differences in 28-day (d28) mortality. The TDA network was colored by 28-day mortality on a continuous scale ranging from green (0% of patients in the node died) to red (40% or more of patients in the node died). b Patients were stratified into three high-mortality groups (t1, t2, t3) and one low-mortality group (t4-5) (yellow - highlights TDA subgroup; red – indicates mortality).
Fig. 3
Fig. 3. TDA group-specific genes have increased performance versus a clinical tool.
The TDA group-specific feature selection identified a total of thirteen genes for stratified 28-day mortality prognostic. a Heatmap of hierarchically clustered genes in 28-day (d28) mortality comparison across the entire study cohort showing TDA group membership and direction of expression change. b TDA overlay showing expression of two of the biomarker genes across the entire study cohort. TDA groups are indicated with dashed lines and labels. c Receiver operating characteristic curves showing the performance of prognostic classifiers including the eight-gene model (red) based on the entire cohort versus quick sepsis-related organ failure assessment (qSOFA) score (purple), and TDA-stratified models (blue). Lightly shaded areas surrounding the curves correspond to 0.5 standard deviations. All modeled curves were generated with repeated stratified k-fold cross-validation described in the methods.
Fig. 4
Fig. 4. Clinical features distinguish stratified TDA groups.
a Diverse clinical features were evaluated across the TDA network from the combined global cohort plotted as a heatmap. The analysis of variance and statistical group comparisons identify important clinical variables across the TDA network (blue) and between different TDA groups (orange-red) respectively. Only selected clinical parameters recorded for more than >60% of subjects are shown. The white star depicts the significant p-value (≤0.05). b TDA overlays show the distribution of candidate clinical parameters across the cohort and TDA groups in accordance with statistical results. Red and green indicate the maximum and minimum values respectively, while yellow represents the middle of the gradient.
Fig. 5
Fig. 5. Gene-set enrichment comparison of TDA groups and 28-day mortality.
a Heatmap of normalized enrichment values (NES) for the Molecular Signature Database Hallmark pathways comparing TDA groups to each other. The pathways were grouped by unsupervised hierarchical clustering. b Stacked barplot of NES values for the Molecular Signature Database Hallmark pathways comparing patients by 28-day (d28) mortality within TDA groups. Black boxes with star in Fig. 5a and b indicate statistically significant enrichment in gene set enrichment analysis (p.adjust ≤ 0.05). Supplementary Fig. 2d describes the number of patients used in each comparison (dead/alive and pair-wise columns). To perform gene set enrichment analysis against the Molecular Signature Database Hallmark gene data set, for Fig. 5a we used genes with significant log2 fold change values (p.adjust ≤ 0.05), and for Fig. 5b all genes. The TDA groups were colored and shaded as follows: t4-5 – blue; t3 – yellow; t2 - orange; t1 – red.
Fig. 6
Fig. 6. Sepsis endotype model.
TDA network related to outcomes including 28-day mortality and clinical and molecular features observed in different stratified patient groups. Red horizontal arrow indicates 28-day mortality across the TDA network. Small vertical arrows indicate direction of change of specific analyte. Red color indicates increase, while blue indicates decrease.

References

    1. Singer, M. et al. The third international consensus definitions for sepsis and septic shock (sepsis-3). JAMA315, 801 (2016). - PMC - PubMed
    1. Rubio, I. et al. Current gaps in sepsis immunology: new opportunities for translational research. Lancet Infect. Dis. 19, e422–e436 (2019). - PubMed
    1. Opal SM, Cross AS. Clinical trials for severe sepsis: Past failures, and future hopes. Infect. Dis. Clin. North Am. 1999;13:285–297. doi: 10.1016/S0891-5520(05)70075-1. - DOI - PubMed
    1. Carlet, J., Cohen, J., Calandra, T., Opal, S. M. & Masur, H. Sepsis: Time to reconsider the concept. Crit. Care Med. 36, 964–966 (2008). - PubMed
    1. Wong HR, et al. Identification of pediatric septic shock subclasses based on genome-wide expression profiling. BMC Med. 2009;7:34. doi: 10.1186/1741-7015-7-34. - DOI - PMC - PubMed