. 2024 Jun;30(6):1771-1783.
doi: 10.1038/s41591-024-02937-4. Epub 2024 Jun 18.

Plasma extracellular vesicle tau and TDP-43 as diagnostic biomarkers in FTD and ALS

Madhurima Chatterjee #  1 Selcuk Özdemir #  1   2 Christian Fritz  1 Wiebke Möbius  3   4 Luca Kleineidam  1   5 Eckhard Mandelkow  5 Jacek Biernat  5 Cem Doğdu  1 Oliver Peters  6   7 Nicoleta Carmen Cosma  6 Xiao Wang  6 Luisa-Sophia Schneider  6 Josef Priller  6   8   9   10 Eike Spruth  8 Andrea A Kühn  6   11 Patricia Krause  11 Thomas Klockgether  1   12 Ina R Vogt  1 Okka Kimmich  1 Annika Spottke  1   12 Daniel C Hoffmann  1 Klaus Fliessbach  1   5 Carolin Miklitz  1   5 Cornelia McCormick  1   5 Patrick Weydt  1 Björn Falkenburger  13   14 Moritz Brandt  13   14 René Guenther  13   14 Elisabeth Dinter  13   14 Jens Wiltfang  15   16   17 Niels Hansen  15   16 Mathias Bähr  15   18   19 Inga Zerr  15   18 Agnes Flöel  20   21 Peter J Nestor  22   23 Emrah Düzel  22   24   25 Wenzel Glanz  22   24   26 Enise Incesoy  22   24   27 Katharina Bürger  28   29 Daniel Janowitz  29 Robert Perneczky  28   30   31   32 Boris S Rauchmann  30   33   34 Franziska Hopfner  35 Olivia Wagemann  28   35 Johannes Levin  28   31   35 Stefan Teipel  21   36 Ingo Kilimann  21   36 Doreen Goerss  21 Johannes Prudlo  21   37 Thomas Gasser  38   39 Kathrin Brockmann  38   39 David Mengel  38   39 Milan Zimmermann  38   39 Matthis Synofzik  38   39 Carlo Wilke  38   39 Judit Selma-González  40   41 Janina Turon-Sans  41   42 Miguel Angel Santos-Santos  40   43 Daniel Alcolea  40   43 Sara Rubio-Guerra  40   43 Juan Fortea  40   43 Álvaro Carbayo  41   42 Alberto Lleó  40   43 Ricardo Rojas-García  41   42 Ignacio Illán-Gala  40   43 Michael Wagner  1   5 Ingo Frommann  1   5 Sandra Roeske  1 Lucas Bertram  1 Michael T Heneka  44   45 Frederic Brosseron  1 Alfredo Ramirez  1   5   46   47   48 Matthias Schmid  1   49 Rudi Beschorner  38   50 Annett Halle  1   51 Jochen Herms  28   31   52 Manuela Neumann  38   50 Nicolas R Barthélemy  53   54 Randall J Bateman  53   54 Patrizia Rizzu  38 Peter Heutink  38 Oriol Dols-Icardo  40   43 Günter Höglinger  28   31   35 Andreas Hermann  21   55 Anja Schneider  56   57
Affiliations

Plasma extracellular vesicle tau and TDP-43 as diagnostic biomarkers in FTD and ALS

Madhurima Chatterjee et al. Nat Med. 2024 Jun.

Abstract

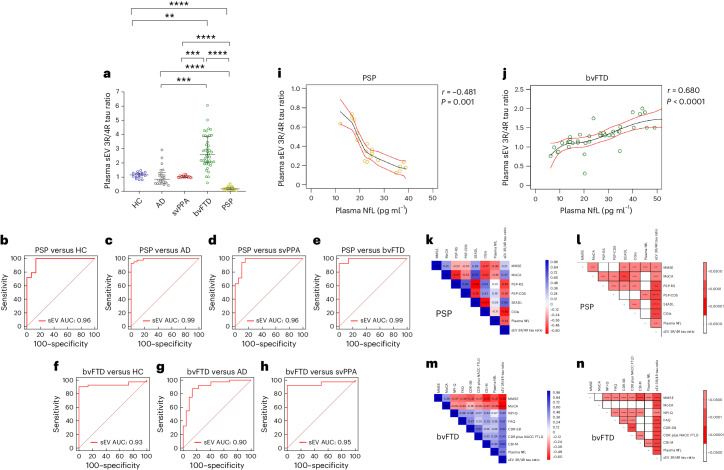
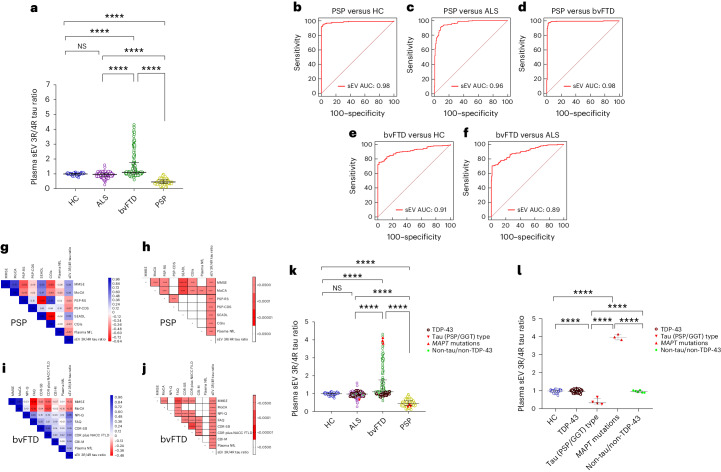
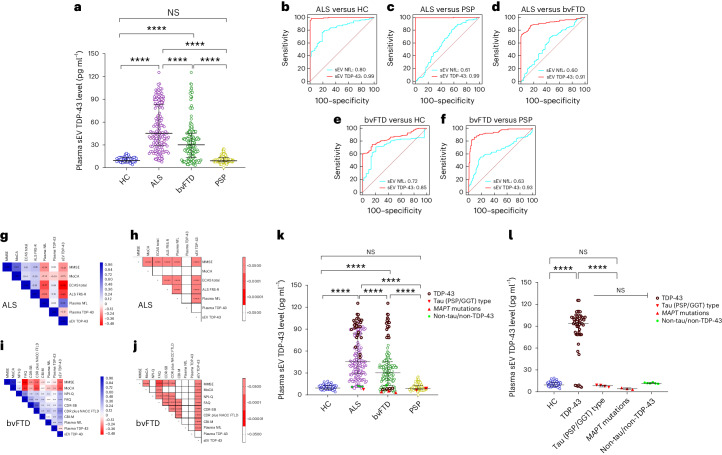
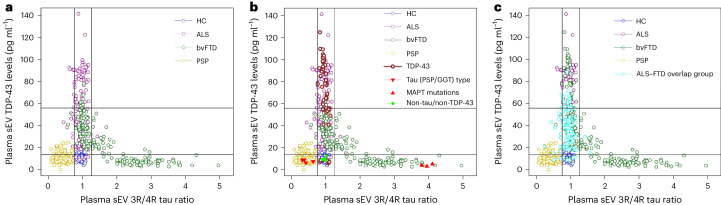
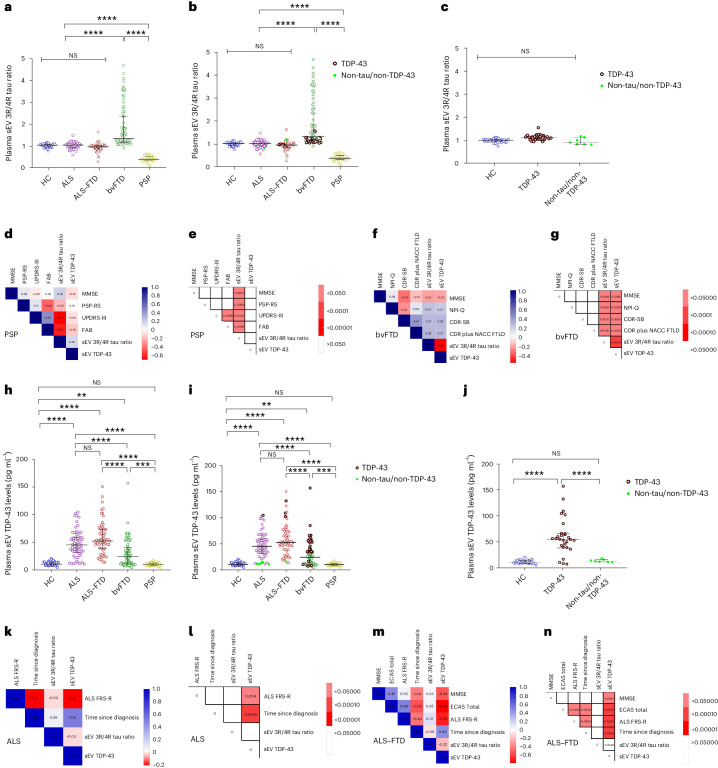
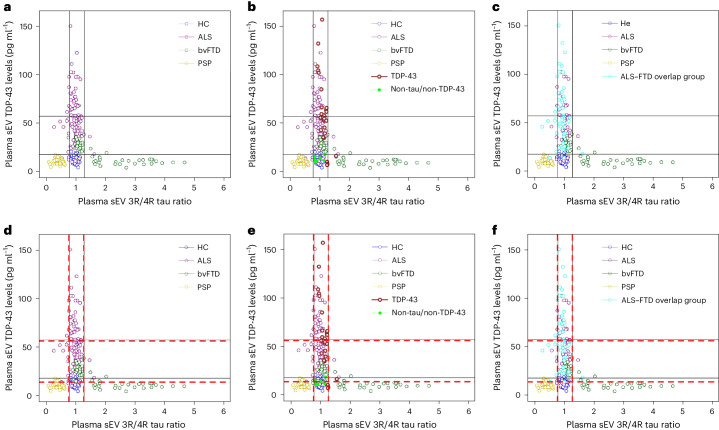
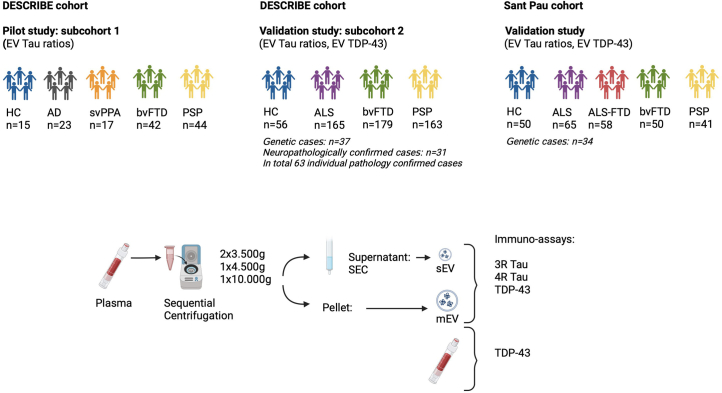
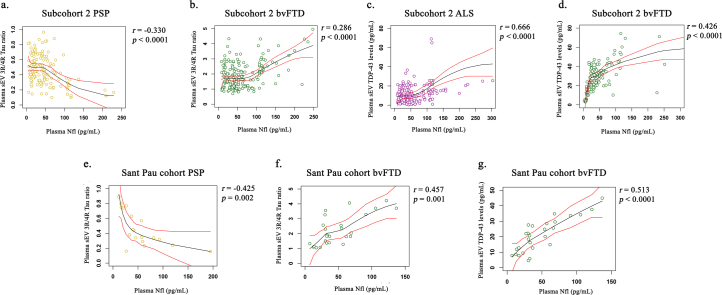
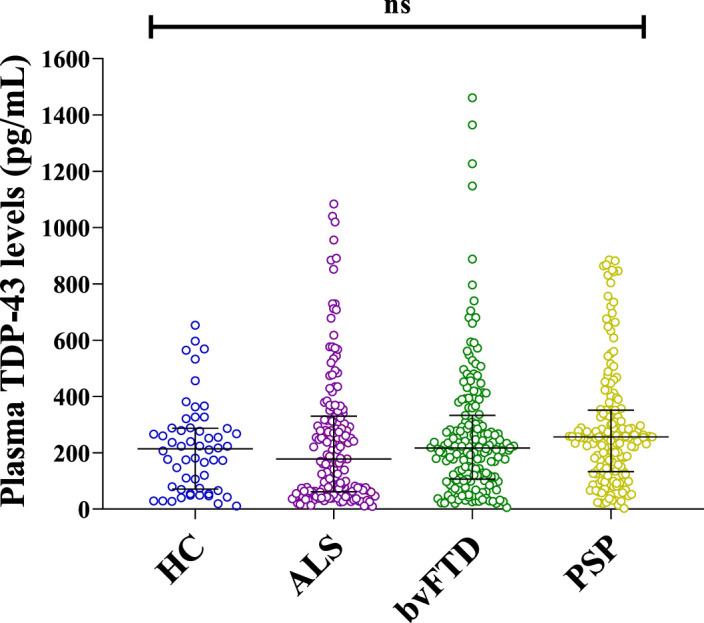
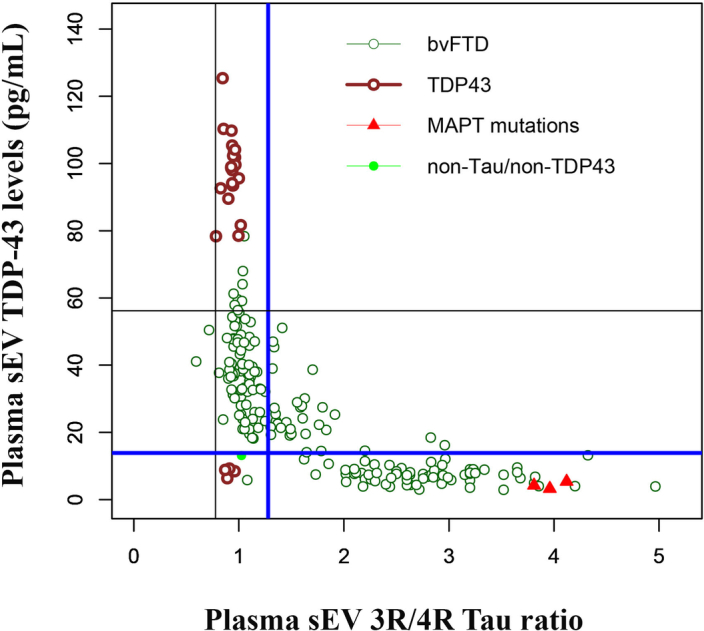
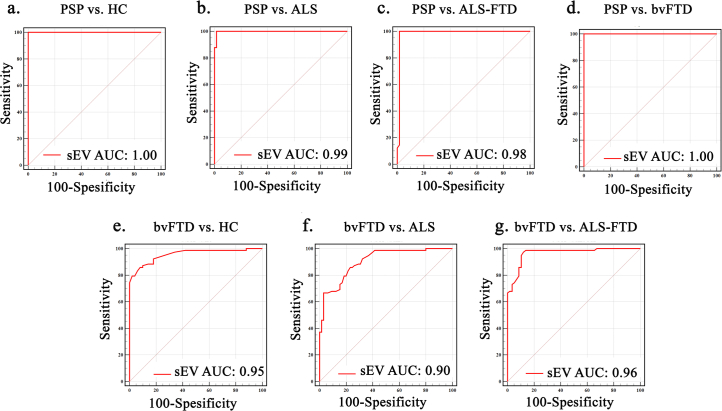
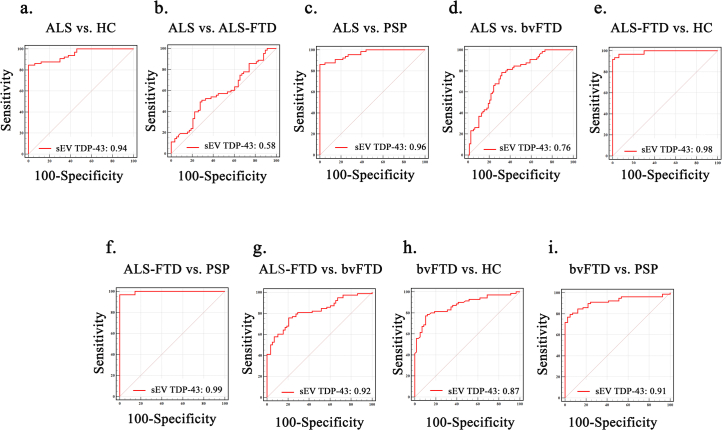
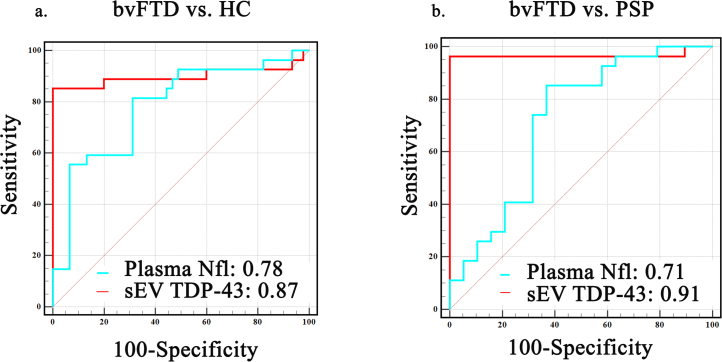
Minimally invasive biomarkers are urgently needed to detect molecular pathology in frontotemporal dementia (FTD) and amyotrophic lateral sclerosis (ALS). Here, we show that plasma extracellular vesicles (EVs) contain quantifiable amounts of TDP-43 and full-length tau, which allow the quantification of 3-repeat (3R) and 4-repeat (4R) tau isoforms. Plasma EV TDP-43 levels and EV 3R/4R tau ratios were determined in a cohort of 704 patients, including 37 genetically and 31 neuropathologically proven cases. Diagnostic groups comprised patients with TDP-43 proteinopathy ALS, 4R tauopathy progressive supranuclear palsy, behavior variant FTD (bvFTD) as a group with either tau or TDP-43 pathology, and healthy controls. EV tau ratios were low in progressive supranuclear palsy and high in bvFTD with tau pathology. EV TDP-43 levels were high in ALS and in bvFTD with TDP-43 pathology. Both markers discriminated between the diagnostic groups with area under the curve values >0.9, and between TDP-43 and tau pathology in bvFTD. Both markers strongly correlated with neurodegeneration, and clinical and neuropsychological markers of disease severity. Findings were replicated in an independent validation cohort of 292 patients including 34 genetically confirmed cases. Taken together, the combination of EV TDP-43 levels and EV 3R/4R tau ratios may aid the molecular diagnosis of FTD, FTD spectrum disorders and ALS, providing a potential biomarker to monitor disease progression and target engagement in clinical trials.


Conflict of interest statement

All authors had access to the data in the study and accepted responsibility for submitting the paper for publication. A. Schneider serves in a scientific advisory board for and receives honoraria from Biogen. She additionally received funding for a scientific collaboration from Eisai and honoraria for presentations from Eisai. M.C. is currently an employee of uniQure Biopharma B.V. and recipient of employee stock options. F.H. receives author fees from Thieme medical publishers and W. Kohlhammer GmbH medical publishers. P.H. is an employee and owns stock in Alector LLC. K. Brockmann is a consultant for F. Hoffmann-La Roche Ltd, Vanqua Bio and the Michael J. Fox Foundation for Parkinson’s Research and has received speaker honoraria from AbbVie, Lundbeck, UCB (Union Chimique Belge) and Zambon. N.H. has received travel support from Eli Lilly. A. Hermann has received honoraria for presentations and participation in advisory boards from Amylyx and IFT Pharma. He has received royalities from Elsevier Press and Kohlhammer. Washington University and R.J.B. have equity ownership interest in C2N Diagnostics and R.J.B. receives income from C2N Diagnostics for serving on the scientific advisory board. R.J.B. and N.R.B. may receive income based on technology (methods to detect microtubule binding region (MTBR) tau isoforms and use thereof) licensed by Washington University to C2N Diagnostics. R.J.B. has received research funding from Avid Radiopharmaceuticals, Janssen, Roche/Genentech, Eli Lilly, Eisai, Biogen, AbbVie, Bristol Myers Squibb and Novartis. R.J.B. serves on the Roche Gantenerumab Steering Committee as an unpaid member. R.G. received speaker fees and nonfinancial support from Biogen, Roche, Zambon and research support from Biogen, ITF Pharma and Zambon outside this work. D.A. participated in advisory boards from Fujirebio-Europe, Roche Diagnostics, Grifols S.A. and Lilly, and received speaker honoraria from Fujirebio-Europe, Roche Diagnostics, Nutricia, Krka Farmacéutica S.L., Zambon S.A.U. and Esteve Pharmaceuticals S.A. D.A. declares a filed patent application (WO2019175379 A1 Markers of synaptopathy in neurodegenerative disease). J.W. received lecture honoraria from Beeijing Yibai Science and Technology Ltd, Gloryren, Janssen Cilag, Pfizer, Med Update GmbH, Roche Pharma, Lilly and serves on advisory boards for Biogen, Abbott, Boehringer Ingelheim, Lilly, MSD Sharp & Dohme and Roche. M. Brandt received speaker honoraria from Idorsia, Eisai and Bristol Myers Squibb. All other authors state no competing interests.

Figures

Fig. 1
Fig. 1. 3R/4R tau ratio in plasma sEV in DESCRIBE subcohort 1.
a, The long horizontal line represents the median and the short horizontal lines represent the IQR. Kruskal–Wallis test with Dunn’s correction for multiple comparisons. (HC versus bvFTD P = 0.0003, HC versus PSP P = 0.0000044, AD versus bvFTD P = 0.0003, AD versus PSP P = 0.0000052, svPPA versus bvFTD P = 0.0007, svPPA versus PSP P = 0.0000057, bvFTD versus PSP P = 0.0000019; *P < 0.05, **P < 0.001, ***P < 0.0001, ****P < 0.00001. Biologically independent samples: HC n = 15, AD n = 23, svPPA n = 17, bvFTD n = 42, PSP n = 44. bh, ROC curve for sEV 3R/4R tau ratio in PSP versus HC (b), PSP versus AD (c), PSP versus svPPA (d), PSP versus bvFTD (e), bvFTD versus HC (f), bvFTD versus AD (g) and bvFTD versus svPPA (h). i,j, Two-tailed Spearman correlation analysis of associations and monotonic regression splines between sEV 3R/4R ratio and plasma NfL levels within PSP (i) and bvFTD (j) (P = 0.00009) diagnostic groups. kn, Correlation matrix depicting results of two-tailed Spearman correlations, visualized by plotting strength of correlation (r) as a heat map along with P values (right): PSP (k,l) and bvFTD (m,n). PSP: MoCA, PSP-RS, PSP-CDS, SEADL, CGI-s; PSP-SS, MDS-UPDRS Part III, SAS and the PSP-QoL (Supplementary Fig. 7a,b and Supplementary Table 5). bvFTD: MMSE, MoCa, FAQ, CDR-SB, CDR plus NACC FTLD, previously termed CDR-SB FTD, NPI-Q and CBI-M.
Fig. 2
Fig. 2. 3R/4R tau ratio in plasma sEV in DESCRIBE subcohort 2.
a, Horizontal lines indicate median and IQR. Kruskal–Wallis test with Dunn’s correction for multiple comparisons. HC versus bvFTD P = 0.0000057, HC versus PSP P = 0.000009, ALS versus bvFTD P = 0.0000074, ALS versus PSP P = 0.0000023, bvFTD versus PSP P = 0.0000067; ****P < 0.00001. Biologically independent samples: HC n = 56, ALS n = 165, bvFTD n = 179, PSP n = 163. bf, ROC curve for plasma sEV 3R/4R tau ratio: PSP versus HC (b), PSP versus ALS (c), PSP versus bvFTD (d), bvFTD versus HC (e) and bvFTD versus ALS (f). gj, Correlation matrix depicting the results of two-sided Spearman correlations, visualized by plotting strength of correlation (r) as a heat map along with P values (right): PSP (g,h) and bvFTD (i,j). k,l, 3R/4R tau ratio in plasma-derived sEV in genetically (n = 37) or autopsy-confirmed (n = 31) cases from DESCRIBE subcohort 2 (total number of individual cases n = 63, 5 of these cases had both genetic and neuropathological diagnosis). k, sEV 3R/4R tau ratios in the different pathology groups, stratified by clinical diagnosis. HC versus bvFTD P = 0.0000052, HC versus PSP P = 0.0000012, ALS versus bvFTD P = 0.0000097, ALS versus PSP P = 0.0000056, bvFTD versus PSP P = 0.0000041; ****P < 0.00001. l, sEV 3R/4R tau ratios of the different pathology groups, independent of clinical diagnostic group. The long horizontal line represents the median and the short horizontal lines represent the IQR. Kruskal–Wallis test with Dunn’s correction for multiple comparisons. HC versus tau (PSP/GGT)-type P = 0.000007, HC versus MAPT mutations P = 0.0000063, tau(PSP/GGT)-type versus MAPT mutations P = 0.000004, tau(PSP/GGT)-type versus non-tau/non-TDP-43 P = 0.0000078, MAPT mutations versus non-tau/non-TDP-43 P = 0.0000041; ****P < 0.00001. TDP-43 pathology group: bvFTD (C9orf72 (n = 13), GRN (n = 4), VCP (n = 4), TBK-1 (n = 2)); ALS (C9orf72 (n = 5)); neuropathological diagnosis (FTLD-TDP (n = 1)); ALS-TDP (n = 17), ALS-FTLD-TDP (n = 6)). PSP/GGT-type tau pathology group: neuropathological diagnosis ((PSP-tau (n = 3); FTLD-tau GGT-type (n = 1)). bvFTD MAPT mutations (MAPT P301L (n = 1), MAPT P364S (n = 1), MAPT IVS10+16C>T (n = 1)). Non-tau/non-TDP-43 pathology group: ALS (SOD-1 (n = 2); FUS (n = 2); CHCHD10 (n = 1)); bvFTD (CHCHD10 (n = 1)).
Fig. 3
Fig. 3. TDP-43 levels in plasma sEV in DESCRIBE subcohort 2.
a, The long horizontal line represents the median and the short horizontal lines represent IQR. Kruskal–Wallis test with Dunn’s correction for multiple comparisons. HC versus ALS P = 0.000003, HC versus bvFTD P = 0.000006, ALS versus bvFTD P = 0.0000074, ALS versus PSP P = 0.0000028, bvFTD versus PSP P = 0.0000012; ****P < 0.00001. Biologically independent samples: HC n = 56, ALS n = 165, bvFTD n = 179 and PSP n = 163. bf, ROC curve for sEV TDP-43 (red) and plasma NfL (blue): ALS versus HC (b), ALS versus PSP (c), ALS versus bvFTD (d), bvFTD versus HC (e) and bvFTD versus PSP (f). gj, Correlation matrix depicting results of two-sided Spearman correlations, visualized by plotting strength of correlation (r) as a heat map along with P values (right). ALS (g,h) and bvFTD (i,j). TDP-43 in plasma sEV in genetically (n = 37) or autopsy-confirmed (n = 31) cases from the DESCRIBE subcohort 2 (total number of individual cases: n = 63, 5 of which had both genetic and neuropathological diagnoses). k, sEV TDP-43 in the different pathology groups, stratified by clinical diagnosis. HC versus ALS P = 0.000003, HC versus bvFTD P = 0.000006, ALS versus bvFTD P = 0.0000074, ALS versus PSP P = 0.0000028, bvFTD versus PSP P = 0.0000012; ****P < 0.00001. l, sEV TDP-43 concentrations in the different pathology groups, independent of clinical diagnostic group. The long horizontal line represents the median and the short horizontal lines represent the IQR. Kruskal–Wallis test with Dunn’s correction for multiple comparisons. HC versus TDP-43 P = 0.000008, TDP-43 versus tau (PSP/GGT)-type P = 0.000006, TDP-43 versus MAPT mutations P = 0.0000035, TDP-43 versus non-tau/non-TDP-43 P = 0.0000039; ****P < 0.00001. TDP-43 pathology group: bvFTD (C9orf72 (n = 13), GRN (n = 4), VCP (n = 4), TBK1 (n = 2)); ALS (C9orf72 (n = 5)); neuropathological diagnosis (FTLD-TDP (n = 1); ALS-TDP (n = 17), ALS-FTLD-TDP (n = 6)). PSP/GGT-type tau pathology group: neuropathological diagnosis (PSP-tau (n = 3); FTLD-tau GGT-type (n = 1)). bvFTD MAPT mutations: MAPT P301L (n = 1), MAPT P364S (n = 1), MAPT IVS10+16C>T (n = 1). Non-tau/non-TDP-43 pathology group: ALS (SOD-1 (n = 2); FUS (n = 2); CHCHD10 (n = 1)); bvFTD (CHCHD10 (n = 1)).
Fig. 4
Fig. 4. Distribution of plasma sEV 3R/4R tau ratio versus plasma EV TDP-43 levels stratified by diagnosis in DESCRIBE subcohort 2.
a, Subcohort 2 without pathology-confirmed cases. Color codes indicate the different clinical diagnostic groups (ALS, bvFTD, PSP, HC). Cut-off values were determined by Gaussian mixture modeling. EV 3R/4R tau ratio cut-offs: 0.77 and 1.28; EV TDP-43 cut-offs: 13.87 pg ml−1 and 56.18 pg ml−1. b, Genetically or neuropathologically confirmed cases were also plotted. c, The ALS–FTD overlap group (ALS with FTD (ALS–FTD), ALS patients with cognitive impairment and ALS patients with behavioral impairment) is indicated in light blue.
Fig. 5
Fig. 5. 3R/4R tau ratio in plasma sEVs in the Sant Pau cohort.
a, Stratified by clinical diagnosis. Horizontal lines indicate the median and IQR. Kruskal–Wallis test with Dunn’s correction for multiple comparisons. HC versus bvFTD P = 0.000009, HC versus PSP P = 0.000007, ALS versus bvFTD P = 0.0000091, ALS versus PSP P = 0.0000016, ALS–FTD versus bvFTD P = 0.0000074, ALS–FTD versus PSP P = 0.0000041, bvFTD versus PSP P = 0.000006; ****P < 0.00001. Biologically independent samples: HC n = 50, ALS n = 65, ALS–FTD n = 58, bvFTD n = 50 (+23 mutation carriers), PSP n = 41. b,c, sEV 3R/4R tau ratios in plasma-derived sEV in genetic cases from Sant Pau cohort (n = 34 genetic cases) stratified by clinical diagnosis (b), HC versus bvFTD P = 0.000009, HC versus PSP P = 0.000007, ALS versus bvFTD P = 0.0000091, ALS versus PSP P = 0.0000016, ALS–FTD versus bvFTD P = 0.0000074, ALS–FTD versus PSP P = 0.0000041, bvFTD versus PSP P = 0.000006; ****P < 0.00001; and stratified by associated molecular pathology and independent from clinical diagnosis (c). The long horizontal line represents the median and the short horizontal lines represent the IQR. Kruskal–Wallis test with Dunn’s correction for multiple comparisons. HC versus TDP-43 P = 0.758, HC versus non-tau/non-TDP-43 P = 0.632, TDP-43 versus non-tau/non-TDP-43 P = 0.425; NS, not significant. TDP-43 pathology group: bvFTD (C9orf72 (n = 12), GRN (n = 6), TARDP (n = 1), VCP (n = 1), TBK-1 (n = 3)); ALS (C9orf72 (n = 3)); ALS–FTD (C9orf72 (n = 1)). Non-tau/non-TDP-43 pathology group: ALS (SOD-1 (n = 3)); FUS (n = 3); ALS–FTD (SOD-1 (n = 1)). d,e, Correlation matrix depicting results of two-sided Spearman correlations in the PSP group, visualized by plotting strength of correlation (r) as a heat map (d) along with P values (e). f,g, Correlation matrix depicting results of two-sided Spearman correlations in the bvFTD group, visualized by plotting strength of correlation (r) as a heat map (f) along with P values (g). h, TDP-43 levels in plasma sEV of the Sant Pau cohort stratified by clinical diagnosis. The long horizontal line represents the median and the short horizontal lines represent the IQR. Kruskal–Wallis test with Dunn’s correction for multiple comparisons. HC versus ALS P = 0.0000075, HC versus ALS–FTD P = 0.0000046, ALS versus bvFTD P = 0.00074, HC versus PSP P = 0.578, ALS versus bvFTD P = 0.000009, ALS versus PSP P = 0.000007, ALS–FTD versus bvFTD P = 0.0000043, ALS–FTD versus PSP P = 0.0000055, bvFTD versus PSP P = 0.0005; *P < 0.05, **P < 0.001, ***P < 0.0001, ****P < 0.00001. Biologically independent samples: HC n = 50, ALS n = 65, ALS–FTD n = 58, bvFTD n = 50 (+23 mutations), PSP n = 41. i,j, Plasma sEV TDP-43 concentrations in genetic cases of the Sant Pau cohort (n = 34 genetic cases) stratified by clinical diagnosis (i), HC versus ALS P = 0.0000075, HC versus ALS–FTD P = 0.0000046, ALS versus bvFTD P = 0.00074, HC versus PSP P = 0.578, ALS versus bvFTD P = 0.000009, ALS versus PSP P = 0.000007, ALS–FTD versus bvFTD P = 0.0000043, ALS–FTD versus PSP P = 0.0000055, bvFTD versus PSP P = 0.0005; and stratified by molecular pathology, independent of clinical diagnosis (j). The long horizontal line represents the median and the short horizontal lines represent the IQR. Kruskal–Wallis test with Dunn’s correction for multiple comparisons. HC versus TDP-43 P = 0.0000063, HC versus non-tau/non-TDP-43 P = 0.541, TDP-43 versus non-tau/non-TDP-43 P = 0.0000051; ****P < 0.00001. TDP-43 pathology group: bvFTD (C9orf72 (n = 12), GRN (n = 6), TARDP (n = 1), VCP (n = 1), TBK-1 (n = 3)); ALS (C9orf72 (n = 3)); ALS–FTD C9orf72 (n = 1). Non-tau/non-TDP-43 pathology group: ALS (SOD-1 (n = 3); FUS (n = 3)); ALS–FTD (SOD-1 (n = 1)). k,i, Correlation matrix depicting results of two-sided Spearman correlations in the ALS group, visualized by plotting strength of correlation (r) as a heat map (k) along with P values (i). ALS-FRS (sEV: r = −0.212), P = 0.015 and time since diagnosis/disease duration (sEV: r = 0.514, P = 0.0004). n,m, Correlation matrix depicting results of two-sided Spearman correlations in the ALS−FTD group, visualized by plotting strength of correlation (r) as a heat map (m) along with P values (n). ALS-FRS (sEV: r = −0.702), P = 0.0002 and time since diagnosis/disease duration (sEV: r = 0.445, P = 0.0005); MMSE (sEV: r = −0.535, P = 0.018).
Fig. 6
Fig. 6. Distribution of plasma sEV 3R/4R tau ratio versus plasma EV TDP-43 levels stratified by diagnosis in the Sant Pau cohort.
a, Sant Pau cohort without pathology-confirmed cases. Color codes indicate the different clinical diagnostic groups (ALS, bvFTD, PSP, HC). Cut-off values as determined by Gaussian mixture modeling. EV 3R/4R tau ratio cut-offs: 0.78 and 1.28; EV TDP-43 cut-offs: 17.85 pg ml−1 and 57.34 pg ml−1. b, Genetically confirmed cases were also plotted in the graph. c, The ALS–FTD overlap group is indicated in light blue. df, Sant Pau cohort without pathology-confirmed cases (d), Sant Pau cohort including pathology-confirmed cases (e) and Sant Pau cohort, ALS–FTD group indicated in light blue (f). Similar to ac but superimposed with Sant Pau and DESCRIBE cut-offs. The black solid line indicates Sant Pau cut-offs (EV 3R/4R tau ratio cut-offs: 0.78 and 1.28; EV TDP-43 cut-offs: 17.85 pg ml−1 and 57.34 pg ml−1). The red dashed line indicates DESCIRBE subcohort 2 cut-offs (EV 3R/4R tau ratio cut-offs: 0.77 and 1.28; EV TDP-43 cut-offs: 13.87 pg ml−1 and 56.18 pg ml−1).
Extended Data Fig. 1
Extended Data Fig. 1. Study Design.
Pilot study with samples from the DESCRIBE cohort (subcohort 1): HC, AD, svPPA, bvFTD, PSP groups, based on clinical diagnosis and supported by CSF biomarkers in AD; detection of plasma EV 3R/4R Tau. Validation study in the larger DESCRIBE subcohort 2, comprising samples of the DESCRIBE cohort with HC, ALS, bvFTD and PSP groups and 63 pathology confirmed samples: detection of plasma EV 3R/4R Tau ratios, plasma EV TDP-43 levels, and plasma TDP-43 concentrations. Validation of plasma EV Tau ratios, and plasma EV TDP-43 levels in the independent Sant Pau cohort, including HC, ALS, ALS-FTD, bvFTD, and PSP as diagnostic groups with altogether 34 genetically confirmed samples. Lower panel: Experimental flow of sEV and mEV preparation. This figure was created using BioRender.com.
Extended Data Fig. 2
Extended Data Fig. 2. Correlation of plasma EV Tau ratio with NfL in DESCRIBE cohort 2 and Sant Pau cohort.
(a-d) Two-sided Spearman correlation analysis of associations and monotonic regression splines between plasma sEV 3R/4R Tau ratios and plasma Nfl levels in (a) PSP (p = 0.000012) and (b) bvFTD (p = 0.000051) diagnostic groups. Spearman correlation analysis of associations and monotonic regression splines between plasma sEV TDP-43 levels and plasma Nfl levels in (c) ALS (p = 0.000046) and (d) bvFTD (p = 0.000063). (e-g) Sant Pau cohort: Spearman correlation analysis of associations and monotonic regression splines between plasma sEV 3R/4R Tau ratio and plasma Nfl levels in (e) PSP and (f) bvFTD. Spearman correlation analysis of associations and monotonic regression splines between plasma sEV TDP-43 and plasma Nfl levels in (g) bvFTD (p = 0.000085). (NfL measurements were only available for a subset of Sant Pau cases).
Extended Data Fig. 3
Extended Data Fig. 3. Plasma TDP-43 levels in DESCRIBE subcohort 2.
(biologically independent samples: HC n = 56, ALS n = 165, bvFTD n = 179, PSP n = 163). The long horizontal line represents the median and the short horizontal lines represent the inter-quartile range (IQR) Kruskal–Wallis test with Dunn’s correction for multiple comparisons. ns: non-significant.
Extended Data Fig. 4
Extended Data Fig. 4. Plasma sEV 3R/4R Tau ratio versus plasma EV TDP-43 levels in bvFTD cases of DESCRIBE subcohort 2.
Genetically or neuropathologically defined bvFTD cases are indicated by the different color-codes. Cut-off values as determined by Gaussian mixture modeling for subcohort 2 (Fig. 4, Supplementary Fig. 15). The two cut-offs for separation of bvFTD into putative TDP-43 and Tau pathology groups are indicated by bold blue lines (sEV 3R/4R Tau ratio cut-off: 1.27; sEV TDP-43 cut-off: 13.87 pg/ml).
Extended Data Fig. 5
Extended Data Fig. 5. Sant Pau cohort, Receiver Operating Characteristic (ROC) curves for plasma sEV 3R/4R Tau ratios.
(a) PSP vs. HC (b) PSP vs. ALS (c) PSP vs. ALS-FTD (d) PSP vs. bvFTD (e) bvFTD vs. HC (f) bvFTD vs. ALS (g) bvFTD vs. ALS-FTD.
Extended Data Fig. 6
Extended Data Fig. 6. Receiver Operating Characteristic (ROC) curve with AUC values for plasma sEV TDP-43 in Sant Pau cohort.
(a) ALS vs. HC (b) ALS vs. ALS-FTD (c) ALS vs. PSP (d) ALS vs. bvFTD (e) ALS-FTD vs. HC (f) ALS-FTD vs. PSP (g) ALS-FTD vs. bvFTD (h) bvFTD vs. HC (i) bvFTD vs. PSP.
Extended Data Fig. 7
Extended Data Fig. 7. Receiver Operating Characteristic (ROC) curve with AUC values for plasma sEV TDP-43 (red) and plasma NfL (blue) in the Sant Pau cohort.
(a) bvFTD vs. HC and (b) bvFTD vs. PSP. Plasma NfL levels were not available for ALS and ALS-FTD groups.

Comment in

Similar articles

Cited by

References

    1. Abramzon YA, Fratta P, Traynor BJ, Chia R. The overlapping genetics of amyotrophic lateral sclerosis and frontotemporal dementia. Front. Neurosci. 2020;14:42. doi: 10.3389/fnins.2020.00042. - DOI - PMC - PubMed
    1. Chare L, et al. New criteria for frontotemporal dementia syndromes: clinical and pathological diagnostic implications. J. Neurol. Neurosurg. Psychiatry. 2014;85:865–870. doi: 10.1136/jnnp-2013-306948. - DOI - PubMed
    1. Mann DMA, Snowden JS. Frontotemporal lobar degeneration: pathogenesis, pathology and pathways to phenotype. Brain Pathol. 2017;27:723–736. doi: 10.1111/bpa.12486. - DOI - PMC - PubMed
    1. Mandelkow E, Mandelkow EM. Microtubules and microtubule-associated proteins. Curr. Opin. Cell Biol. 1995;7:72–81. doi: 10.1016/0955-0674(95)80047-6. - DOI - PubMed
    1. Mackenzie IR, Neumann M. Molecular neuropathology of frontotemporal dementia: insights into disease mechanisms from postmortem studies. J. Neurochem. 2016;138:54–70. doi: 10.1111/jnc.13588. - DOI - PubMed

MeSH terms