

A new biostimulant derived from soybean by-products enhances plant tolerance to abiotic stress triggered by ozone
- PMID: 38890606
- PMCID: PMC11186251
- DOI: 10.1186/s12870-024-05290-3
A new biostimulant derived from soybean by-products enhances plant tolerance to abiotic stress triggered by ozone
Abstract
Background: Tropospheric ozone is an air pollutant that causes negative effects on vegetation, leading to significant losses in crop productivity. It is generated by chemical reactions in the presence of sunlight between primary pollutants resulting from human activity, such as nitrogen oxides and volatile organic compounds. Due to the constantly increasing emission of ozone precursors, together with the influence of a warming climate on ozone levels, crop losses may be aggravated in the future. Therefore, the search for solutions to mitigate these losses becomes a priority. Ozone-induced abiotic stress is mainly due to reactive oxygen species generated by the spontaneous decomposition of ozone once it reaches the apoplast. In this regard, compounds with antioxidant activity offer a viable option to alleviate ozone-induced damage. Using enzymatic technology, we have developed a process that enables the production of an extract with biostimulant properties from okara, an industrial soybean byproduct. The biostimulant, named as OEE (Okara Enzymatic Extract), is water-soluble and is enriched in bioactive compounds present in okara, such as isoflavones. Additionally, it contains a significant fraction of protein hydrolysates contributing to its functional effect. Given its antioxidant capacity, we aimed to investigate whether OEE could alleviate ozone-induced damage in plants. For that, pepper plants (Capsicum annuum) exposed to ozone were treated with a foliar application of OEE.
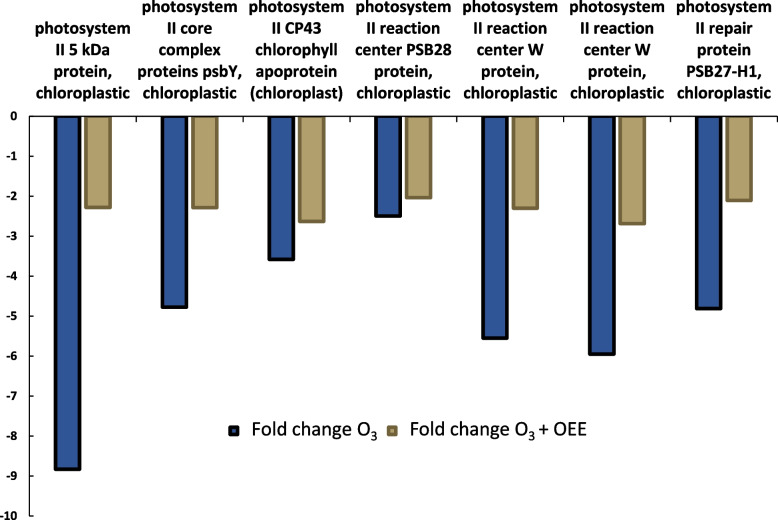
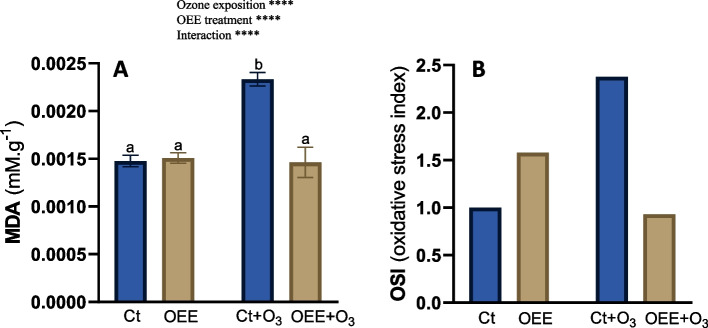
Results: OEE mitigated ozone-induced damage, as evidenced by the net photosynthetic rate, electron transport rate, effective quantum yield of PSII, and delayed fluorescence. This protection was confirmed by the level of expression of genes associated with photosystem II. The beneficial effect was primarily due to its antioxidant activity, as evidenced by the lipid peroxidation rate measured through malondialdehyde content. Additionally, OEE triggered a mild oxidative response, indicated by increased activities of antioxidant enzymes in leaves (catalase, superoxide dismutase, and guaiacol peroxidase) and the oxidative stress index, providing further protection against ozone-induced stress.
Conclusions: The present results support that OEE protects plants from ozone exposure. Taking into consideration that the promotion of plant resistance against abiotic damage is an important goal of biostimulants, we assume that its use as a new biostimulant could be considered.
Keywords: Biostimulant; Capsicum; Enzymatic extract; Okara; Ozone; ROS.
© 2024. The Author(s).
Conflict of interest statement
The authors declare no competing interests.
Figures


References
-
- Avnery S, Mauzerall DL, Liu J, Horowitz LW. Global crop yield reductions due to surface ozone exposure: 2. Year 2030 potential crop production losses and economic damage under two scenarios of O3 pollution. Atmos Environ. 2011;45:2297–309. doi: 10.1016/j.atmosenv.2011.01.002. - DOI
-
- IPPC. Climate Change2001: TheScientific Basis. Contribution of Working Group I to theThird Assessment Report of the Intergovernmental Panel on Climate Change. Cambridge Univ Press Cambridge, UK. 2001.
-
- Sicard P, Anav A, De Marco A, Paoletti E. Projected global ground-level ozone impacts on vegetation under different emission and climate scenarios. Atmos Chem Phys. 2017;17:12177–12196. doi: 10.5194/acp-17-12177-2017. - DOI
MeSH terms
Substances
LinkOut - more resources
Full Text Sources
Medical
