

Genome-wide identification and expression analysis of GRAS gene family in Eucalyptus grandis
- PMID: 38890621
- PMCID: PMC11184746
- DOI: 10.1186/s12870-024-05288-x
Genome-wide identification and expression analysis of GRAS gene family in Eucalyptus grandis
Abstract
Background: The GRAS gene family is a class of plant-specific transcription factors with important roles in many biological processes, such as signal transduction, disease resistance and stress tolerance, plant growth and development. So far, no information available describes the functions of the GRAS genes in Eucalyptus grandis.
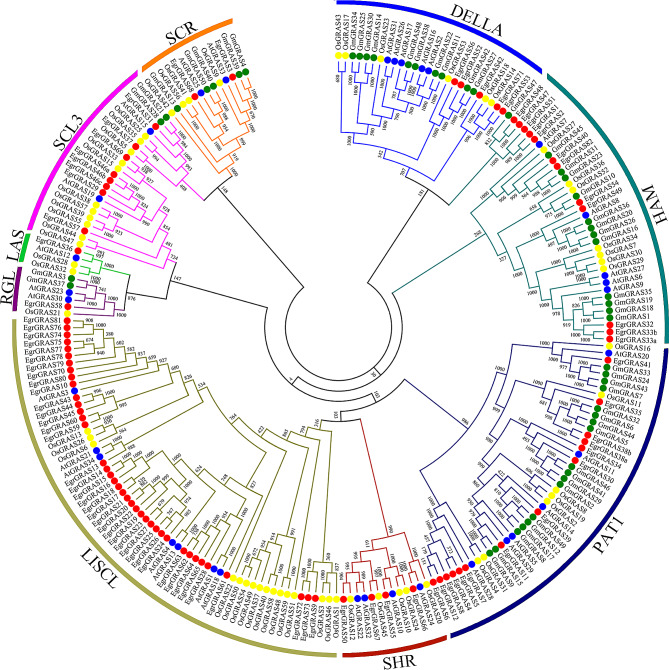
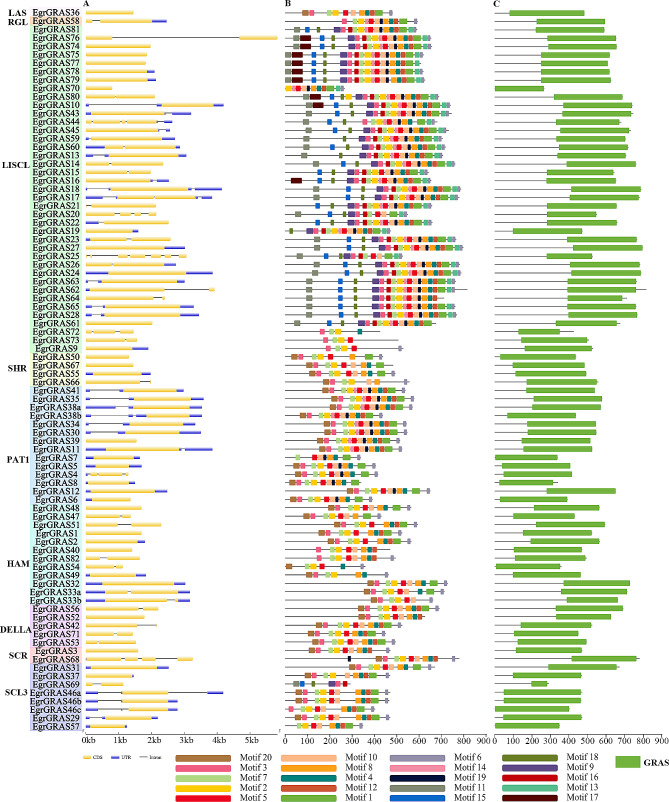
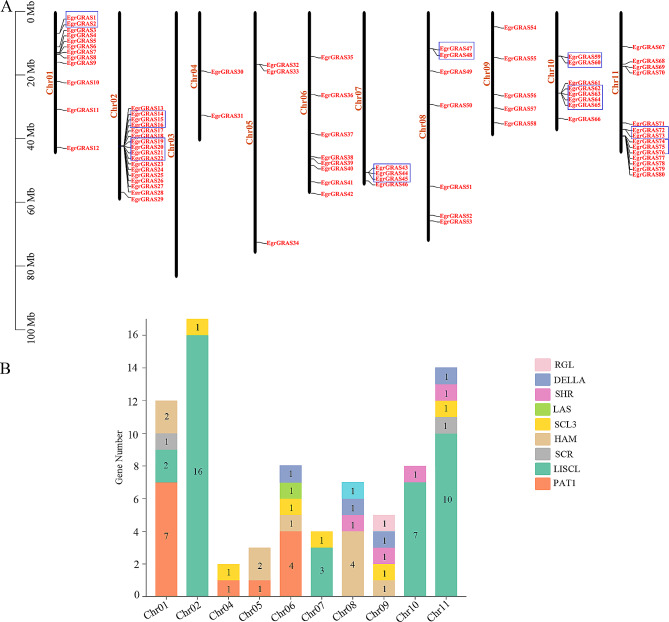
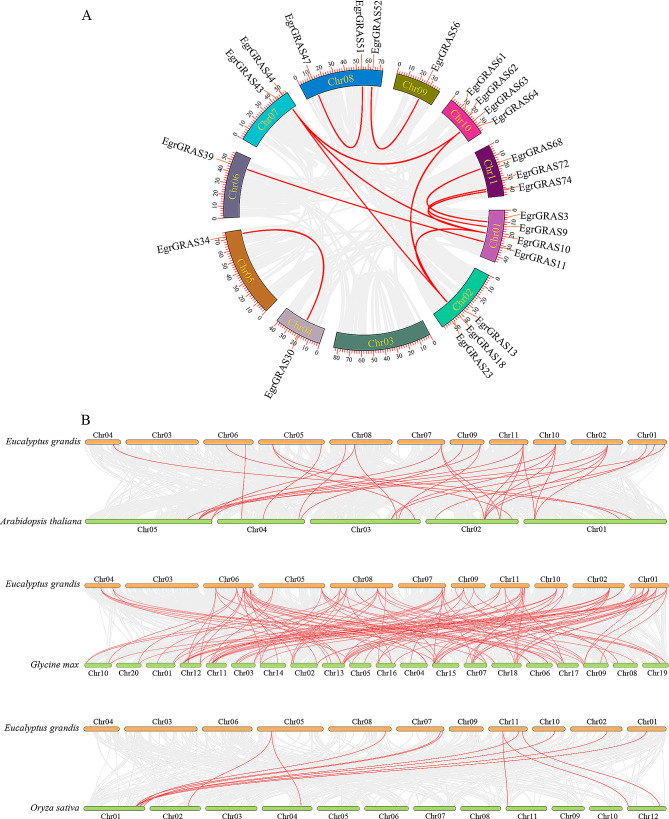
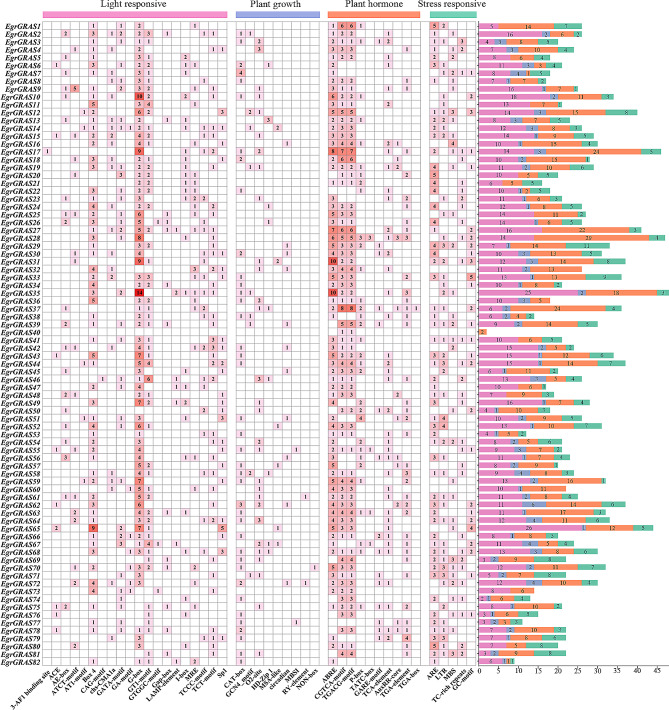
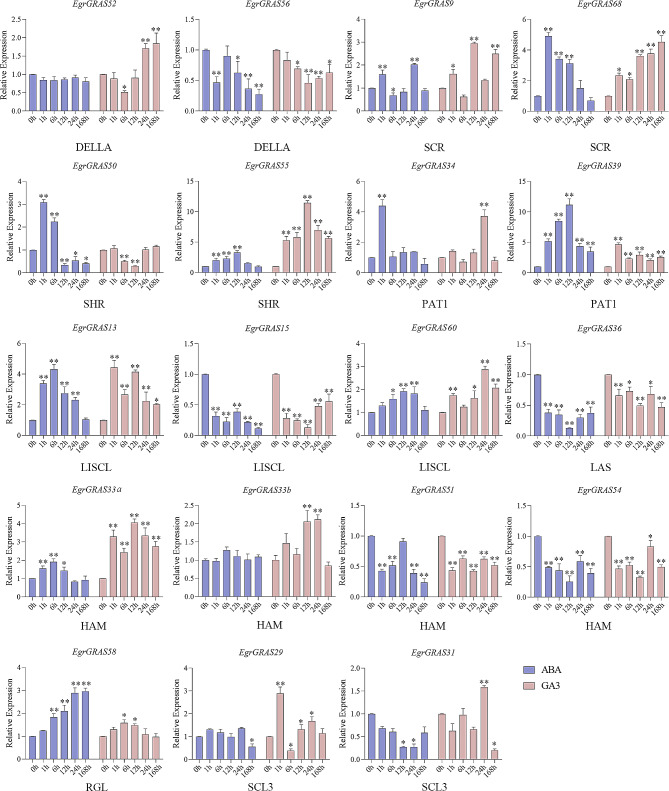
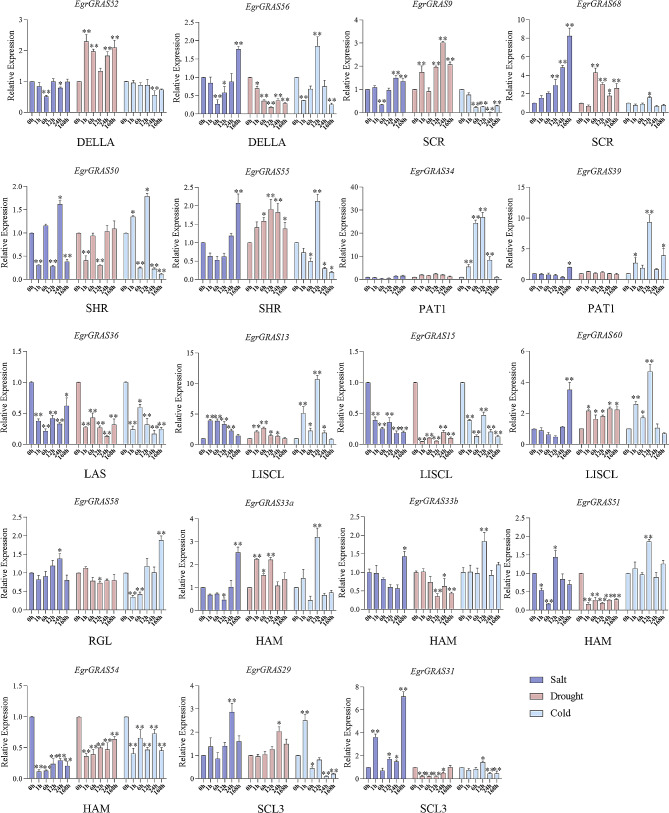
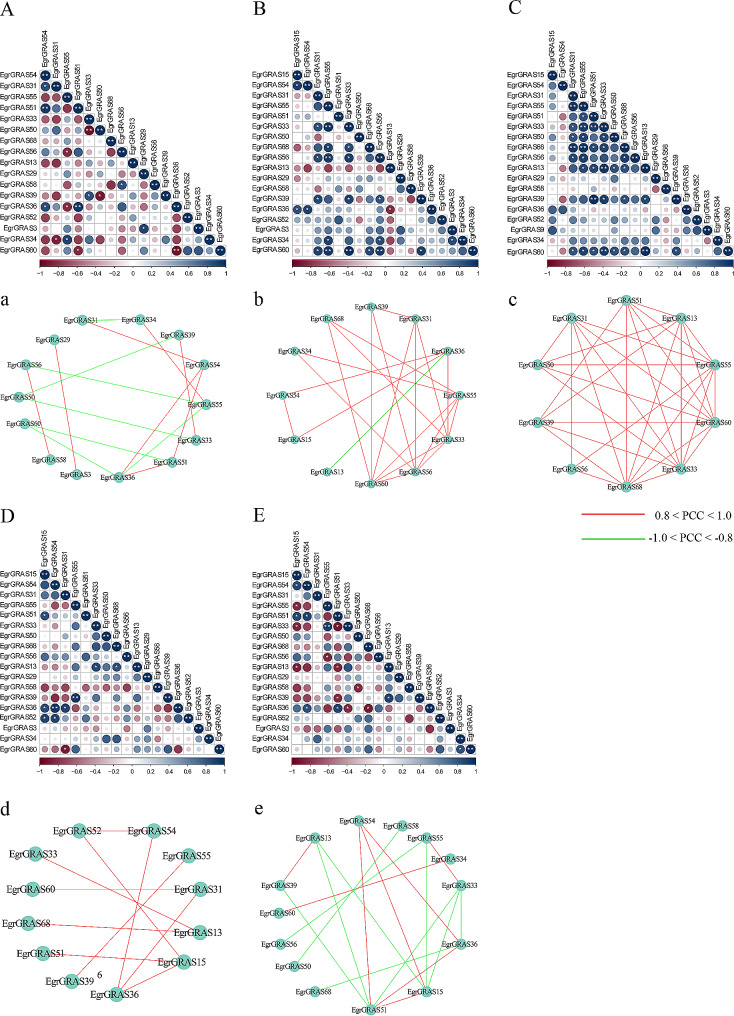
Results: A total of 82 GRAS genes were identified with amino acid lengths ranging from 267 to 817 aa, and most EgrGRAS genes had one exon. Members of the GRAS gene family of Eucalyptus grandis are divided into 9 subfamilies with different protein structures, while members of the same subfamily have similar gene structures and conserved motifs. Moreover, these EgrGRAS genes expanded primarily due to segmental duplication. In addition, cis-acting element analysis showed that this family of genes was involved involved in the signal transduction of various plant hormones, growth and development, and stress response. The qRT-PCR data indicated that 18 EgrGRAS genes significantly responded to hormonal and abiotic stresses. Among them, the expression of EgrGRAS13, EgrGRAS68 and EgrGRAS55 genes was significantly up-regulated during the treatment period, and it was hypothesised that members of the EgrGRAS family play an important role in stress tolerance.
Conclusions: In this study, the phylogenetic relationship, conserved domains, cis-elements and expression patterns of GRAS gene family of Eucalyptus grandis were analyzed, which filled the gap in the identification of GRAS gene family of Eucalyptus grandis and laid the foundation for analyzing the function of EgrGRAS gene in hormone and stress response.
Keywords: Abiotic stress; Eucalyptus grandis; GRAS family; Genome-wide analysis; Phytohormone.
© 2024. The Author(s).
Conflict of interest statement
The authors declare no competing interests.
The authors declare no conflict of interest.
Figures
References
-
- Peng J, Carol P, Fau - Richards DE. Richards De Fau - King KE, King Ke Fau - Cowling RJ, Cowling Rj Fau - Murphy GP, Murphy Gp Fau - Harberd NP, Harberd NP: the Arabidopsis GAI gene defines a signaling pathway that negatively regulates gibberellin responses. Genes Dev. 1997;11(23):3194–205. doi: 10.1101/gad.11.23.3194. - DOI - PMC - PubMed
-
- Di Laurenzio L, Wysocka-Diller J, Fau - Malamy JE, Malamy Je Fau . Pysh L, Pysh L, Fau - Helariutta Y, Helariutta Y, Fau - Freshour G, Freshour G. Fau - Hahn MG, Hahn mg Fau - Feldmann KA, Feldmann Ka Fau - Benfey PN, Benfey PN: the SCARECROW gene regulates an asymmetric cell division that is essential for generating the radial organization of the Arabidopsis root. Cell. 1996;86(3):423–33. doi: 10.1016/S0092-8674(00)80115-4. - DOI - PubMed
MeSH terms
Substances
Grants and funding
- 2022YFD2200203/the National Key Research and Development Program of China during the 14th five-year plan Period
- 2022YFD2200203/the National Key Research and Development Program of China during the 14th five-year plan Period
- 2022YFD2200203/the National Key Research and Development Program of China during the 14th five-year plan Period
- 2022YFD2200203/the National Key Research and Development Program of China during the 14th five-year plan Period
- 2022YFD2200203/the National Key Research and Development Program of China during the 14th five-year plan Period
LinkOut - more resources
Full Text Sources
Miscellaneous
