

3D stem-like spheroids-on-a-chip for personalized combinatorial drug testing in oral cancer
- PMID: 38890730
- PMCID: PMC11186147
- DOI: 10.1186/s12951-024-02625-y
3D stem-like spheroids-on-a-chip for personalized combinatorial drug testing in oral cancer
Abstract
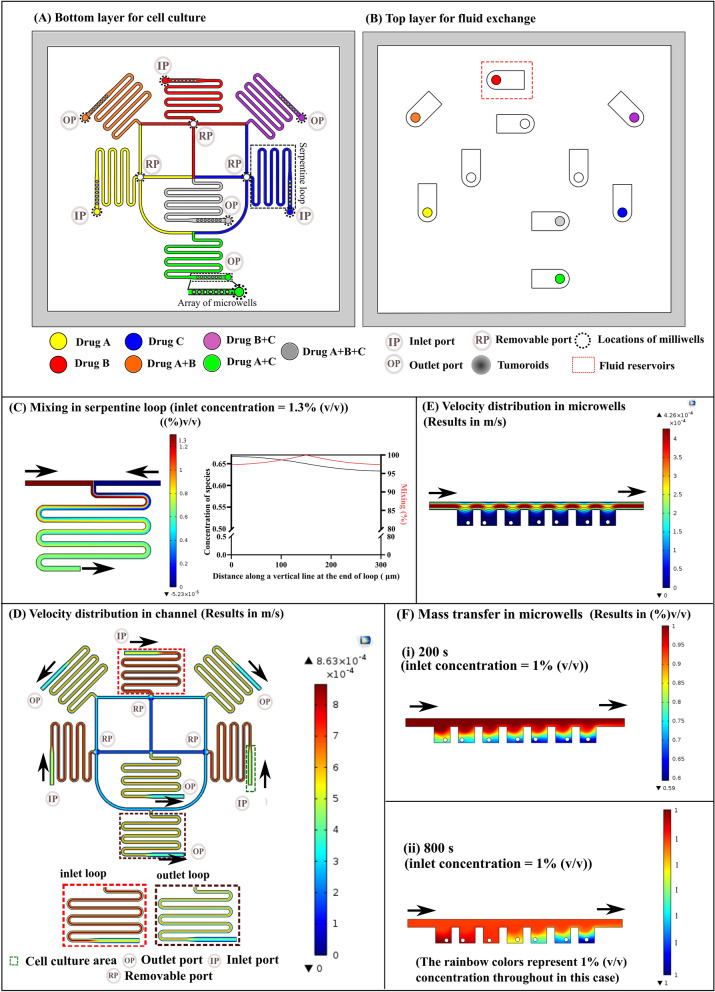
Background: Functional drug testing (FDT) with patient-derived tumor cells in microfluidic devices is gaining popularity. However, the majority of previously reported microfluidic devices for FDT were limited by at least one of these factors: lengthy fabrication procedures, absence of tumor progenitor cells, lack of clinical correlation, and mono-drug therapy testing. Furthermore, personalized microfluidic models based on spheroids derived from oral cancer patients remain to be thoroughly validated. Overcoming the limitations, we develop 3D printed mold-based, dynamic, and personalized oral stem-like spheroids-on-a-chip, featuring unique serpentine loops and flat-bottom microwells arrangement.
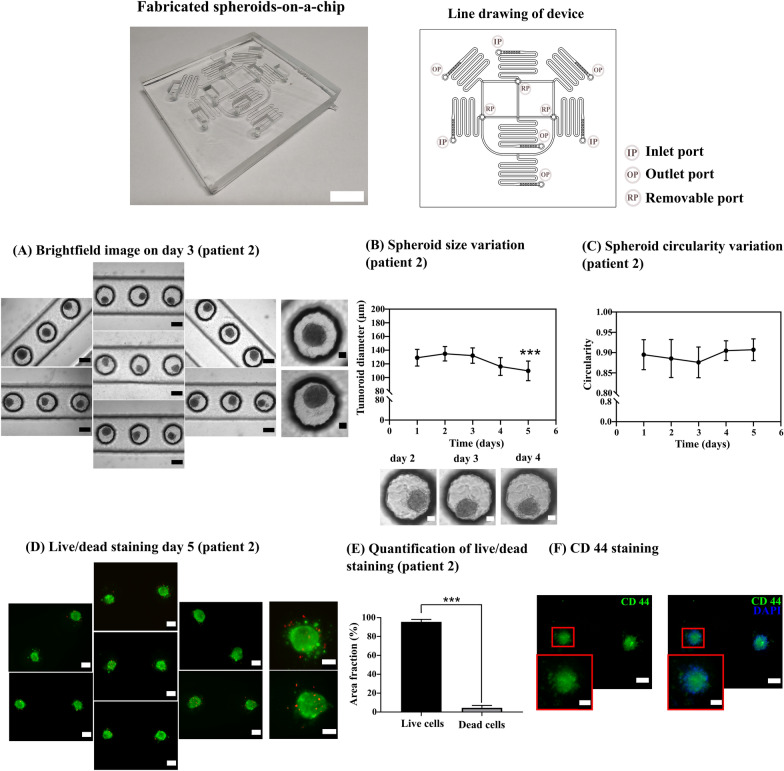
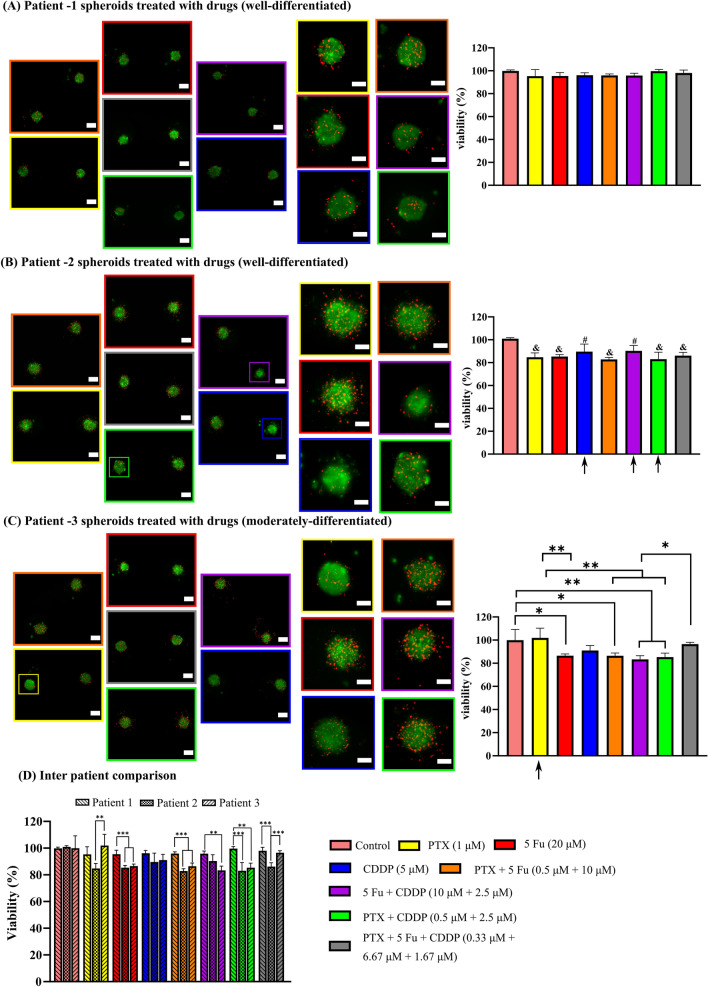
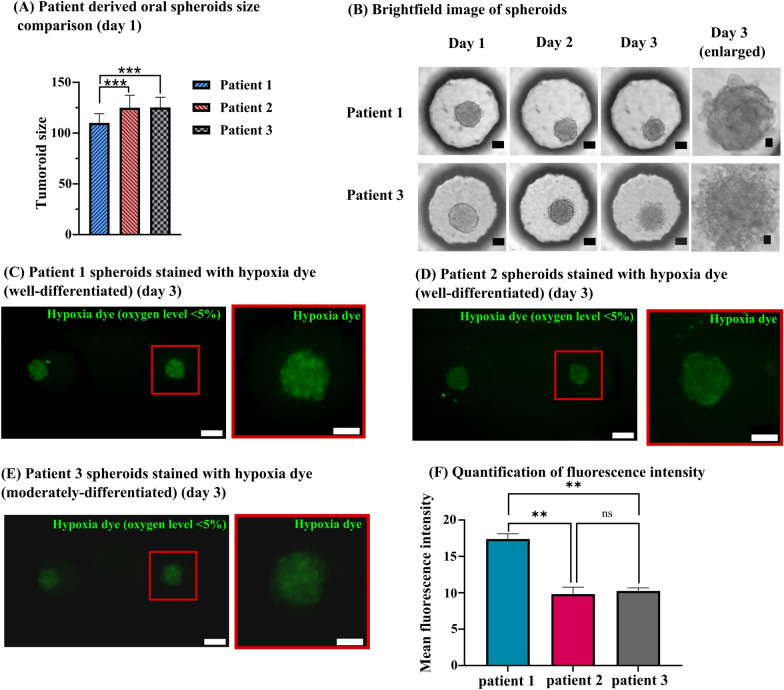
Results: This unique arrangement enables the screening of seven combinations of three drugs on chemoresistive cancer stem-like cells. Oral cancer patients-derived stem-like spheroids (CD 44+) remains highly viable (> 90%) for 5 days. Treatment with a well-known oral cancer chemotherapy regimen (paclitaxel, 5 fluorouracil, and cisplatin) at clinically relevant dosages results in heterogeneous drug responses in spheroids. These spheroids are derived from three oral cancer patients, each diagnosed with either well-differentiated or moderately-differentiated squamous cell carcinoma. Oral spheroids exhibit dissimilar morphology, size, and oral tumor-relevant oxygen levels (< 5% O2). These features correlate with the drug responses and clinical diagnosis from each patient's histopathological report.
Conclusions: Overall, we demonstrate the influence of tumor differentiation status on treatment responses, which has been rarely carried out in the previous reports. To the best of our knowledge, this is the first report demonstrating extensive work on development of microfluidic based oral cancer spheroid model for personalized combinatorial drug screening. Furthermore, the obtained clinical correlation of drug screening data represents a significant advancement over previously reported personalized spheroid-based microfluidic devices. Finally, the maintenance of patient-derived spheroids with high viability under oral cancer relevant oxygen levels of less than 5% O2 is a more realistic representation of solid tumor microenvironment in our developed device.
Keywords: 3D printing; Combinatorial drug testing; Functional drug testing; Microfluidics; Personalized medicine; Spheroids-on-chips.
© 2024. The Author(s).
Conflict of interest statement
The authors declare that they have no competing interests.
Figures
Similar articles
-
A 3D-printed tumor-on-chip: user-friendly platform for the culture of breast cancer spheroids and the evaluation of anti-cancer drugs.Biofabrication. 2024 Jul 23;16(4). doi: 10.1088/1758-5090/ad5765. Biofabrication. 2024. PMID: 38866003
-
A novel design of microfluidic platform for metronomic combinatorial chemotherapy drug screening based on 3D tumor spheroid model.Biomed Microdevices. 2021 Oct 1;23(4):50. doi: 10.1007/s10544-021-00593-w. Biomed Microdevices. 2021. PMID: 34596764
-
High-Throughput Screening of Anti-cancer Drugs Using a Microfluidic Spheroid Culture Device with a Concentration Gradient Generator.Curr Protoc. 2022 Sep;2(9):e529. doi: 10.1002/cpz1.529. Curr Protoc. 2022. PMID: 36066205
-
A Review on Patient-derived 3D Micro Cancer Approach for Drug Screen in Personalized Cancer Medicine.Curr Cancer Drug Targets. 2025;25(2):118-130. doi: 10.2174/0115680096285910240206044830. Curr Cancer Drug Targets. 2025. PMID: 38445692 Review.
-
Liquid-based three-dimensional tumor models for cancer research and drug discovery.Exp Biol Med (Maywood). 2016 May;241(9):939-54. doi: 10.1177/1535370216643772. Epub 2016 Apr 11. Exp Biol Med (Maywood). 2016. PMID: 27072562 Free PMC article. Review.
Cited by
-
Multidisciplinary approaches in electronic nicotine delivery systems pulmonary toxicology: emergence of living and non-living bioinspired engineered systems.Commun Eng. 2024 Sep 3;3(1):123. doi: 10.1038/s44172-024-00276-3. Commun Eng. 2024. PMID: 39227652 Free PMC article. Review.
-
Machine learning-assisted exploration of multidrug-drug administration regimens for organoid arrays.Sci Adv. 2025 Aug;11(31):eadt1851. doi: 10.1126/sciadv.adt1851. Epub 2025 Jul 30. Sci Adv. 2025. PMID: 40737392 Free PMC article.
-
3D bioprinting for the construction of drug testing models-development strategies and regulatory concerns.Front Bioeng Biotechnol. 2025 Feb 14;13:1457872. doi: 10.3389/fbioe.2025.1457872. eCollection 2025. Front Bioeng Biotechnol. 2025. PMID: 40028291 Free PMC article. Review.
-
Microfluidics and nanofluidics in India - some recent advancements and futuristic perspective.Biomicrofluidics. 2025 Jul 1;19(4):040403. doi: 10.1063/5.0279173. eCollection 2025 Jul. Biomicrofluidics. 2025. PMID: 40612533 Free PMC article. No abstract available.
-
A Novel Microfluidic Platform for Personalized Anticancer Drug Screening Through Image Analysis.Micromachines (Basel). 2024 Dec 21;15(12):1521. doi: 10.3390/mi15121521. Micromachines (Basel). 2024. PMID: 39770275 Free PMC article.
References
MeSH terms
Substances
Grants and funding
LinkOut - more resources
Full Text Sources
Medical
