. 2024 Jun;28(12):e18494.
doi: 10.1111/jcmm.18494.

The TF/Nrf2/GSTP1 pathway is involved in stress-induced hepatocellular injury through ferroptosis

Affiliations

The TF/Nrf2/GSTP1 pathway is involved in stress-induced hepatocellular injury through ferroptosis

Xiaofei Tian et al. J Cell Mol Med. 2024 Jun.

Abstract

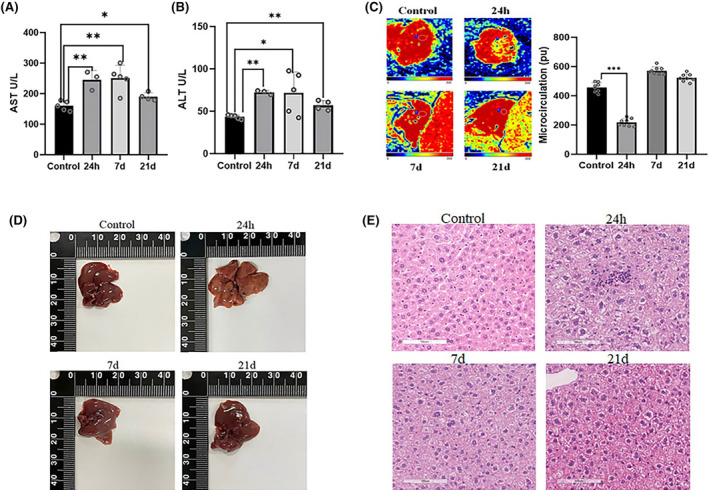
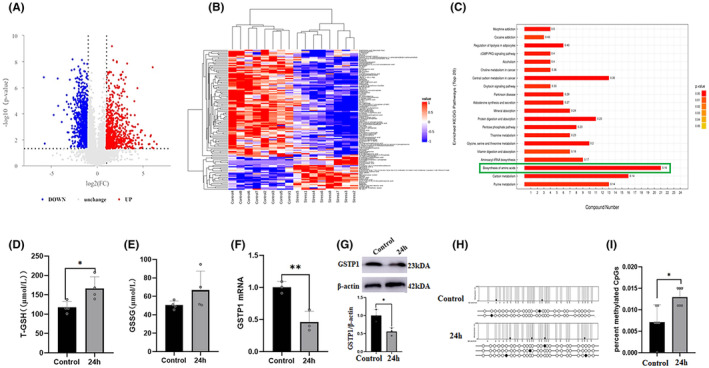
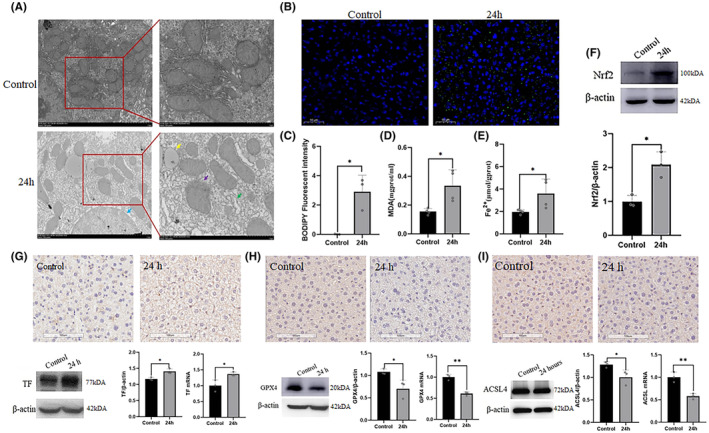
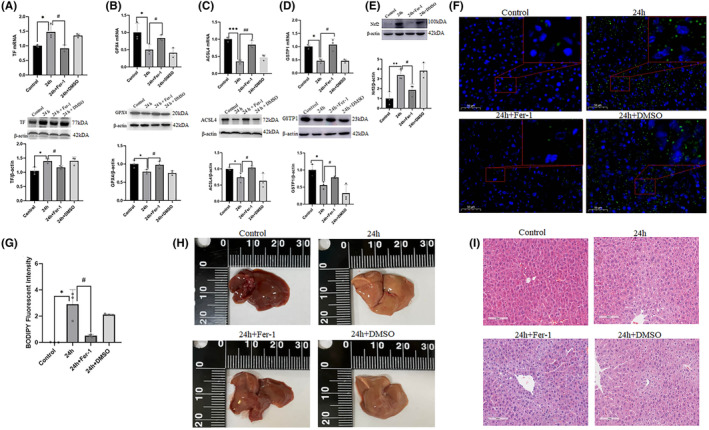
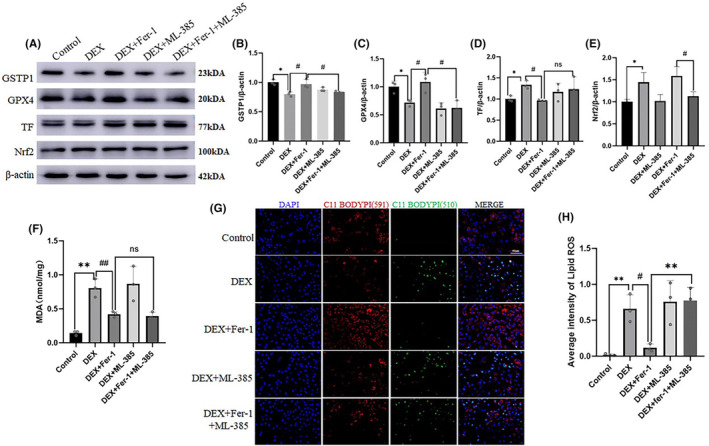
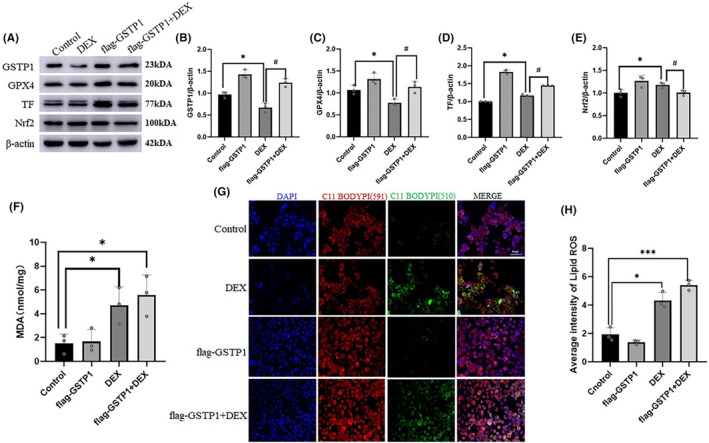
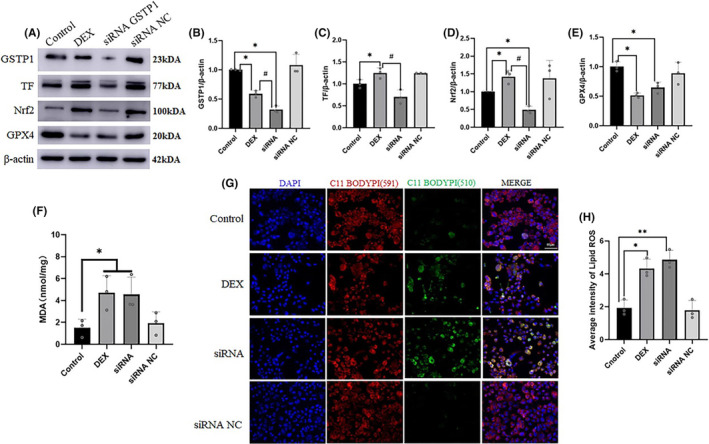
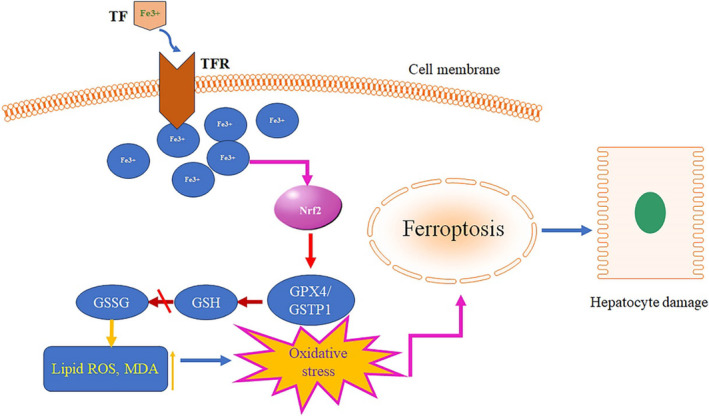
Stress triggers a comprehensive pathophysiological cascade in organisms. However, there is a substantial gap in the research regarding the effects of stress on liver function. This study aimed to investigate the impact of restraint stress on hepatocellular damage and elucidate the underlying molecular mechanisms. An effective mouse restraint stress model was successfully developed, and liver function analysis was performed using laser speckle imaging, metabolomics and serum testing. Alterations in hepatocyte morphology were assessed using haematoxylin and eosin staining and transmission electron microscopy. Oxidative stress in hepatocytes was assessed using lipid reactive oxygen species and malondialdehyde. The methylation status and expression of GSTP1 were analysed using DNA sequencing and, real-time PCR, and the expression levels of GPX4, TF and Nrf2 were evaluated using real-time quantitative PCR, western blotting, and immunohistochemical staining. A stress-induced model was established in vitro by using dexamethasone-treated AML-12 cells. To investigate the underlying mechanisms, GSTP1 overexpression, small interfering RNA, ferroptosis and Nrf2 inhibitors were used. GSTP1 methylation contributes to stress-induced hepatocellular damage and dysfunction. GSTP1 is involved in ferroptosis-mediated hepatocellular injury induced by restraint stress via the TF/Nrf2 pathway. These findings suggest that stress-induced hepatocellular injury is associated with ferroptosis, which is regulated by TF/Nrf2/GSTP1.

Keywords: TF/Nrf2/GSTP1; ferroptosis; liver injury; restraint stress.


Conflict of interest statement

The authors declare no conflict of interest.

Figures

FIGURE 1
FIGURE 1
Stress resulted in hepatocyte injury. (A) and (B) Serum levels of ALT and AST were significantly increased by restraint stress in mice (n = 4). (C) Liver blood flow (LBF) was measured using a Laser‐Doppler Perfusion Imager (n = 8). (D) Gross visual observation of the liver. (E) HE staining of hepatocytes. Scale bar = 100 μm. The values are expressed as the mean ± SEM, *p < 0.05, **p < 0.01, ***p < 0.001 versus the control group. ALT, alanine aminotransferase; AST, aspartate aminotransferase; HE, haematoxylin and eosin.
FIGURE 2
FIGURE 2
GSTP1 methylation contributed to stress‐induced hepatocyte dysfunction. (A) The volcanic map of liver metabolite differences due to restraint stress. (B) Heat maps of metabolites with significant differences in negative ion patterns. (C) The KEGG enrichment pathway was mapped according to the differences in liver metabolites between the restraint stress and normal control groups. (D) and (E) Detection of T‐GSH and GSSG in hepatic tissue from control and restraint (24 h) groups (n = 4). (F) and (G) The expression of GSTP1 in hepatic tissue of mice (n = 3). (H) and (I) The methylation of GSTP1 in mice liver (n = 4). The values are expressed as the mean ± SEM, *p < 0.05, **p < 0.01 versus the control group.
FIGURE 3
FIGURE 3
Ferroptosis was involved in hepatocyte injury induced by stress. (A) The result of TEM about the ultrastructural changes of hepatocytes in the 24 h and control groups. (B) and (C) Immunofluorescence results of lipid ROS probe C11‐bodipy, green is C11‐bodipy, blue is DAPI. Scale bar = 50 μm. (D) and (E) Detection of MDA and Fe2+ ions in hepatic tissue from control and restraint groups (n = 4). F: the expression of Nrf2 at the protein level in hepatic tissue of different groups (n = 3). (G–I): The expression of TF, GPX4 and ACSL4 at protein and mRNA levels in hepatic tissue from control and restraint group (n = 3). Scale bars = 100 or 2.0 μm. The values are expressed as the mean ± SEM, *p < 0.05, **p < 0.01 versus the control group. MDA, malondialdehyde.
FIGURE 4
FIGURE 4
Fer‐1 markedly mitigated the stress‐induced ferroptosis. (A–E) The expression of TF, GPX4, ACSL4, GSTP1 and Nrf2 in hepatic tissue from control group, restraint stress group, Fer‐1 group and DMSO group (n = 3). (F) and (G) Immunofluorescence results of lipid ROS probe C11‐bodipy (green), blue is DAPI. Scale bar = 50 μm. (H) Gross morphology of hepatic tissue from control group, 24 h of restraint stress group (24 h), 24 h of restraint stress + Fer‐1 group (24 h + Fer‐1) and 24 h of restraint stress + DMSO group (24 h + DMSO). (I) The HE staining of hepatic tissue from groups of control, 24 h, 24 h + Fer‐1 and 24 h + DMSO. Scale bar = 100 μm. Values are expressed as the mean ± SEM, *p < 0.05, **p < 0.01, ***p < 0.001 versus the control group, # p < 0.05, ## p < 0.01 versus the 24 h + Fer‐1 group. HE, haematoxylin and eosin.
FIGURE 5
FIGURE 5
Fer‐1 alleviate the expression changes of ferroptosis‐related proteins induced by DEX, but ML‐385 weakened the remission effect of Fer‐1. (A–E) The expression of Nrf2, GPX4, GSTP1 and TF at the protein level in AML‐12 cells (n = 3). (F) The content of MDA in AML‐12 cells of different groups (n = 3). (G) and (H) The content of C11 BODIPY in AML‐12 cells of different groups. Scale bar = 60 μm. Values are expressed as the mean ± SEM, *p < 0.05, **p < 0.01 versus the control group. # p < 0.05, ## p < 0.01 versus the DEX + Fer‐1 group. DEX, dexamethasone.
FIGURE 6
FIGURE 6
Overexpression of GSTP1 could reverse low expression of GPX4, while not activate Nrf2 or alleviate increasing of TF induced by DEX. (A–E) The expression of Nrf2, GPX4, GSTP1, and TF at the protein level in AML‐12 cells (n = 3). (F) The content of MDA in AML‐12 cells of different groups (n = 3). (G) and (H) The content of C11 BODIPY in AML‐12 cells of different groups. Scale bar = 60 μm. Values are expressed as the mean ± SEM, *p < 0.05, ***p < 0.001 versus the control group, # p < 0.05 versus the pcDNA‐flag‐GSTP1+DEX group. DEX, dexamethasone.
FIGURE 7
FIGURE 7
GSTP1 knockdown led to more severe stress damage in AML‐12 cells. (A–E) The expression of Nrf2, GPX4, GSTP1, TF at the protein level in AML‐12 cells (n = 3). (F) The content of MDA in AML‐12 cells of different groups (n = 3). (G) and (H) The content of C11 BODIPY in AML‐12 cells of different groups. Scale bar = 60 μm. Values are expressed as the mean ± SEM, *p < 0.05, **p < 0.01 versus the control group, # p < 0.05 versus the siRNA group. MDA, malondialdehyde.
FIGURE 8
FIGURE 8
GSTP1 involvement in the stress‐induced hepatocyte ferroptosis process via TF/Nrf2.

Similar articles

Cited by

References

    1. Xu G, Li Y, Ma C, et al. Restraint stress induced hyperpermeability and damage of the blood‐brain barrier in the amygdala of adult rats. Front Mol Neurosci. 2019;12:32. doi:10.3389/fnmol.2019.00032 - DOI - PMC - PubMed
    1. Strehl C, Ehlers L, Gaber T, Buttgereit F. Glucocorticoids‐all‐rounders tackling the versatile players of the immune system. Front Immunol. 2019;10:1744. doi:10.3389/fimmu.2019.01744 - DOI - PMC - PubMed
    1. Picard M, McEwen BS, Epel ES, Sandi C. An energetic view of stress: focus on mitochondria. Front Neuroendocrinol. 2018;49:72‐85. doi:10.1016/j.yfrne.2018.01.001 - DOI - PMC - PubMed
    1. Latha S, Chaudhary S, Ray RS. Hydroalcoholic extract of Stevia rebaudiana bert. Leaves and stevioside ameliorates lipopolysaccharide induced acute liver injury in rats. Biomed Pharmacother. 2017;95:1040‐1050. doi:10.1016/j.biopha.2017.08.082 - DOI - PubMed
    1. Daolin T. Ferroptosis in Health and Disease; Springer Cham, 2019:324.