. 2024 Jun 3;13(11):1755.
doi: 10.3390/foods13111755.

(-)-Gallocatechin Gallate Mitigates Metabolic Syndrome-Associated Diabetic Nephropathy in db/db Mice

Affiliations

(-)-Gallocatechin Gallate Mitigates Metabolic Syndrome-Associated Diabetic Nephropathy in db/db Mice

Xin Xiao et al. Foods. .

Abstract

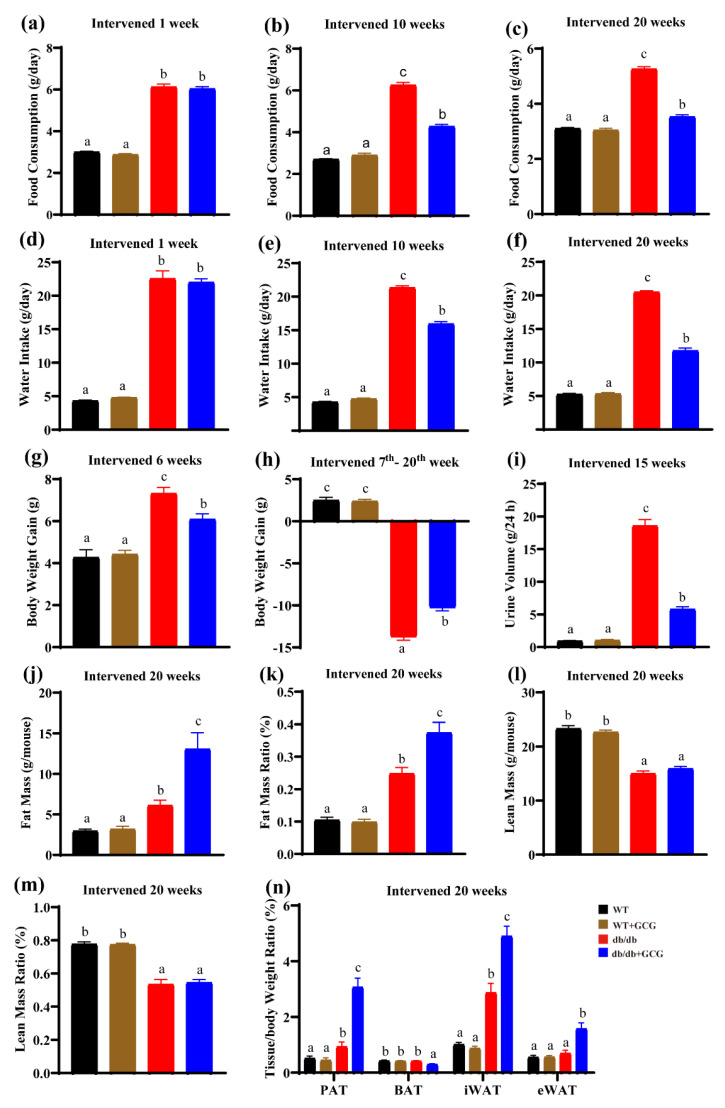
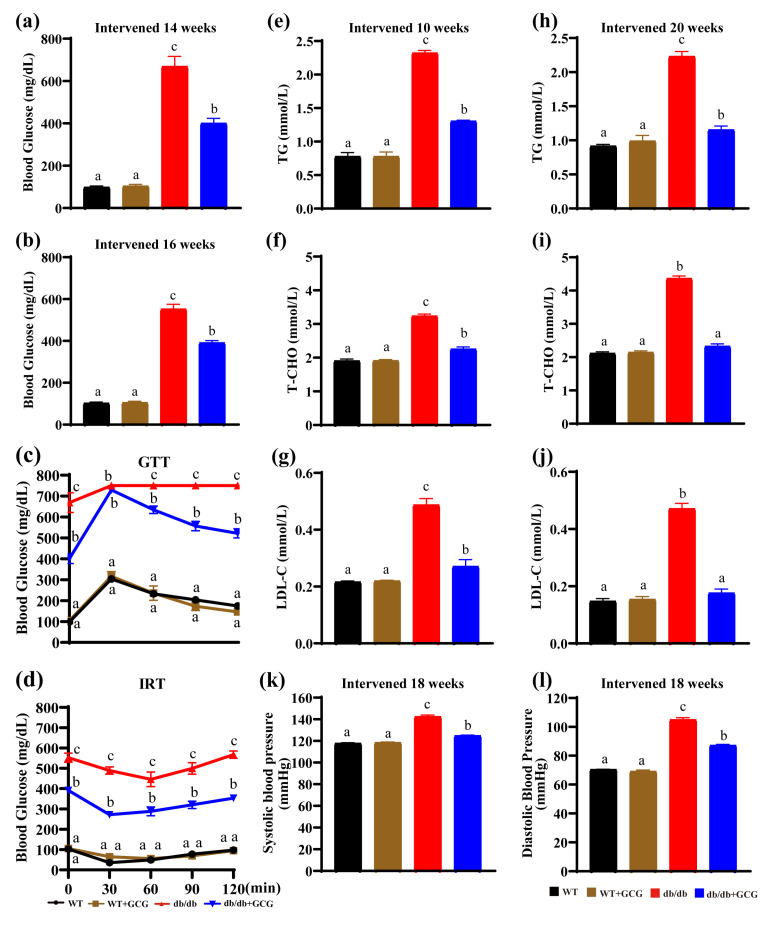
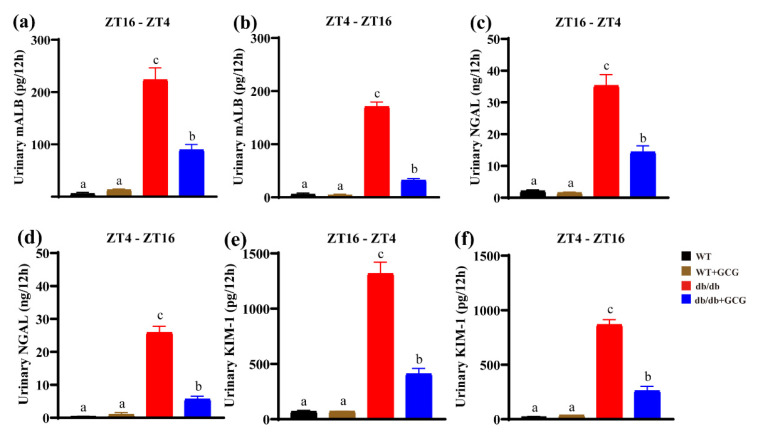
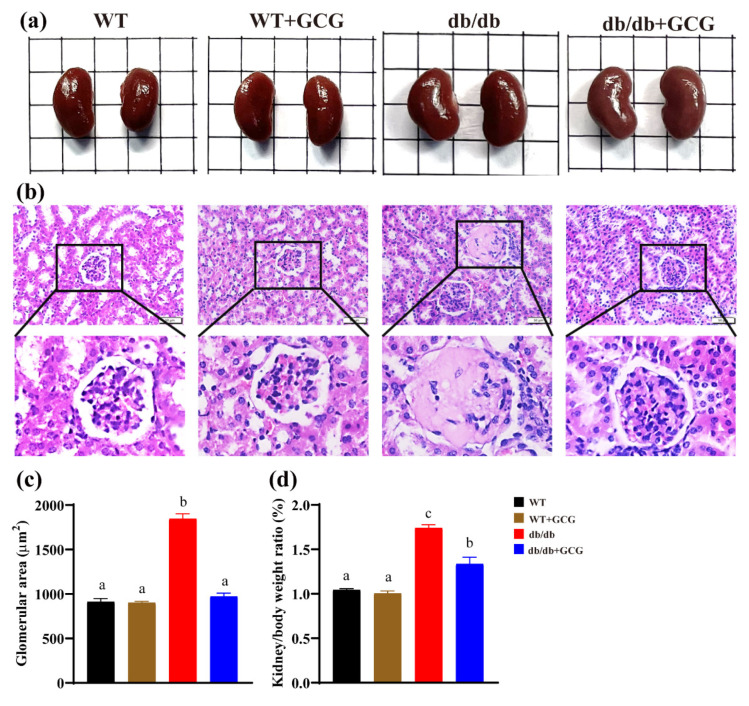
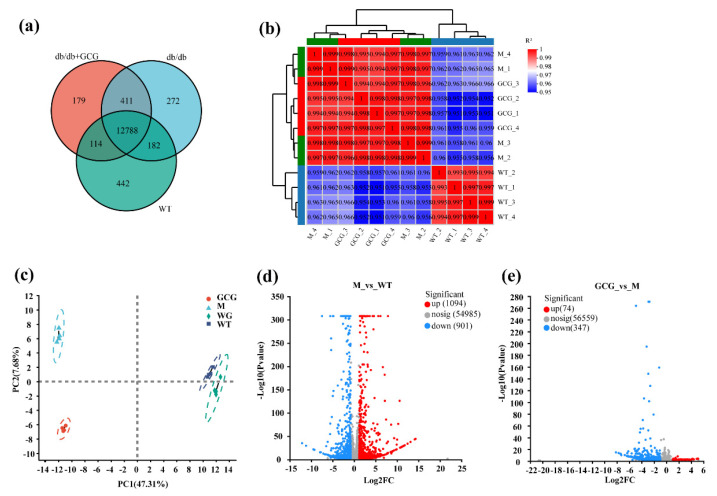
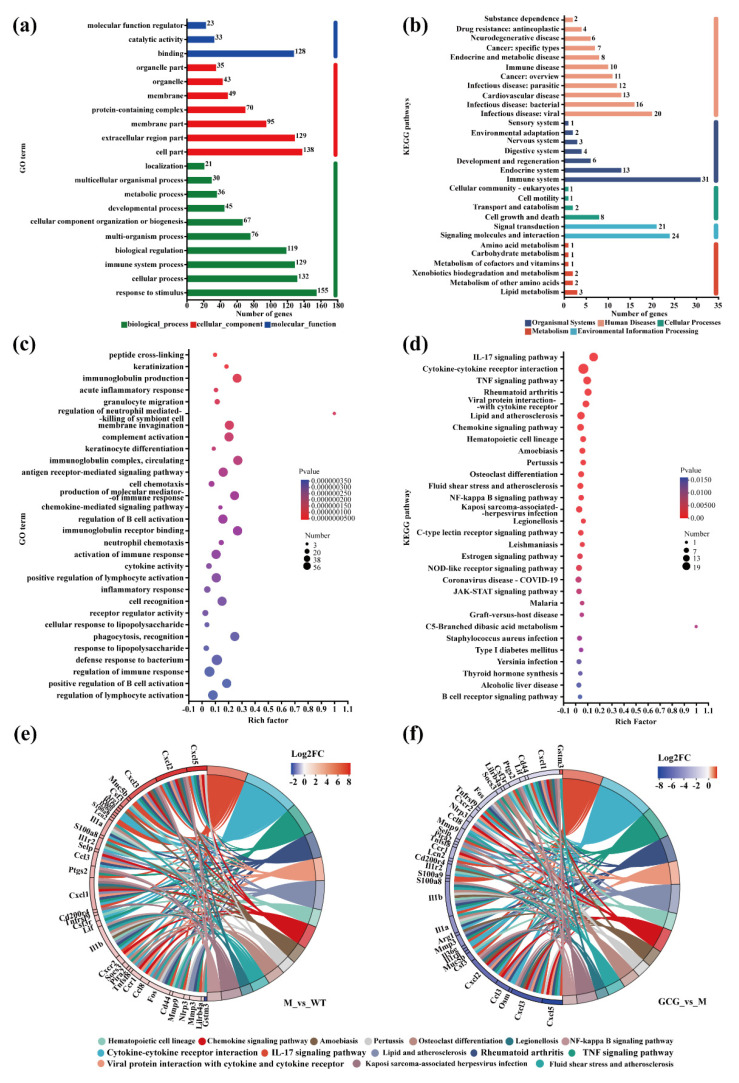
Metabolic syndrome (MetS) significantly predisposes individuals to diabetes and is a prognostic factor for the progression of diabetic nephropathy (DN). This study aimed to evaluate the efficacy of (-)-gallocatechin gallate (GCG) in alleviating signs of MetS-associated DN in db/db mice. We administered GCG and monitored its effects on several metabolic parameters, including food and water intake, urinary output, blood glucose levels, glucose and insulin homeostasis, lipid profiles, blood pressure, and renal function biomarkers. The main findings indicated that GCG intervention led to marked improvements in these metabolic indicators and renal function, signifying its potential in managing MetS and DN. Furthermore, transcriptome analysis revealed substantial modifications in gene expression, notably the downregulation of pro-inflammatory genes such as S100a8, S100a9, Cd44, Socs3, Mmp3, Mmp9, Nlrp3, IL-, Osm, Ptgs2, and Lcn2 and the upregulation of the anti-oxidative gene Gstm3. These genetic alterations suggest significant effects on pathways related to inflammation and oxidative stress. In conclusion, GCG demonstrates therapeutic efficacy for MetS-associated DN, mitigating metabolic disturbances and enhancing renal health by modulating inflammatory and oxidative responses.

Keywords: GCG; diabetic nephropathy; metabolic syndrome; renal transcriptome analysis.


Conflict of interest statement

The authors affirm that there are no competing interests to disclose.

Figures

Figure 1
Figure 1
Measurement of food consumption, water intake, 24 h urinary volume, body weight gain, body composition, and tissue/body weight ratio in mice from all groups. (ac) food consumption after intervention for 1, 10, and 20 weeks; (df) water intake after intervention for 1, 10, and 20 weeks; (g) body weight gain following intervention for 6 weeks; (h) body weight gain from 7th to 20th week intervention; (i) 24 h urine volume after intervention for 15 weeks; (j,k) fat mass and fat mass ratio; (l,m) lean mass and lean mass ratio; (n) tissue/body weight ratio. PAT: perirenal adipose tissue; BAT: brown adipose tissue; iWAT: inguinal white adipose tissue; eWAT: epididymal white adipose tissue. WT: normal control; db/db: diabetic model control; Values are presented as means ± SEM (n = 8). Different letters above the bars denote significant differences (p < 0.05) between groups.
Figure 2
Figure 2
GCG prevents risk factors for MetS in db/db mice. (a,b) Fasting blood glucose levels after intervention for 14 and 16 weeks, respectively; (c) GTT levels and (d) IRT levels after intervention for 14 and 16 weeks, respectively; (e,h) TG after intervention for 10 and 20 weeks; (f,i) T–CHO after intervention for 10 and 20 weeks; (g,j) LDL–C after intervention for 10 and 20 weeks; (k) SBP; (l) DBP. WT: normal control; db/db: diabetic model control. Values are presented as means ± SEM (n = 4–5). Different letters above the bars denote significant differences (p < 0.05) between groups.
Figure 3
Figure 3
Levels of key renal function markers measured in mice from the experimental groups following a 16–week intervention at ZT16–ZT4 and ZT4–ZT16, respectively. (a,b) Urinary mALB level; (c,d) urinary NGAL level; (e,f) urinary KIM-1 mass. WT: normal control; db/db: diabetic model control. Values are presented as means ± SEM (n = 4–5). Different letters above the bars denote significant differences (p < 0.05) between groups.
Figure 4
Figure 4
Analysis of renal structure in mice from each experimental group. (a) Representative kidney photos; (b) representative HE staining of glomeruli, magnified at 400× with a scale bar of 50 μm; (c) quantification of glomerular area in HE–stained kidney sections, with 30 glomerular sections in each group; (d) weight–to–body weight ratio. WT: normal control; db/db: diabetic model control. Values are presented as means ± SEM (n = 4–5). Different letters above the bars denote significant differences (p < 0.05) between groups.
Figure 5
Figure 5
Assessment of gene expression and identification of DEGs among renal samples from the experimental groups. (a) Comparison analysis among various experimental groups using Venn diagrams; (b) examination of sample correlation from various experimental groups; (c) PCA conducted on samples derived from diverse experimental groups; (d) volcano plot of comparison of gene expression between M and WT groups (M as the control); (e) comparison of gene expression between GCG and M groups. Upregulated genes are denoted by red dots, downregulated genes by green dots, and non-significantly different genes by gray dots. Kidney samples from WT (WT_1–WT_4), WT + GCG (WG_1–WG_4), db/db (M_1–M_4), and db/db + GCG (GCG_1–GCG_4) groups are included; PCA, principal component analysis.
Figure 6
Figure 6
Functional annotation and enrichment assessment of gene sets within the experimental groups. (a) GO annotation of gene set; (b) KEGG pathway annotation of gene set; (c) GO enrichment of gene set; (d) enrichment analysis of gene sets within KEGG pathways; (e,f) chord diagram illustrating enriched KEGG pathway interactions between M and WT groups (with WT as the control) and between M and GCG groups (with M as the control), respectively.

Similar articles

Cited by

References

    1. Fahed G., Aoun L., BouZerdan M., Allam S., BouZerdan M., Bouferraa Y., Assi H.I. Metabolic syndrome: Updates on pathophysiology and management in 2021. Int. J. Mol. Sci. 2022;23:786. doi: 10.3390/ijms23020786. - DOI - PMC - PubMed
    1. Zafar U., Khaliq S., Ahmad H.U., Manzoor S., Lone K.P. Metabolic syndrome: An update on diagnostic criteria, pathogenesis, and genetic links. Hormones. 2018;17:299–313. doi: 10.1007/s42000-018-0051-3. - DOI - PubMed
    1. Saklayen M.G. The global epidemic of the metabolic syndrome. Curr. Hypertens. Rep. 2018;20:12. doi: 10.1007/s11906-018-0812-z. - DOI - PMC - PubMed
    1. Ohishi M. Hypertension with diabetes mellitus: Physiology and pathology. Hypertens. Res. 2018;41:389–393. doi: 10.1038/s41440-018-0034-4. - DOI - PubMed
    1. Molitch M.E., Adler A.I., Flyvbjerg A., Nelson R.G., So W.Y., Wanner C., Kasiske B.L., Wheeler D.C., de Zeeuw D., Nsen C.E. Diabetic kidney disease: A clinical update from kidney disease: Improving global outcomes. Kidney Int. 2015;87:20–30. doi: 10.1038/ki.2014.128. - DOI - PMC - PubMed