. 2024 May 21;13(11):884.
doi: 10.3390/cells13110884.

The Effects of Smoking on Telomere Length, Induction of Oncogenic Stress, and Chronic Inflammatory Responses Leading to Aging

Affiliations

The Effects of Smoking on Telomere Length, Induction of Oncogenic Stress, and Chronic Inflammatory Responses Leading to Aging

Shreya Deb et al. Cells. .

Abstract

Telomeres, potential biomarkers of aging, are known to shorten with continued cigarette smoke exposure. In order to further investigate this process and its impact on cellular stress and inflammation, we used an in vitro model with cigarette smoke extract (CSE) and observed the downregulation of telomere stabilizing TRF2 and POT1 genes after CSE treatment. hTERT is a subunit of telomerase and a well-known oncogenic marker, which is overexpressed in over 85% of cancers and may contribute to lung cancer development in smokers. We also observed an increase in hTERT and ISG15 expression levels after CSE treatment, as well as increased protein levels revealed by immunohistochemical staining in smokers' lung tissue samples compared to non-smokers. The effects of ISG15 overexpression were further studied by quantifying IFN-γ, an inflammatory protein induced by ISG15, which showed greater upregulation in smokers compared to non-smokers. Similar changes in gene expression patterns for TRF2, POT1, hTERT, and ISG15 were observed in blood and buccal swab samples from smokers compared to non-smokers. The results from this study provide insight into the mechanisms behind smoking causing telomere shortening and how this may contribute to the induction of inflammation and/or tumorigenesis, which may lead to comorbidities in smokers.

Keywords: IFN-γ; ISG15; POT1; TRF2; aging; hTERT; smokers; telomere position effect; telomeres.


Conflict of interest statement

The authors declare no conflicts of interest.

Figures

Figure 1
Figure 1
Visual representation of TRAP assay. The TRAP assay uses a telomere primer set which recognizes and amplifies telomere sequences, a single copy reference (SCR) primer set which recognizes and amplifies a 100 bp-long region on human chromosome #17 serves as a reference for data normalization. A reference genomic DNA sample with a known telomere length (708 ± 52 kb, per diploid cell) serves as a reference for calculating the telomere length of target samples, as shown in the figure.
Figure 2
Figure 2
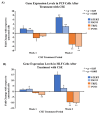
Comparison of gene expression levels of hTERT, ISG15, TRF2, and POT1 in PC9 and HLF cells after treatment with CSE using qPCR. 2 × 10⁵ cells were seeded in 35 mm dishes and allowed to grow and adhere for 24–48 h, followed by treatment with media containing 5% CSE over a period of two weeks. The mRNA was quantified and analyzed using qPCR for mRNA levels of genes of interest at the end of the first and second weeks of the treatment period. Gene expression was measured in two cell lines: PC9 (A), and HLF (B). The data were normalized with GAPDH, and the results were statistically significant according to two-tailed t-test analyses; * = p < 0.05, ** = p < 0.005. The data were collected from triplicates (n = 3).
Figure 3
Figure 3
Comparison of telomere lengths in PC9 and HLF cells after CSE treatment. 2 × 10⁵ cells were seeded in 35 mm dishes and allowed to grow and adhere for 24–48 h, followed by treatment with media containing 5% CSE for 2 weeks. The DNA were quantified and analyzed using a telomere length assay at the end of each week of the treatment period to determine the telomere length per chromosome end. PC9 cells (A) and HLF cells (B) received two weeks of CSE treatment. The data were normalized with an assay reference primer set and the graphical representation shows the average telomere length per chromosome end of PC9 and HLF cells without CSE treatment. The data were collected from triplicates (n = 3), and the results were statistically significant according to two-tailed t-test analyses; * = p < 0.05, ** = p < 0.005.
Figure 4
Figure 4
Comparison of gene expression levels of hTERT, ISG15, IFN-γ, TRF2, and POT1 in 11 smokers vs 20 non-smokers using qPCR. Whole blood of 11 smokers and 20 non-smokers was processed to isolate leukocytes. Total RNA was extracted from blood leukocytes and was quantified and analyzed using qPCR for mRNA levels of specific genes. The data were normalized with GAPDH, and graphical representation is relative to the expression of respective genes in smokers compared to non-smokers. The data were collected from triplicates (n = 3), and the results were statistically significant by two-tailed t-test analysis; * = p < 0.005.
Figure 5
Figure 5
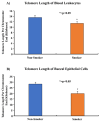
Comparing the telomere lengths of the blood leukocytes and buccal epithelial cells of 11 smokers and 20 non-smokers. Whole blood and buccal swabs of 11 smokers and 20 non-smokers were processed to isolate leukocytes and buccal epithelial cells. Isolated genomic DNA was quantified and analyzed in a telomere length assay to determine the average telomere length per chromosome end. The data were normalized using an assay reference primer set and were found to be statistically significant by two-tailed t-test analysis; * = p < 0.05.
Figure 6
Figure 6
Comparing plasma IFN-γ protein levels of 11 smokers and 20 non-smokers using an ELISA. Plasma samples of 11 smokers and 20 non-smokers were processed using an ELISA to determine the IFN-γ protein levels. The data was found to be statistically significant by two-tailed t-test analysis; * = p < 0.005.
Figure 7
Figure 7
Detection of ISG15 in smokers’ and non-smokers’ lung tissues via IHC. ISG15 (brown) was detected in lung tissue sections of smokers and non-smokers. Images were taken at 40× magnification. (A). Normal lung tissue of smoker showing high-intensity staining of ISG15. (B). Normal lung tissue of non-smoker showing low-intensity staining of ISG15.
Figure 8
Figure 8
Graphical representation of ISG15 expression and smoking status. A pathologist-graded ISG15 staining intensity was conducted and a grading score was calculated between 0 and 300 (0 = no expression; 300 = high-expression). The tissues with a grading score of 250 and above were considered to be high-expression of ISG15, and tissues with a grading score of less than 250 were considered to be moderate/low-expression of ISG15. A statistical analysis was conducted and the p-value was calculated (using Fisher’s exact test) for the distribution of high- and low-ISG15 expression among smokers and non-smokers. The p-value was found to be p < 0.05.
Figure 9
Figure 9
Detection of hTERT in smoker and non-smoker lung tissue sections via IHC. hTERT (brown) was detected in lung tissue sections of smokers and non-smokers. (A). Non-smoker lung tissue showing low-intensity staining of hTERT. (B). Smoker lung tissue showing high-intensity staining of hTERT.
Figure 10
Figure 10
Graphical representation of hTERT expression and smoking status. A pathologist-graded hTERT staining intensity was conducted and a grading score was calculated between 0 and 300 (0 = no expression; 300 = high-expression). The tissues with a grading score of 150 and above were considered to be high in their expression of hTERT, and tissues with a grading score of less than 150 were considered to be moderate/low in their expression of hTERT. A statistical analysis was conducted and the p-value was calculated for the distribution of high- and low-hTERT expression among smokers and non-smokers. The p-value was found to be p < 0.001.
Figure 11
Figure 11
Graphical representation of the TPE and TPE-OLD. (A) An example of telomere shortening that decreases inhibition through TPE and results in increased Gene A expression. (B) A depiction of telomere shortening that decreases the inhibition through the TPE-OLD and results in increased gene expression of Gene B.

References

    1. Bernadotte A., Mikhelson V.M., Spivak I.M. Markers of cellular senescence. Telomere shortening as a marker of cellular senescence. Aging. 2016;8:3–11. doi: 10.18632/aging.100871. - DOI - PMC - PubMed
    1. Stewart S.A., Weinberg R.A. Telomeres: Cancer to human aging. Annu. Rev. Cell Dev. Biol. 2006;22:531–557. doi: 10.1146/annurev.cellbio.22.010305.104518. - DOI - PubMed
    1. Schumacher B., Pothof J., Vijg J., Hoeijmakers J.H.J. The central role of DNA damage in the ageing process. Nature. 2021;592:695–703. doi: 10.1038/s41586-021-03307-7. - DOI - PMC - PubMed
    1. Srinivas N., Rachakonda S., Kumar R. Telomeres and Telomere Length: A General Overview. Cancers. 2020;12:558. doi: 10.3390/cancers12030558. - DOI - PMC - PubMed
    1. Doksani Y. The Response to DNA Damage at Telomeric Repeats and Its Consequences for Telomere Function. Genes. 2019;10:318. doi: 10.3390/genes10040318. - DOI - PMC - PubMed

Publication types

MeSH terms