. 2024 May 24;13(11):902.
doi: 10.3390/cells13110902.

Effects of Akt Activator SC79 on Human M0 Macrophage Phagocytosis and Cytokine Production

Affiliations

Effects of Akt Activator SC79 on Human M0 Macrophage Phagocytosis and Cytokine Production

Robert J Lee et al. Cells. .

Abstract

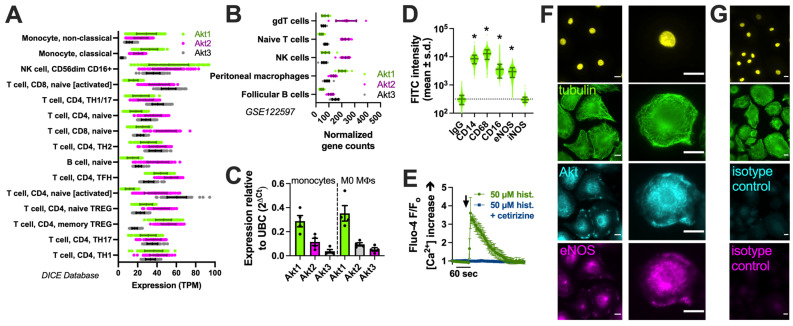
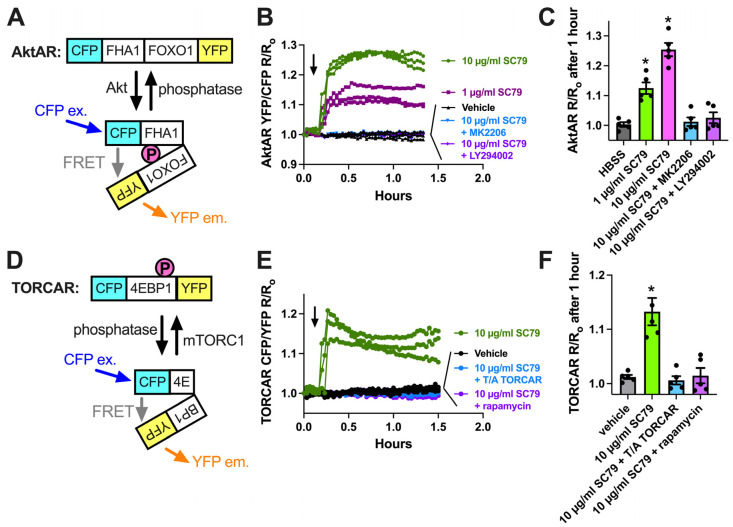
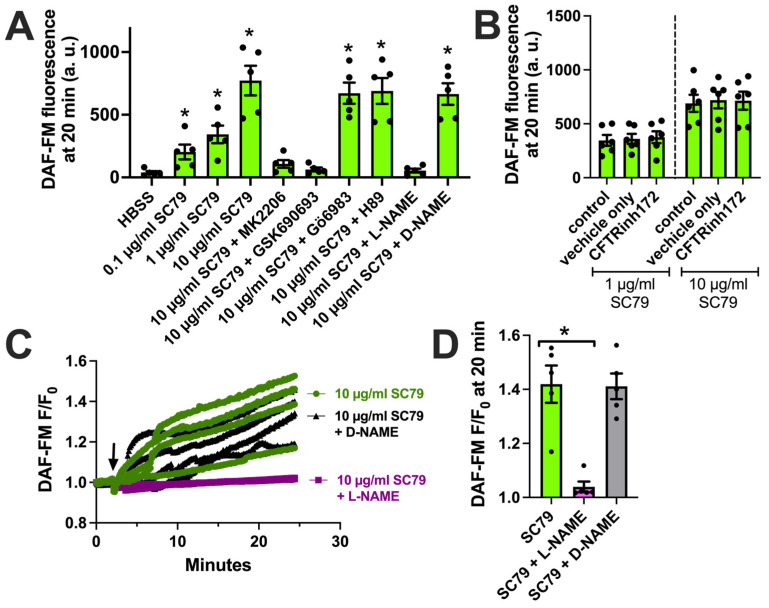
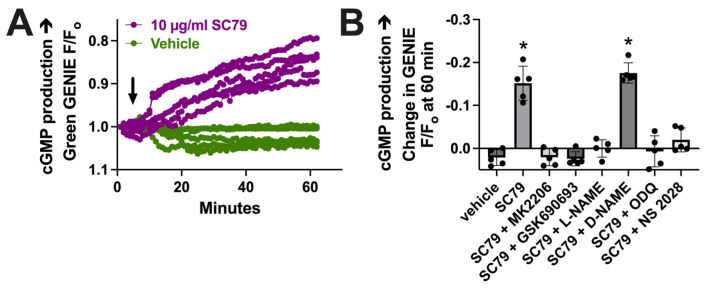
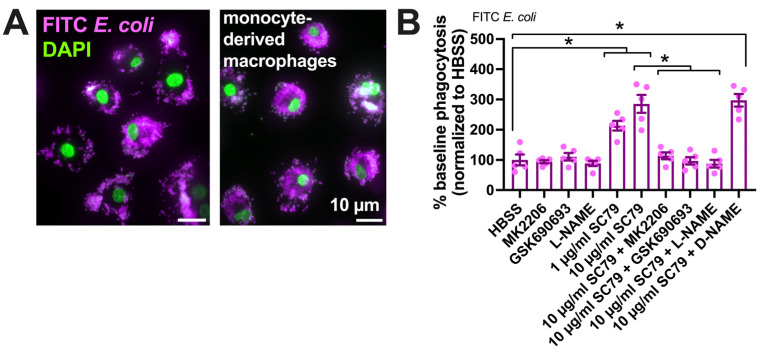
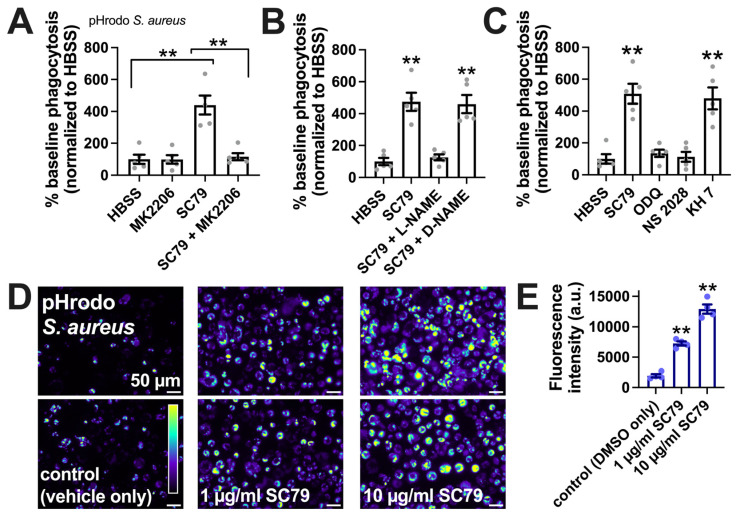
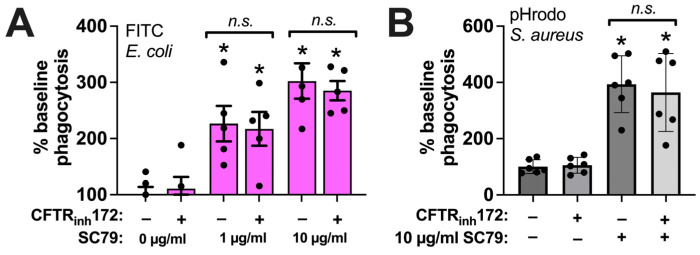
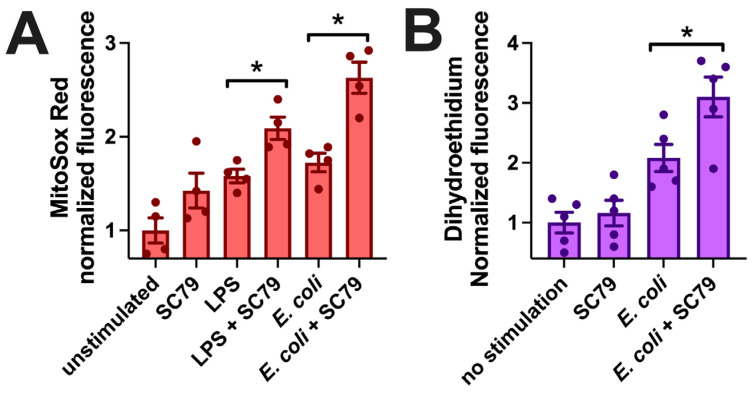
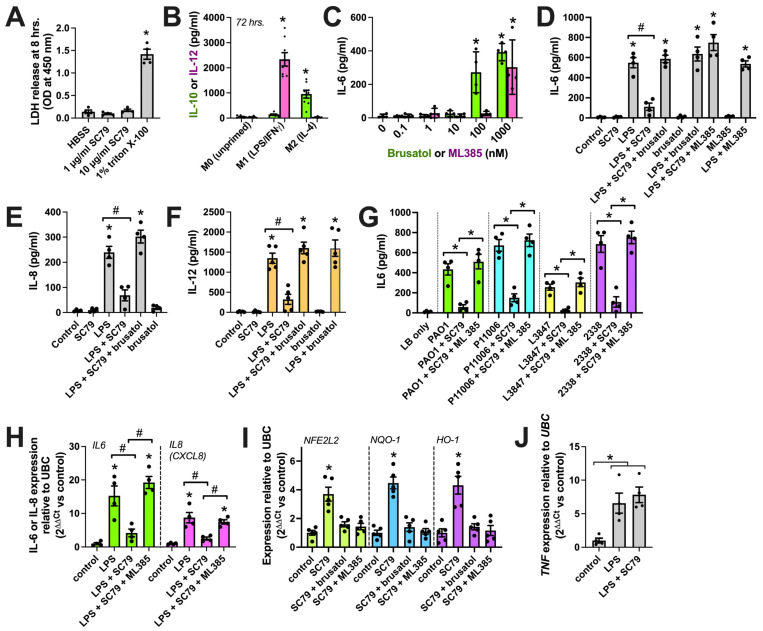
Akt is an important kinase in metabolism. Akt also phosphorylates and activates endothelial and neuronal nitric oxide (NO) synthases (eNOS and nNOS, respectively) expressed in M0 (unpolarized) macrophages. We showed that e/nNOS NO production downstream of bitter taste receptors enhances macrophage phagocytosis. In airway epithelial cells, we also showed that the activation of Akt by a small molecule (SC79) enhances NO production and increases levels of nuclear Nrf2, which reduces IL-8 transcription during concomitant stimulation with Toll-like receptor (TLR) 5 agonist flagellin. We hypothesized that SC79's production of NO in macrophages might likewise enhance phagocytosis and reduce the transcription of some pro-inflammatory cytokines. Using live cell imaging of fluorescent biosensors and indicator dyes, we found that SC79 induces Akt activation, NO production, and downstream cGMP production in primary human M0 macrophages. This was accompanied by a reduction in IL-6, IL-8, and IL-12 production during concomitant stimulation with bacterial lipopolysaccharide, an agonist of pattern recognition receptors including TLR4. Pharmacological inhibitors suggested that this effect was dependent on Akt and Nrf2. Together, these data suggest that several macrophage immune pathways are regulated by SC79 via Akt. A small-molecule Akt activator may be useful in some infection settings, warranting future in vivo studies.

Keywords: Toll-like receptor; inflammation; innate immunity; live cell imaging; monocyte-derived macrophages; signal transduction.


Conflict of interest statement

The authors declare no conflicts of interest. The funders had no role in the design of the study; in the collection, analyses, or interpretation of data; in the writing of the manuscript; or in the decision to publish the results.

Figures

Figure 1
Figure 1
Akt isoform expression in M0 macrophages. (A) Expression (transcripts per million, TPM) of Akt isoforms in immune cells in the DIC database; (B) Normalized gene counts of Akt isoforms from GEO dataset GSE122597. (C) Expression of Akt isoforms relative to housekeeping gene UBC determined via performing qPCR on the monocytes and derived M0 macrophages used here; data points show results from 3 independent donors. (D) Imaging cytometry analysis of staining of macrophage markers (CD14, CD68, and CD16) with eNOS and iNOS in M0 macrophages. All markers were significantly above the control (mouse IgG) except iNOS, which was upregulated in M1 macrophages; * p < 0.05 vs. IgG isotype control via one-way ANOVA with Dunnett’s post-test. (E) Fluo-4 Ca2+ trace (average of n = 3 experiments) showing response to 50 µM histamine inhibited by H1 antagonist cetirizine. The time of addition of histamine ± cetirizine is denoted by the arrow. (F) Immunofluorescence of Akt and eNOS in M0 macrophages. The nuclear DAPI stain is shown in yellow. The scale bar is 5 µm. (G) Isotype control (rabbit and goat serum) staining. All images are representative of images from cells from 3 independent donors collected and imaged on different days. The scale bar is 5 µm.
Figure 2
Figure 2
Visualization of SC79 Akt activation in M0 macrophages using fluorescent biosensors. (A) Schematic of the AktAR biosensor. Cerulean (cyan fluorescent protein (CFP) variant) and circularly permutated (cp) Venus (YFP variant) surround a forkhead-associated domain (FHA1)-phosphorylated amino acid binding domain and FOXO1 Akt substrate sequence. Akt phosphorylation causes a change in conformation, and a closer proximity of CFP and YFP increases FRET (an increase in the YFP/CFP emission ratio). (B) Representative traces from single experiments of AktAR2 YFP/CFP ratio changes in response to 1–10 µM SC79 ± MK2206 or LY294002. Time of addition of the indicated drugs is denoted by the arrow. (C) Bar graph of the same responses as in B from 4 independent experiments from different donors per condition. (D) Diagram of the TORCAR biosensor. Phosphorylation of the 4EBP1 motif brings CFP and YFP further apart and decreases FRET (an increased CFP/YFP emission ratio). (E) Representative traces from single experiments of TORCAR (or mutated T/A control TORCAR) FRET ratio changes in response to 1–10 µM SC79 ± rapamycin. Time of addition of the indicated drugs is denoted by the arrow. (F) Bar graph of the same responses as in (E) from 4 independent experiments from different donors per condition. Significance was determined via one-way ANOVA with Dunnett’s post-test, comparing values to the vehicle control; * p < 0.05.
Figure 3
Figure 3
SC79 activates NO production via Akt. (A) Bar graph of endpoint DAF-FM fluorescence from 5 independent experiments using macrophages from different donors. Responses were tested with 0.1–10 µg/mL SC79 ± Akt inhibitors MK2206 (10 µg/mL) or GSK690693 (10 µM), PKC inhibitor Gö6983 (10 µM), PKA inhibitor H89 (10 µM), NOS inhibitor L-NAME (10 µM), or inactive D-NAME (10 µM). Significance was determined via one-way ANOVA with Dunnett’s post-test, comparing values to those for HBSS alone; * p < 0.05. (B) DAF-FM fluorescence data with 1 and 10 µg/mL SC79 ± 10 µM CFTRinh172 pretreatment. No significant differences were determined via one-way ANOVA. (C) Representative real-time traces of DAF-FM fluorescence, ± L-NAME or D-NAME. Time of addition of the indicated drugs is denoted by the arrow. (D) Data from 5 independent experiments done similarly as in (C). Significance was determined via one-way ANOVA with Dunnett’s post-test, comparing values to those for SC79 alone; * p < 0.05.
Figure 4
Figure 4
SC79 activates cGMP production downstream of NO. (A) Representative traces of cGMP biosensor fluorescence changes with stimulation by 10 µg/mL SC79 vs. the vehicle (0.1% DMSO) only. An upward deflection corresponds to an increase in cGMP levels. Time of addition of the indicated drugs is denoted by the arrow. (B) Bar graph of results from independent experiments done similarly as in (A). Significance was determined via one-way ANOVA with Dunnett’s post-test, comparing values to those for HBSS plus the vehicle (0.1% DMSO) alone; * p < 0.05.
Figure 5
Figure 5
SC79 enhances FITC E. coli phagocytosis, likely via Akt and NO signaling. (A) Images showing phagocytosis of FITC-labeled E. coli (magenta, DAPI nuclear stain in green) in primary human monocyte-derived macrophages, as described [17,19]. (B) FITC fluorescence (indicating macrophage phagocytosis) increased with SC79 treatment, which was blocked by Akt inhibitor MK2206 or GSK690693 and NOS inhibitor L-NAME. Significance was determined via one-way ANOVA with Dunnett’s post-test, comparing all values to those of the control; * p < 0.05. Data are from 5 independent experiments using cells from 5 donors.
Figure 6
Figure 6
SC79 enhances pHrodo S. aureus phagocytosis, likely via Akt and NO signaling. (A) The phagocytosis of pHrodo S. aureus also increased with 10 µg/mL SC79 and was blocked by MK2206. Note that pHrodo only fluoresces in acidic environments like the phagosome, confirming that internalization reflects phagocytosis. Data were obtained from 5 independent experiments using cells from 5 donors. Significance was determined via one-way ANOVA with Bonferroni’s post-test; ** p < 0.01. (B) The same type of experiments as in A, but testing SC79 ± L-NAME or D-NAME; significance determined via one-way ANOVA with Dunnett’s post-test, comparing all values to those of the control (HBSS + 0.1% DMSO); ** p < 0.01. (C) The same type of experiments as in A and B, but testing SC79 ± guanylyl cyclase inhibitor ODQ or NS2028 or adenylyl cyclase inhibitor KH 7 (all at 10 µM); significance determined via one-way ANOVA with Dunnett’s post-test, comparing all values to those of the control (HBSS + 0.1% DMSO); ** p < 0.01. (D) Micrographs of pHrodo S. aureus phagocytosed in macrophages. Top and bottom rows show images from two different donors. (E) Quantification of 4 independent experiments, as shown in (D), confirming the dose-dependent increase in phagocytosis with SC79; significance was determined via one-way ANOVA with Dunnett’s post-test, comparing all values to those of the control; ** p < 0.01.
Figure 7
Figure 7
SC79 enhancement of phagocytosis is not altered by CFTRinh172. (A) The same type of FITC E. coli phagocytosis experiments as in Figure 5, testing the SC79 ± CFTRinh172 pretreatment. (B) The same type of phagocytosis experiments of pHrodo S. aureus as in Figure 6, but testing SC79 ± CFTRinh172 pretreatment. Significance was determined via one-way ANOVA with Bonferroni’s post-test with paired comparisons; * p < 0.05 vs. 0 µg/mL SC79 (HBSS + 0.1% DMSO vehicle control); n.s. means there was no statistical significance between bracketed groups. Data from 5–6 independent experiments per condition with macrophages from different donors.
Figure 8
Figure 8
SC79 enhances LPS or bacterial-induced superoxide production. (A) Bar graph of macrophage MitoSox Red fluorescence measured on plate reader (396 nm excitation, 610 nm emission) after 60 min stimulation with LPS or E. coli ± SC79. (B) Bar graph of macrophage dihydroethidium fluorescence (518 nm excitation, 605 nm emission) from experiments similar to those in (A). Data from 4–5 independent experiments per condition with macrophages from different donors; significance determined via one-way ANOVA with Bonferroni’s post-test with paired comparisons (±SC79); * p < 0.05.
Figure 9
Figure 9
Reduction in macrophage cytokines with SC79. (A) LDH release into cell culture media. Staurosporine and triton X-100 were controls used to induce apoptotic death (often followed by secondary necrosis in vitro [107]) and nonspecific lysis, respectively. No LDH was observed with SC79 (one-way ANOVA; Dunnett’s post-test; n = 4 experiments per condition from separate donors); * p > 0.05. (B) Macrophage IL-12 (M1 marker) or IL-10 (M2 marker) release determined by performing ELISA after 72 h on M1 cocktail (20 ng/mL IFNγ + 100 ng/mL LPS)- or M2-polarizing IL-4 (20 ng/mL). Significance was determined via one-way ANOVA with Bonferroni’s post-test, comparing values with those of M0 (no stimulation); * p > 0.05; n = 8 experiments per condition from separate donors. (C) Dose response of brusatol or ML385 with IL-6 release. Significance was determined via one-way ANOVA with Bonferroni’s post-test, comparing values with those of the control (no stimulation); * p > 0.05; n = 4 experiments from separate donors. (DF) Bar graphs of IL-6 (D), IL-8 (E), or IL-12 (F) release with SC79 (10 µg/mL) ± LPS (100 ng/mL) ± 10 nM brusatol or ML385, as indicated. Significance was determined via one-way ANOVA, with Bonferroni’s post-test; * p < 0.05 vs. control (media + vehicle) and # p < 0.05 between bracketed columns. n = 4–5 experiments from separate donors. (G) The same type of experiments as in D-F but using P. aeruginosa-conditioned media ± SC79 ± ML385. Significance was determined via one-way ANOVA with Bonferroni’s post-test; * p < 0.05 between bracketed columns. (H) IL-6 (green) or IL-8 (magenta) transcript with LPS ± SC79 ± ML385. Significance was tested via one-way ANOVA with Bonferroni’s post-test; * p < 0.05 vs. control and # p < 0.05 between bracketed columns; n = 4 experiments from separate donors. (I) Nrf2 target transcript levels with SC79 ± brusatol or ML385. Significance was tested via one-way ANOVA with Dunnett’s post-test; * p < 0.05 vs. control; n = 4 experiments from separate donors. (J) TNF transcript levels with LPS ± SC79. Significance was tested via one-way ANOVA with Dunnett’s post-test; * p < 0.05 vs. control; n = 4 experiments from separate donors.

Similar articles

Cited by

References

    1. Ahmad F., Rani A., Alam A., Zarin S., Pandey S., Singh H., Hasnain S.E., Ehtesham N.Z. Macrophage: A Cell With Many Faces and Functions in Tuberculosis. Front. Immunol. 2022;13:747799. doi: 10.3389/fimmu.2022.747799. - DOI - PMC - PubMed
    1. Pidwill G.R., Gibson J.F., Cole J., Renshaw S.A., Foster S.J. The Role of Macrophages in Staphylococcus aureus Infection. Front. Immunol. 2020;11:620339. doi: 10.3389/fimmu.2020.620339. - DOI - PMC - PubMed
    1. Reece M.D., Taylor R.R., Song C., Gavegnano C. Targeting Macrophage Dysregulation for Viral Infections: Novel Targets for Immunomodulators. Front. Immunol. 2021;12:768695. doi: 10.3389/fimmu.2021.768695. - DOI - PMC - PubMed
    1. Dupont M., Sattentau Q.J. Macrophage Cell-Cell Interactions Promoting HIV-1 Infection. Viruses. 2020;12:492. doi: 10.3390/v12050492. - DOI - PMC - PubMed
    1. Wang S., Liu R., Yu Q., Dong L., Bi Y., Liu G. Metabolic reprogramming of macrophages during infections and cancer. Cancer Lett. 2019;452:14–22. doi: 10.1016/j.canlet.2019.03.015. - DOI - PubMed

Publication types

MeSH terms

LinkOut - more resources