. 2024 May 29;13(11):938.
doi: 10.3390/cells13110938.

KR158 Spheres Harboring Slow-Cycling Cells Recapitulate High-Grade Glioma Features in an Immunocompetent System

Affiliations

KR158 Spheres Harboring Slow-Cycling Cells Recapitulate High-Grade Glioma Features in an Immunocompetent System

Avirup Chakraborty et al. Cells. .

Abstract

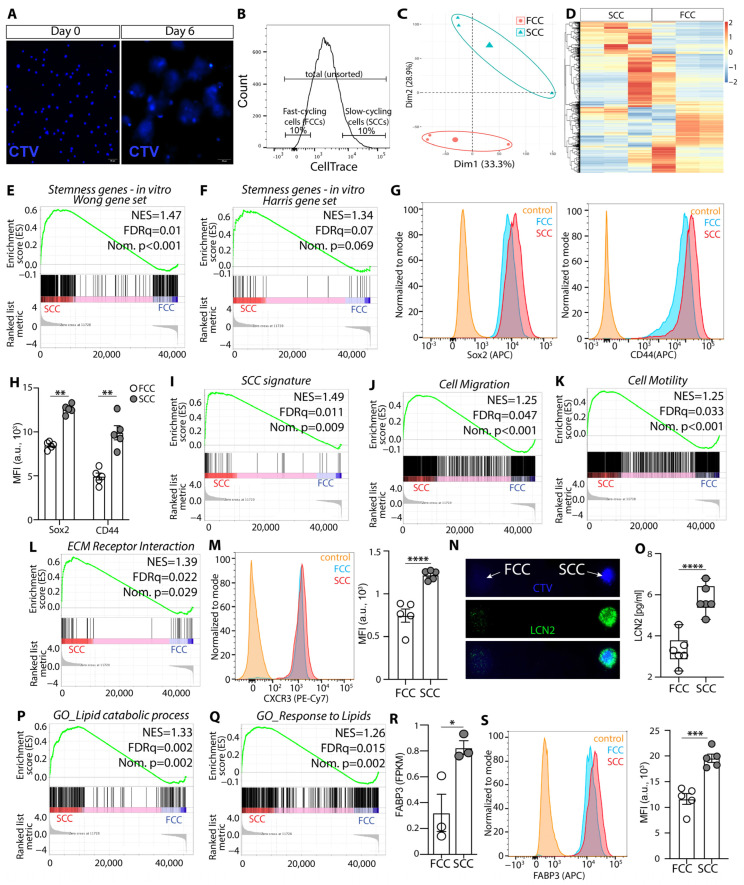
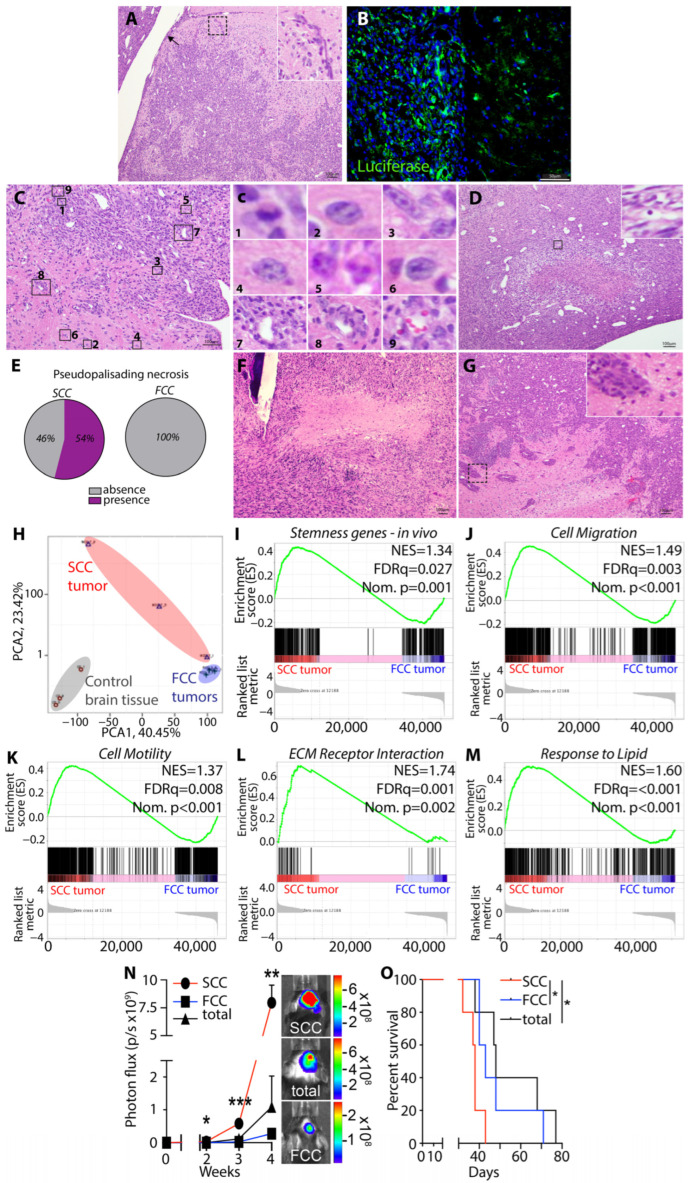
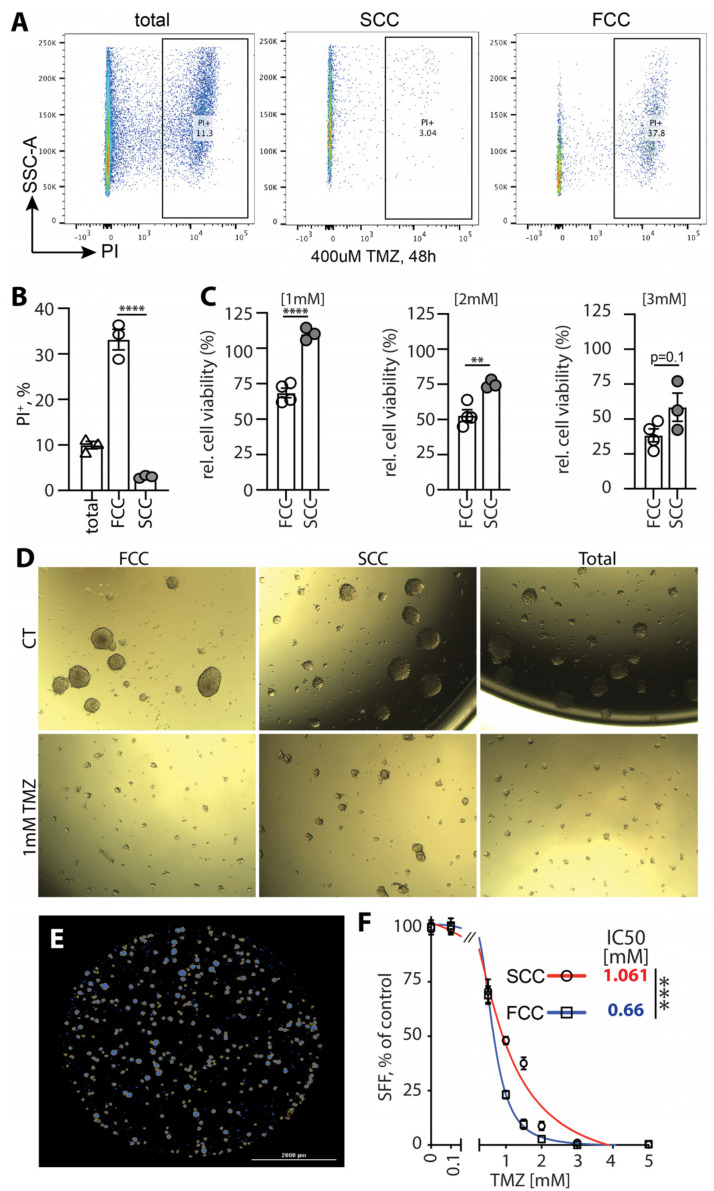
Glioblastoma (GBM) poses a significant challenge in clinical oncology due to its aggressive nature, heterogeneity, and resistance to therapies. Cancer stem cells (CSCs) play a critical role in GBM, particularly in treatment resistance and tumor relapse, emphasizing the need to comprehend the mechanisms regulating these cells. Also, their multifaceted contributions to the tumor microenvironment (TME) underline their significance, driven by their unique properties. This study aimed to characterize glioblastoma stem cells (GSCs), specifically slow-cycling cells (SCCs), in an immunocompetent murine GBM model to explore their similarities with their human counterparts. Using the KR158 mouse model, we confirmed that SCCs isolated from this model exhibited key traits and functional properties akin to human SCCs. KR158 murine SCCs, expanded in the gliomasphere assay, demonstrated sphere forming ability, self-renewing capacity, positive tumorigenicity, enhanced stemness and resistance to chemotherapy. Together, our findings validate the KR158 murine model as a framework to investigate GSCs and SCCs in GBM pathology, and explore specifically the SCC-immune system communications, understand their role in disease progression, and evaluate the effect of therapeutic strategies targeting these specific connections.

Keywords: cancer stem cells; glioblastoma; immunocompetent murine model; slow-cycling cells; tumor heterogeneity.


Conflict of interest statement

The authors declare no conflict of interest.

Figures

Figure 1
Figure 1
Differential transcriptomic profiles of KR158, GL261, and CT-2A, highlighting upregulation of genes associated with GBM-like features, especially in KR158. (A) PCA score plot from bulk RNA sequencing performed on tumors derived from GL261, CT-2A, and KR158 brain tissue (n = 3–4) showed that these tumor models exhibit different transcriptomic profiles. (B) Heatmaps showing DEGs of tumors derived from GL261, CT-2A, and KR158 brain tissue. Red and blue indicate relative over- or under-expression of genes, respectively. (CG) GSEA between tumors derived from the 3 tumor cell types for the following genesets (n = 3–4 per group); (C) stemness (signature from Wong et al. [38]); (D) cell migration (GO:0016477); (E) cell motility (GO:0048870); (F) ECM receptor interaction (KEGG mmu04512); (G) SCC gene signatures [19,20]. FDR, false discovery rate; NES, normalized enrichment score; Nom., nominal.
Figure 2
Figure 2
scRNA sequencing revealing cellular diversity in KR158 tumors. (A) UMAP visualization of pooled scRNA-seq data of 1000 CD45 negative cells of the tumor microenvironment from tumors derived from KR158 brain tissue. We identified 8 clusters, including tumor cells, microglia, endothelial cells, oligodendrocytes, astrocytes, fibroblasts, neurons, and epithelial cells. Tumor cell fraction contains subpopulation of SCCs (green) (22 cells) and FCCs (red) (22 cells). The respective percentage of each cell type is indicated in parenthesis. (B,C) Stemness geneset [38] (B) and cell motility (GO:0048870) scores (C) of each single cell were determined by using the Escape package. Scores were protected to UMAP by using the Seurat 4.0 FeaturePlot function.
Figure 3
Figure 3
KR158 murine glioma cells grown in the glioma sphere assay demonstrate tumor formation characterized by hallmarks of high-grade glioma. (A) Brightfield image of Luciferase-expressing KR158 cells (KLuc) murine glioma cells grow as spheres when cultured in serum-free medium supplemented with epidermal growth factor (EGF) and basic human fibroblast growth factor (hFGF). (B) Brightfield image of KLuc cells cultured in adherent and serum-containing conditions. (C,D) Scratch-wound assay; brightfield images acquired at time 0 (C) and 23 h (D) show the migratory behavior of the cells that were expanded in the gliomasphere assay. (E) Hematoxylin and eosin staining (H&E) show that intracranial implantation with KLuc cells cultured in serum-free conditions in C57BL6 mice demonstrate tumorigenicity with ability to generate tumors exhibiting GBM characteristics including infiltration. Tumor leading edge denoted by the dotted line, → indicates subpial spreading. (F) Luciferase labeling (green) further confirms invasive properties of KLuc into the host brain parenchyma. White arrowheads indicate luciferase+ cells that have migrated away from the tumor core, infiltrating the surrounding brain parenchyma. Nuclei are labeled with DAPI (blue). (G) H&E staining of tumors developed from cells cultured in the gliomasphere assay depicts the presence of giant cells, identified as #1–3, mitotic figures (#4–6), and clustering in perivascular regions (#7–9). Panel (g) represents higher magnification insets indicated by the rectangles in panel (G). (H) Presence of pseudopalisading necrosis further validates the formation of high-grade glioma-like disease from KLuc cells expanded in gliomasphere serum-free medium. ◾ indicates necrotic region, dotted line indicates pseudopalisade, ➤ indicates pyknotic nuclei. (I) H&E labeling of brain sections of animals implanted with KLuc cells cultured in serum-containing conditions. Image presenting a necrotic area lacking the GBM characteristic of pseudopalisading. (J) Fraction of necrotic regions displaying pseudopalisading. (K) Image indicating the limited infiltration of tumors generated by cells cultured in adherent serum-containing conditions. Tumor leading edge denoted by the dotted line. Shown are representative images from 5 mice per group.
Figure 4
Figure 4
KR158 murine glioma cells grown in serum-free medium are enriched in stemness genes. (A) PCA score plot from bulk RNA sequencing performed on brain tumor tissue generated by KR158 cells cultured adherent in serum or serum-free gliomasphere assay (n = 3), showed that these tumor models exhibit different transcriptomic profiles. (B) Heatmap showing DEGs of tumors formed by KR158 cells cultured in serum or serum-free gliomasphere assay (n = 3). Red and blue indicate relative over- or under-expression of genes, respectively. (C,D) GSEA of RNA sequencing data from in vivo tumors (n = 3 per group) shows an enrichment of stemness gene signature in tumors generated by cells cultured in serum-free conditions compared to cells expanded in serum-containing conditions using gene signature from (C): Wong et al. [38] and (D) Harris Brain Cancer Progenitors gene set [39], systematic name M1694; FDR, false discovery rate; NES, normalized enrichment score; Nom., nominal. (E) Search Tool for the Retrieval of Interacting Genes/Proteins (STRING) database analysis identified computational predictions defining functional associations between the genes upregulated in the KR158 cells expanded in the gliomasphere assay and mechanisms regulating the development of the nervous system.
Figure 5
Figure 5
SCC KR158 cells grown in serum-free conditions up-regulate stemness, migration, and lipid metabolism characteristics compared to FCC cells. (A) Cell trace labeling of KR158 cells grown in the gliomasphere assay at Day 0 and Day 6. (B) Fluorescent-activated cell sorting of KLuc cells were performed on Day 6; top 10% of the cells with highest CTV retention were sorted and defined as SCCs and the bottom 10% of cells with least CTV retention as FCCs. (C) PCA score plot from bulk RNA sequencing performed on tumors derived from SCC and FCC brain tissue (n = 3), showed that these tumor models exhibit different transcriptomic profiles. (D) Heatmap showing DEGs of tumors derived from SCC and FCC brain tissue (n = 3). Red and blue indicate relative over- or under-expression of genes, respectively. GSEA of in vitro RNA-Seq datasets between gliomasphere serum-free cultured SCC (n = 3) and FCC (n = 3); (E) stemness geneset [38]; (F) stemness geneset (M1694) [39]. (G) Flow cytometric analysis (representative histograms) of Sox2 and CD44 expression in SCCs and FCCs. (H) Bar diagram quantifying flow analysis for Sox2 and CD44 expression in SCC vs. FCC, n = 5, t-test ** p < 0.01. (I) SCC gene signature [19,20]; (J) cell migration (GO:0016477); (K) cell motility (GO:0048870); (L) ECM receptor interaction (KEGG mmu04512); FDR, false discovery rate; NES, normalized enrichment score; Nom., nominal. (M) Representative histogram comparing CXCR3 expression in SCCs and FCCs using flow cytometry, and bar diagram (n = 5), **** p < 0.0001, t-test. (N) Immunofluorescence microscopy images of a representative single SCC (CTV positive, blue) and FCC (CTV negative/low) labeled for LCN2 (green). (O) Quantification using ELISA of LCN2 secreted by SCCs and FCCs, n = 6, ****, p < 0.001, t-test. (P) Lipid catabolic process (GO:0016042); (Q) response to lipid (GO:0071396). (R) Bar graph comparing FABP3 gene expression level in SCC and FCC from bulk RNA sequencing (n = 3), *, p < 0.05, t-test. (S) Flow cytometric comparison of FABP3 protein level in SCCs and FCCs, n = 5, *** p < 0.005, t-test.
Figure 6
Figure 6
Murine glioma SCCs grown in the gliomasphere assay are tumorigenic with enhanced stemness. SCCs demonstrated the ability to generate high-grade glioma-like disease as seen by high levels of tumor cell infiltration observed by H&E ((A), → indicates subpial spreading). The inset represents a higher magnification of the invasive front exhibiting tentacle-like infiltration. (B) Luciferase labeling further illustrates the infiltrative nature of the cells. Nuclei are labeled with DAPI (blue). (C) Presence of mitotic figures (#1–6) and perivascular clustering (#7–9). Panel (c) represents higher magnification insets of the panel (C) rectangles. (D) Pseudopalisading necrosis in SCC tumors (inset showing a higher magnification of a pyknotic nucleus). (E) Pie charts indicating the percentage of necrotic areas exhibiting pseudopalisading. (F) H&E staining of FCC tumors illustrating the presence of necrosis lacking pseudopalisading. (G) FCC tumors show features of infiltration. The inset represents a higher magnification of the invasive front showing grouped infiltration. (H) PCA score plot from RNA sequencing performed on tumors derived from SCCs and FCCs and control brain tissue (n = 3) showed that these different tumor cell populations maintain transcriptome diversity upon tumor progression. GSEA of in vivo RNA-Seq datasets between tumors derived from SCCs and FCCs (n = 3 per group) comparing the following signatures (I) stemness [38]; (J) cell migration (GO:0016477), (K) cell motility (GO:0048870); (L) ECM receptor interaction (KEGG mmu04512) and (M) response to lipids (GO:0071396). FDR, false discovery rate; NES, normalized enrichment score; Nom., nominal. (N) Intracranial tumor growth monitored using bioluminescence in vivo imaging capturing luciferase activity in immunocompetent mice implanted with SCCs and FCCs (n = 5). t-test, *, **, ***, p < 0.05, p < 0.01, p < 0.005, respectively. (O) Kaplan–Meier survival curves of immunocompetent animals implanted with SCCs compared to FCCs or total unsorted cells. * p < 0.05, log-rank test.
Figure 7
Figure 7
SCC KR158 cells are more resistant to TMZ. (A,B) PI incorporation assay within the tumor cells upon 48 h of treatment with 400µM TMZ; Representative flow dot plots (A) with quantification of three independent experiments, (B) **** p < 0.001, one-way ANOVA with Tukey post-test). (C) Representative bar diagram of relative cell viability of SCCs and FCCs using the fluorescence-based CyQUANT cell proliferation assay performed 48 h after exposure to 1, 2, and 3 mM TMZ. Values represent mean +/− SEM, **** p < 0.001, ** p < 0.01, t-test. Brightfield (D) and fluorescent (DAPI) (E) examples of gliomaspheres generated from the different KR158 cell populations treated with TMZ. (F) TMZ dose-response was evaluated by comparing the SFF between SCCs and FCCs treated with a range of concentrations (0.1, 0.5, 1, 1.5, 2, 3, 5 mM). Values represent mean +/− SEM, expressed as percentage of untreated conditions, n = 10–20. IC50s for each population were calculated using non-linear regression sigmoidal dose-response, *** p < 0.005.

Update of

Similar articles

Cited by

References

    1. Badr C.E., Silver D.J., Siebzehnrubl F.A., Deleyrolle L.P. Metabolic heterogeneity and adaptability in brain tumors. Cell. Mol. Life Sci. 2020;77:5101–5119. doi: 10.1007/s00018-020-03569-w. - DOI - PMC - PubMed
    1. Gimple R.C., Bhargava S., Dixit D., Rich J.N. Glioblastoma stem cells: Lessons from the tumor hierarchy in a lethal cancer. Genes Dev. 2019;33:591–609. doi: 10.1101/gad.324301.119. - DOI - PMC - PubMed
    1. Lathia J.D., Mack S.C., Mulkearns-Hubert E.E., Valentim C.L., Rich J.N. Cancer stem cells in glioblastoma. Genes Dev. 2015;29:1203–1217. doi: 10.1101/gad.261982.115. - DOI - PMC - PubMed
    1. Nicholson J.G., Fine H.A. Diffuse Glioma Heterogeneity and Its Therapeutic Implications. Cancer Discov. 2021;11:575–590. doi: 10.1158/2159-8290.CD-20-1474. - DOI - PubMed
    1. Silver A., Feier D., Ghosh T., Rahman M., Huang J., Sarkisian M.R., Deleyrolle L.P. Heterogeneity of glioblastoma stem cells in the context of the immune microenvironment and geospatial organization. Front. Oncol. 2022;12:1022716. doi: 10.3389/fonc.2022.1022716. - DOI - PMC - PubMed