. 2024 Jun 4;13(11):971.
doi: 10.3390/cells13110971.

Hypoxia Increases the Efficiencies of Cellular Reprogramming and Oncogenic Transformation in Human Blood Cell Subpopulations In Vitro and In Vivo

Affiliations

Hypoxia Increases the Efficiencies of Cellular Reprogramming and Oncogenic Transformation in Human Blood Cell Subpopulations In Vitro and In Vivo

Adrián Moratilla et al. Cells. .

Abstract

Patients with chronic hypoxia show a higher tumor incidence; however, no primary common cause has been recognized. Given the similarities between cellular reprogramming and oncogenic transformation, we directly compared these processes in human cells subjected to hypoxia. Mouse embryonic fibroblasts were employed as controls to compare transfection and reprogramming efficiency; human adipose-derived mesenchymal stem cells were employed as controls in human cells. Easily obtainable human peripheral blood mononuclear cells (PBMCs) were chosen to establish a standard protocol to compare cell reprogramming (into induced pluripotent stem cells (iPSCs)) and oncogenic focus formation efficiency. Cell reprogramming was achieved for all three cell types, generating actual pluripotent cells capable for differentiating into the three germ layers. The efficiencies of the cell reprogramming and oncogenic transformation were similar. Hypoxia slightly increased the reprogramming efficiency in all the cell types but with no statistical significance for PBMCs. Various PBMC types can respond to hypoxia differently; lymphocytes and monocytes were, therefore, reprogrammed separately, finding a significant difference between normoxia and hypoxia in monocytes in vitro. These differences were then searched for in vivo. The iPSCs and oncogenic foci were generated from healthy volunteers and patients with chronic obstructive pulmonary disease (COPD). Although higher iPSC generation efficiency in the patients with COPD was found for lymphocytes, this increase was not statistically significant for oncogenic foci. Remarkably, a higher statistically significant efficiency in COPD monocytes was demonstrated for both processes, suggesting that physiological hypoxia exerts an effect on cell reprogramming and oncogenic transformation in vivo in at least some cell types.

Keywords: adipose-derived stem cells; cellular reprograming; chronic obstructive pulmonary disease; hypoxia; induced pluripotent stem cells; peripheral blood mononuclear cells.


Conflict of interest statement

The authors declare no conflicts of interest.

Figures

Figure 1
Figure 1
Reprogrammed cell colonies are pluripotent. (A) Phase contrast microscopy (a,c,e) and alkaline phosphatase (AP) staining (b,d,f) of reprogrammed cell colonies from PBMCs (a,b), ADSCs (c,d), and MEFs (e,f). (B) In vitro embryoid body (EB) formation and characterization of reprogrammed cells by immunofluorescence for markers of the three embryonic layers. (ad,ik): Reprogrammed cells from MEFs. (eh,ln): Reprogrammed cells from PBMCs. (in): Negative controls for secondary antibodies showing no staining (FITC negative control and Texas Red negative control). EBs are positive for several embryonic layers (albumin for endoderm, vimentin for mesoderm, and cytokeratins for ectoderm). 4’,6-Diamidino-2-phenylindole (DAPI) was employed to stain cell nuclei. Colonies are now negative for AP, given that differentiation has occurred. Bars: 50 or 100 μm, as indicated.
Figure 2
Figure 2
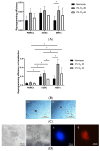
(A) Effects of various oxygen concentrations and timings on cell reprogramming. Normoxia (black bars), 3% O2 from day 0 of reprogramming (gray bars), and 3% O2 from day 4 (white bars). The asterisk denotes significant differences at p ≤ 0.05. (B) Reprogramming efficiency with respect to transfection efficiency at various oxygen concentrations in cell reprogramming of the three cell types used. Normoxia (black bars), 3% O2 from day 0 of reprogramming (gray bars), and 3% O2 from day 4 (white bars). Asterisks denote statistically significant differences at p ≤ 0.05. (C) Pluripotency is associated with alkaline phosphatase expression, which is revealed with Fast Red. The iPSCs and OFs were successfully generated from blood cells from the same donor. (D) (a) Phase contrast microscopy of oncogenic focus growing without anchorage in MethoCult. (bd) Immunohistochemistry of oncogenic focus (growing attached) for leukemia inhibitory factor receptor (d, in red) (c: nuclei in blue with DAPI) and (b) OF in phase contrast. Bars: 100 μm.
Figure 3
Figure 3
Quantitative RT-PCR for pluripotency genes after iPSC and OF derivations from PBMCs under different metabolic conditions. Data are expressed as expressions relative to β2-microglbulin. Significant differences at p ≤ 0.05 are as follows: *: compared with PBMCs; ●: compared with iPSCs derived in normoxia; Δ: compared with OFs derived in normoxia; ♦: compared with iPSCs derived in 3% O2; ○: compared with OFs derived in 3% O2; ▼: compared with iPSCs derived in 5% O2.
Figure 4
Figure 4
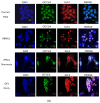
Characterization of iPSC and OF protein markers by immunofluorescence. (A) Oct3/4 (FITC, green) and Klf4 (TR, red) colocalization in the cells’ nuclei. (B) LIFRβ (FITC, green) in the cells’ cytoplasms. Hela cells in the first row as positive controls and in the second one as negative controls. (C) c-Myc (FITC, green) labelling in the cells’ nuclei. Hela cells in the first row as positive controls and in the second one as negative controls. Cell nuclei were stained with 4’,6-Diamidino-2-phenylindole (DAPI). Bars: 200 μm.
Figure 4
Figure 4
Characterization of iPSC and OF protein markers by immunofluorescence. (A) Oct3/4 (FITC, green) and Klf4 (TR, red) colocalization in the cells’ nuclei. (B) LIFRβ (FITC, green) in the cells’ cytoplasms. Hela cells in the first row as positive controls and in the second one as negative controls. (C) c-Myc (FITC, green) labelling in the cells’ nuclei. Hela cells in the first row as positive controls and in the second one as negative controls. Cell nuclei were stained with 4’,6-Diamidino-2-phenylindole (DAPI). Bars: 200 μm.
Figure 5
Figure 5
(A) Comparison of reprogramming efficiency (to iPSCs) versus transformation efficiency (OFs) of human peripheral mononuclear blood cells (PBMCs) from healthy donors 3, 6, 8, and 21 days after nucleofection under normoxic conditions. No statistically significant differences were observed at p ≤ 0.05. Data are shown in percentages with respect to the transfection efficiency. (B) Comparative efficiencies of iPSC formation in normoxia (black bars) versus 3% O2 (gray bars) on different days from healthy donor PBMCs. (C) Kinetics of reprogramming. There was a statistically significant difference at 3% O2 between days 3 and 8 (asterisk at p ≤ 0.05). (D) Comparison of reprogramming efficiencies at 20% versus 5% versus 3% oxygen levels. No differences between the reprogramming efficiency (iPSCs) versus the transformation efficiency (OFs) of human PBMCs from healthy donors 3 days after nucleofection were encountered at 5% O2 levels (left). Comparative efficiencies of iPSC formation in normoxia versus 3% O2 or 5% O2 at day 3 from healthy donor PBMCs (center). There was a statistically significant difference in the reprogramming efficiency only at 3% O2 at day 3 compared with normoxia (asterisk at p ≤ 0.05). No differences in the OF derivation efficiency (right) were observed. Data are from n = 2 donors × 2 technical replicates.
Figure 6
Figure 6
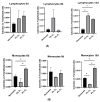
(A) Histochemistry for alkaline phosphatase (in red) of reprogrammed and transformed colonies; iPSCs and OFs were successfully generated from monocytes and lymphocytes from the same donor. (B) Kinetics of lymphocyte and monocyte subpopulation reprogramming under normoxic and 3% O2 conditions. Asterisks: statistically significant differences at p ≤ 0.05.
Figure 7
Figure 7
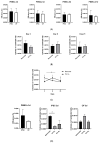
Comparative reprogramming efficiency (black bars) and oncogenic transformation efficiency (white bars) in blood cell subpopulations (monocytes and lymphocytes) from healthy donors at day 6 (A) or day 16 (B). Statistically significant differences were found between monocyte and lymphocyte reprogrammings (asterisks at p ≤ 0.05). No statistically significant differences were found between efficiencies of reprogrammings (circles) and oncogenic transformations (squares) (C,D); n = 3 donors and 4 technical replicates.
Figure 8
Figure 8
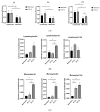
(A): Comparison of reprogramming efficiencies on different days after nucleofection (days 6, 8, and 15) and under normoxia and 3% O2 conditions. (B,C): Comparison of reprogramming efficiencies on different days after nucleofection (days 6, 8, and 15) and under normoxia or 3% O2 or 5% O2 conditions both for lymphocyte (B) and monocyte (C) subpopulations. Asterisks: Statistically significant differences at p ≤ 0.05.
Figure 9
Figure 9
Comparison of oncogenic transformations on different days after nucleofection (days 6, 8, and 15) and under normoxia or 3% or 5% O2 conditions both for lymphocyte (A) and monocyte (B) subpopulations. Asterisks: Statistically significant differences at p ≤ 0.05.
Figure 10
Figure 10
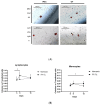
Reprogrammed cells from patients with COPD. (A) (a) Phase contrast microscopy of OFs from lymphocytes; (b) iPSCs from lymphocytes; (c) OFs from monocytes; (d) iPSCs from monocytes. (B) Comparison of cell reprogramming and oncogenic transformation efficiencies in lymphocytes from patients with COPD compared with healthy donors. (C) Comparison of the efficiencies of cell reprogramming and oncogenic transformation in monocytes from patients with COPD compared with healthy donors. Asterisks: Statistically significant differences at p ≤ 0.05.

Similar articles

Cited by

References

    1. Wallace D.C. Mitochondrial DNA Mutations in Disease and Aging. Environ. Mol. Mutagen. 2010;51:440–450. doi: 10.1002/em.20586. - DOI - PubMed
    1. Hasin T., Gerber Y., McNallan S.M., Weston S.A., Kushwaha S.S., Nelson T.J., Cerhan J.R., Roger V.L. Patients with Heart Failure Have an Increased Risk of Incident Cancer. J. Am. Coll. Cardiol. 2013;62:881–886. doi: 10.1016/j.jacc.2013.04.088. - DOI - PMC - PubMed
    1. Kobayashi S., Yanai M., Hanagama M., Yamanda S. Burden of Chronic Obstructive Pulmonary Disease in the Elderly Population. Respir. Investig. 2014;52:296–301. doi: 10.1016/j.resinv.2014.04.005. - DOI - PubMed
    1. Figueira Gonçalves J.M., Dorta Sánchez R., Pérez Méndez L.I., Pérez Negrín L., García-Talavera I., Pérez Rodríguez A., Díaz Pérez D., Viña Manrique P., Guzmán Sáenz C. Incidence of Cancer in Outpatients with Chronic Obstructive Pulmonary Disease. Rev. Clin. Esp. Engl. Ed. 2017;217:387–393. doi: 10.1016/j.rce.2017.06.004. - DOI - PubMed
    1. Chen D.S., Mellman I. Oncology Meets Immunology: The Cancer-Immunity Cycle. Immunity. 2013;39:1–10. doi: 10.1016/j.immuni.2013.07.012. - DOI - PubMed

Publication types

LinkOut - more resources