. 2024 May 31;13(11):1532.
doi: 10.3390/plants13111532.

Phospholipid Signaling in Crop Plants: A Field to Explore

Affiliations

Phospholipid Signaling in Crop Plants: A Field to Explore

Lucas Amokrane et al. Plants (Basel). .

Abstract

In plant models such as Arabidopsis thaliana, phosphatidic acid (PA), a key molecule of lipid signaling, was shown not only to be involved in stress responses, but also in plant development and nutrition. In this article, we highlight lipid signaling existing in crop species. Based on open access databases, we update the list of sequences encoding phospholipases D, phosphoinositide-dependent phospholipases C, and diacylglycerol-kinases, enzymes that lead to the production of PA. We show that structural features of these enzymes from model plants are conserved in equivalent proteins from selected crop species. We then present an in-depth discussion of the structural characteristics of these proteins before focusing on PA binding proteins. For the purpose of this article, we consider RESPIRATORY BURST OXIDASE HOMOLOGUEs (RBOHs), the most documented PA target proteins. Finally, we present pioneering experiments that show, by different approaches such as monitoring of gene expression, use of pharmacological agents, ectopic over-expression of genes, and the creation of silenced mutants, that lipid signaling plays major roles in crop species. Finally, we present major open questions that require attention since we have only a perception of the peak of the iceberg when it comes to the exciting field of phospholipid signaling in plants.

Keywords: crop species; diacylglycerol kinase; environmental stresses; lipid signaling; phosphatidic acid; phospholipase; protein structure; signaling.


Conflict of interest statement

The authors declare no conflict of interest.

Figures

Figure 1
Figure 1
Schematic representation of phosphoglycerolipid structure and pathways leading to PA production in plants: (A) A phosphoglycerolipid structure with indicated sites of hydrolysis by phospholipases C and D. Light blue boxes: fatty acids; pink box: glycerol; brown box: phosphate. R is for polar head group. Fatty acid composition and desaturation level of a phosphoglycerolipid can differ. Shown here is what is known as “16:0–18:1 phosphoglycerolipid” containing a saturated fatty acid with a 16-carbon chain in the sn-1 position and a monounsaturated fatty acid with an 18-carbon chain in the sn-2 position. (B) A simplified scheme of pathways leading to PA production. PLD, phospholipase D; NPC, non-specific phospholipase; PI-PLC, phosphoinositide-dependent phospholipases C; DGK, diacylglycerol kinase; DAG, diacylglycerol.
Figure 2
Figure 2
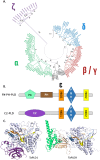
Structural features of the PLD family in plants: (A) Phylogenetic tree showing the different PLDs. The accession numbers of the protein sequences used can be found in Table S1. The scale bar refers to a phylogenetic distance that is the average number of substitutions per site (here 0.5). Numbers on the branches indicate bootstrap percentage after 1000 replications in constructing the tree. (B) Schematic representation of the structural domains in plant PLDs. Purple, C2 domain; green, PX domain; brown, PH domain; orange, first HKD domain; yellow, second HKD domain; red, PIP2 binding region 1 (PBR1 domain [44]). (C) Structural differences between C2-PLDs and PX-PH-PLDs. TaPLD1, a wheat (Triticum aestivum) PLD of the α-subtype, was chosen as representative of C2-PLDs, while TaPLD9, a PLD of the ζ-subtype, was chosen as representative of PX-PH-PLDs. Note that for TaPLD9, non-structured parts of the protein were represented here. A full representation can be found as Figure S1. The color code used is the same as in (B). The Alphafold2 structures can also be colored based on the confidence with which each domain is modeled (Figure S5).
Figure 3
Figure 3
Structural features of the active site of selected plant PLDs: (A) Predicted structure of TaPLD1. The black rectangle indicates the substrate binding pocket. The molecule inside the pocket is a diC8-PA. We positioned it by overlapping the predicted TaPLD1 sequence with that of AtPLDα1 crystallized with diC8-PA [43]. (B) Detailed view of diC8-PA inside the active site. (C) Consensus motifs of HKD1 and HKD2. HKD1 and HKD2 refer to the first and second HKD domain starting from the N-terminus part of PLD. Asterisks (*) indicate the conserved His, Lys, and Asp. (D) Detailed view from the active site of TaPLD1. Colored in green are the lateral chains of the catalytic His, Lys, and Asp residues of the HKD domains shown within the TaPLD1 structure. Colored in magenta are the lateral chains of the residues involved in calcium binding as shown in [43]. Purple, C2 domain; orange, first HKD domain; yellow, second HKD domain; red, PI-4,5-P2 binding region 1 (PBR1 domain) [44].
Figure 7
Figure 7
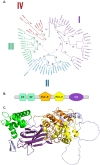
Structural features of plant PI-PLC family members: (A) Phylogenetic tree of different PI-PLCs. The accession numbers of the protein sequences used can be found in Table S3. The scale bar refers to a phylogenetic distance that is the average number of substitutions per site (here 0.5). Numbers on the branches indicate bootstrap percentage after 1000 replications in constructing the tree. (B) Schematic representation of the structural domains in plant PI-PLCs. Purple, C2 domain; green, PX domain; green, EF domain; orange, PLC-X domain; yellow, PLC-Y domain. (C) Structural model of TaPI-PLC2-1A. Purple, C2 domain; green, PX domain; green, EF domain; orange, PLC-X domain; yellow, PLC-Y domain. The Alphafold2 structures can also be colored based on the confidence with which each domain is modeled (Figure S5).
Figure 8
Figure 8
Structural features of the catalytic region of crop PI-PLCs: (A) Motif conservation of catalytic residues. Numbering refers to the residues of rat PLCδ1. (B) Structure of the region containing the catalytic residues of TaPI-PLC-2-1A.
Figure 9
Figure 9
Structural features of RBOH orthologs: (A) Phylogenetic tree of different RBOHs. The accession numbers of the protein sequences used can be found in Table S4. The scale bar refers to a phylogenetic distance that is the average number of substitutions per site (here 0.5). Numbers on the branches indicate bootstrap percentage after 1000 replications in constructing the tree. (B) Predicted structure of Arabidopsis AtRBOHD. The structure was predicted by AlphaFold2. The color code corresponds to model confidence as defined by AlphaFold2. AlphaFold2 produces a per-residue confidence score, named “predicted local distance difference test” (pLDDT), which ranges between 0 and 100. The Alphafold2 structures can also be colored based on the confidence with which each domain is modeled (Figure S5).
Figure 4
Figure 4
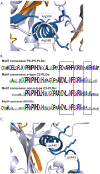
Structural features of the PBR1 domain in plant PLDs: (A) Positions of the Arg in the ARxARFH submotif of the PBR1 domain of PX-PH-PLDs. The lateral chain of the Arg of the ARxARFH submotif of TaPLD9 is colored blue. The PBR1 domain is blue. (B) Motif consensus of PBR1. Consensus was calculated considering all PLDs of Table S1, but also considering only PX-PH-PLDs, α-subtype C2-PLDs, and non-α-subtype C2-PLDs. (C) Positions of the Lys in the PBR1 domain of TaPLD10, a non-α-subtype C2-PLDs.
Figure 5
Figure 5
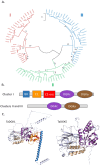
Structural features of plant DGK family members: (A) Phylogenetic tree showing different DGKs. The scale bar refers to a phylogenetic distance that is the average number of substitutions per site (here 0.5). Numbers on the branches indicate bootstrap percentage after 1000 replications in constructing the tree. (B) Schematic representation of the structural domains in plant DGKs. Purple, DGKc; brown, DGKa; blue, N-terminal basic region; orange, C1 domain; red, C1 extended domain. (C) Structural differences between cluster I-DGKs and cluster II/III-DGKs. TaDGK1, was chosen as a representative of a cluster I DGK, while TaDGK5 was chosen as a representative of a cluster II/III DGK. Purple, DGKc; brown, DGKa; blue, N-terminal basic region; orange, C1 domain; red, C1 extended domain. The Alphafold2 structures can also be colored based on the confidence with which each domain is modeled (Figure S5).
Figure 6
Figure 6
Structural features of the GGDG motif of the active site of DGKs: (A) Motif conservation of the GGDG region. (B) Structure of the GGDG region of TaDGK5. The GGDG region appears in red. It is located within the DGKc domain (in purple); it is at the interphase with the DGKa domain (in brown).

Similar articles

Cited by

References

    1. Furt F., Simon-Plas F., Mongrand S. Lipids of the Plant Plasma Membrane. In: Murphy A.S., Schulz B., Peer W., editors. The Plant Plasma Membrane. Springer; Berlin/Heidelberg, Germany: 2011. pp. 3–30.
    1. Uemura M., Joseph R.A., Steponkus P.L. Cold Acclimation of Arabidopsis thaliana (Effect on Plasma Membrane Lipid Composition and Freeze-Induced Lesions) Plant Physiol. 1995;109:15–30. doi: 10.1104/pp.109.1.15. - DOI - PMC - PubMed
    1. Cacas J.L., Buré C., Grosjean K., Gerbeau-Pissot P., Lherminier J., Rombouts Y., Maes E., Bossard C., Gronnier J., Furt F., et al. Revisiting Plant Plasma Membrane Lipids in Tobacco: A Focus on Sphingolipids. Plant Physiol. 2016;170:367–384. doi: 10.1104/pp.15.00564. - DOI - PMC - PubMed
    1. Li H.-m., Yu C.-W. Chloroplast Galactolipids: The Link Between Photosynthesis, Chloroplast Shape, Jasmonates, Phosphate Starvation and Freezing Tolerance. Plant Cell Physiol. 2018;59:1128–1134. doi: 10.1093/pcp/pcy088. - DOI - PubMed
    1. Hac-Wydro K., Wydro P. The influence of fatty acids on model cholesterol/phospholipid membranes. Chem. Phys. Lipids. 2007;150:66–81. doi: 10.1016/j.chemphyslip.2007.06.213. - DOI - PubMed

LinkOut - more resources