. 2024 Jun 6;13(11):1574.
doi: 10.3390/plants13111574.

Integrating NDVI, SPAD, and Canopy Temperature for Strategic Nitrogen and Seeding Rate Management to Enhance Yield, Quality, and Sustainability in Wheat Cultivation

Affiliations

Integrating NDVI, SPAD, and Canopy Temperature for Strategic Nitrogen and Seeding Rate Management to Enhance Yield, Quality, and Sustainability in Wheat Cultivation

Oussama Hnizil et al. Plants (Basel). .

Abstract

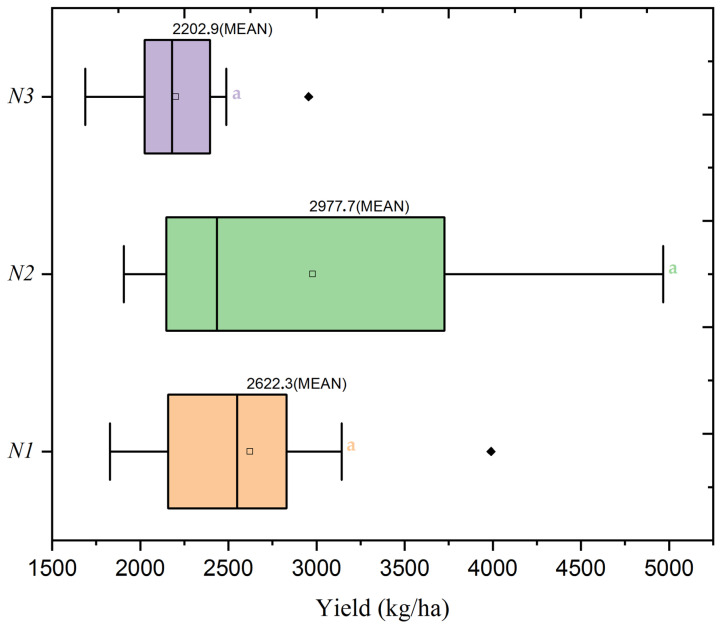
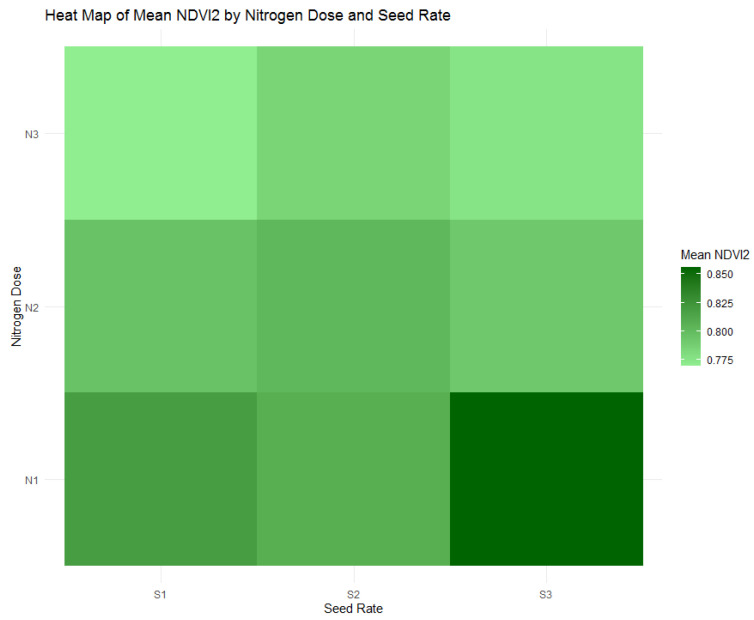
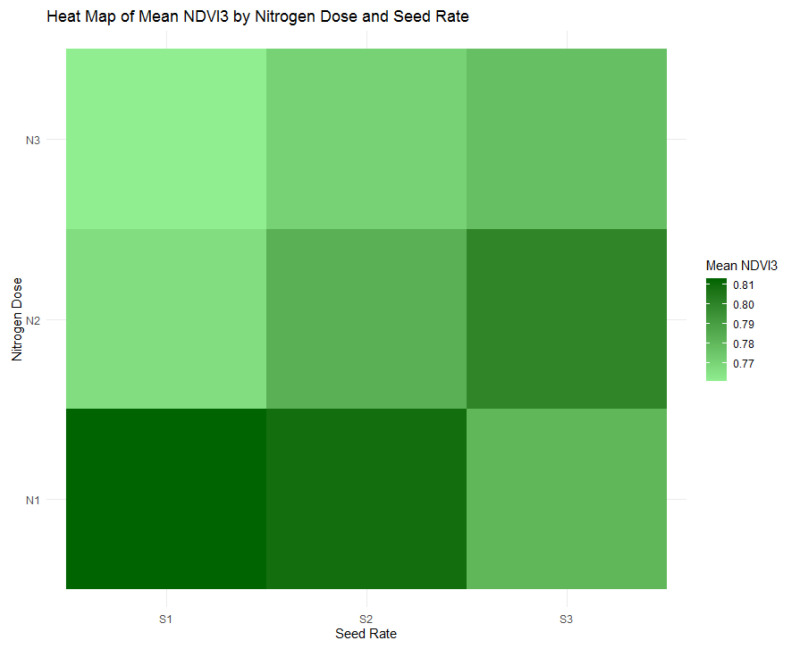
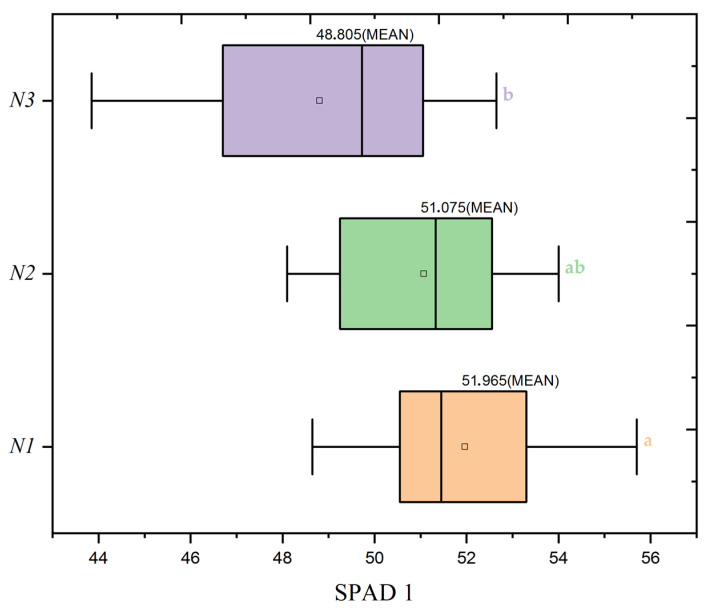
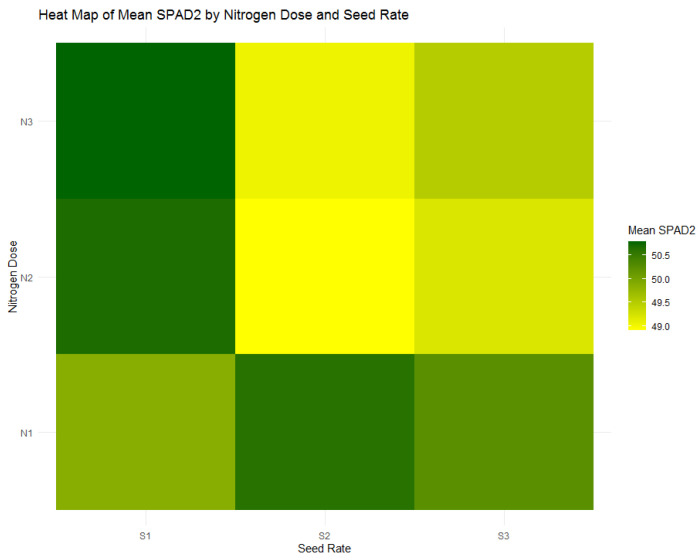
This study explores the interplay between nitrogen doses and seeding rates on wheat yield, biomass, and protein content. Utilizing tools such as the Normalized Difference Vegetation Index (NDVI), Soil Plant Analysis Development (SPAD) measurements, and canopy temperature (CT), we conducted experiments over five growing seasons. The treatments included three nitrogen levels (0, 60, 120 kg/ha) and three seeding rates (300, 400, 500 seeds/m2) in a split-plot design with 90 plots and two replications. Our results show that an intermediate nitrogen dose (60 kg/ha) combined with a moderate seed rate (400 seeds/m2) enhances wheat yield by 22.95%. Reduced nitrogen levels increased protein content, demonstrating wheat's adaptive mechanisms under nitrogen constraints. NDVI analysis highlighted significant growth during the tillering phase with high nitrogen, emphasizing early-stage nutrient management. SPAD measurements showed that early nitrogen applications boost chlorophyll content, essential for vigorous early growth, while CT data indicate that optimal nitrogen and seed rates can effectively modulate plant stress responses. As crops mature, the predictive capacity of NDVI declines, indicating the need for adjusted nitrogen strategies. Collectively, these findings advocate for refined management of nitrogen and seeding rates, integrating NDVI, SPAD, and CT assessments to enhance yields and promote sustainable agricultural practices while minimizing environmental impacts.

Keywords: biomass; chlorophyll measurement; nitrogen efficiency; protein content; remote sensing; seeding strategy; wheat growth; yield.


Conflict of interest statement

The authors declare no conflicts of interest.

Figures

Figure 1
Figure 1
Implementation of precision measurement techniques in our field research. (a) Use of a multispectral radiometer for NDVI measurement. (b) SPAD-502 Plus meter used for assessing chlorophyll content. (c) Infrared thermometer for canopy temperature analysis.
Figure 2
Figure 2
Heatmap of wheat mean yield variation by nitrogen dose (N1: 120 kg/ha, N2: 60 kg/ha, N3: 0 kg/ha) and seed rate (S1: 500 seeds/m2, S2: 400 seeds/m2, S3: 300 seeds/m2).
Figure 3
Figure 3
Boxplot of wheat yield distribution by nitrogen application levels (N1: 120 kg/ha, N2: 60 kg/ha, N3: 0 kg/ha) at the mean seed rate (S2: 400 seeds/m2). The black diamond symbol indicates outliers. Significance levels were determined by one-way ANOVA and subsequent Tukey test. Different letters indicate significant differences among the nitrogen application levels.
Figure 4
Figure 4
Heatmap of wheat biomass distribution by nitrogen dose (N1: 120 kg/ha, N2: 60 kg/ha, N3: 0 kg/ha) and seed rate (S1: 500 seeds/m2, S2: 400 seeds/m2, S3: 300 seeds/m2).
Figure 5
Figure 5
Boxplot of wheat biomass distribution by nitrogen application levels (N1: 120 kg/ha, N2: 60 kg/ha, N3: 0 kg/ha) at the mean seed rate (S2: 400 seeds/m2). The black diamond symbol indicates outliers. Significance levels were determined by one-way ANOVA and subsequent Tukey test. Different letters indicate significant differences among the nitrogen application levels.
Figure 6
Figure 6
Boxplot of wheat biomass distribution by seed rate levels (S1: 500 seeds/m2, S2: 400 seeds/m2, S3: 300 seeds/m2) at a mean nitrogen application (N2: 60 kg/ha). Significance levels were determined by one-way ANOVA and subsequent Tukey test. Different letters indicate significant differences among the nitrogen application levels.
Figure 7
Figure 7
Heatmap of mean protein content in wheat by nitrogen dose (N1: 120 kg/ha, N2: 60 kg/ha, N3: 0 kg/ha) and seed rate (S1: 500 seeds/m2, S2: 400 seeds/m2, S3: 300 seeds/m2).
Figure 8
Figure 8
Variation of protein content in wheat as influenced by different nitrogen dose levels (N1: 120 kg/ha, N2: 60 kg/ha, N3: 0 kg/ha) at the mean seed rate (S2: 400 seeds/m2). The black diamond symbol indicates outliers. Significance levels were determined by one-way ANOVA and subsequent Tukey test. Different letters indicate significant differences among the nitrogen application levels.
Figure 9
Figure 9
Protein content variability in wheat by seed rate levels (S1: 500 seeds/m2, S2: 400 seeds/m2, S3: 300 seeds/m2) at a mean nitrogen application (N2: 60 kg/ha). Significance levels were determined by one-way ANOVA and subsequent Tukey test. Different letters indicate significant differences among the nitrogen application levels.
Figure 10
Figure 10
Heatmap of mean Normalized Difference Vegetation Index (NDVI1) by nitrogen dose (N1: 120 kg/ha, N2: 60 kg/ha, N3: 0 kg/ha) and seed rate (S1: 500 seeds/m2, S2: 400 seeds/m2, S3: 300 seeds/m2).
Figure 11
Figure 11
Distribution of Normalized Difference Vegetation Index (NDVI1) values by nitrogen dose levels (N1: 120 kg/ha, N2: 60 kg/ha, N3: 0 kg/ha) at the mean seed rate (S2: 400 seeds/m2). The black diamond symbol indicates outliers. Significance levels were determined by one-way ANOVA and subsequent Tukey test. Different letters indicate significant differences among the nitrogen application levels.
Figure 12
Figure 12
Heatmap of mean Normalized Difference Vegetation Index (NDVI2) by nitrogen dose (N1: 120 kg/ha, N2: 60 kg/ha, N3: 0 kg/ha) and seed rate (S1: 500 seeds/m2, S2: 400 seeds/m2, S3: 300 seeds/m2).
Figure 13
Figure 13
Distribution of Normalized Difference Vegetation Index (NDVI2) values by nitrogen dose levels (N1: 120 kg/ha, N2: 60 kg/ha, N3: 0 kg/ha) at the mean seed rate (S2: 400 seeds/m2). Significance levels were determined by one-way ANOVA and subsequent Tukey test. Different letters indicate significant differences among the nitrogen application levels.
Figure 14
Figure 14
Heatmap of mean Normalized Difference Vegetation Index (NDVI3) by nitrogen dose (N1: 120 kg/ha, N2: 60 kg/ha, N3: 0 kg/ha) and seed rate (S1: 500 seeds/m2, S2: 400 seeds/m2, S3: 300 seeds/m2).
Figure 15
Figure 15
Pearson’s correlation matrix for wheat yield, biomass, Normalized Difference Vegetation Index (NDVI), and protein content.
Figure 16
Figure 16
Heatmap of mean SPAD1 values by nitrogen dose (N1: 120 kg/ha, N2: 60 kg/ha, N3: 0 kg/ha) and seed rate (S1: 500 seeds/m2, S2: 400 seeds/m2, S3: 300 seeds/m2).
Figure 17
Figure 17
Distribution of SPAD1 values by nitrogen dose levels (N1: 120 kg/ha, N2: 60 kg/ha, N3: 0 kg/ha) at the mean seed rate (S2: 400 seeds/m2). Significance levels were determined by one-way ANOVA and subsequent Tukey test. Different letters indicate significant differences among the nitrogen application levels.
Figure 18
Figure 18
Heatmap of mean SPAD2 values by nitrogen dose (N1: 120 kg/ha, N2: 60 kg/ha, N3: 0 kg/ha) and seed rate (S1: 500 seeds/m2, S2: 400 seeds/m2, S3: 300 seeds/m2).
Figure 19
Figure 19
Heatmap of mean SPAD3 values by nitrogen dose (N1: 120 kg/ha, N2: 60 kg/ha, N3: 0 kg/ha) and seed rate (S1: 500 seeds/m2, S2: 400 seeds/m2, S3: 300 seeds/m2).
Figure 20
Figure 20
(a) Trends of NDVI values across key growth stages under different nitrogen doses (N1: 120 kg/ha, N2: 60 kg/ha, N3: 0 kg/ha). (b) Trends of SPAD values across key growth stages under different nitrogen doses (N1: 120 kg/ha, N2: 60 kg/ha, N3: 0 kg/ha).
Figure 21
Figure 21
Heatmap of mean canopy temperature (CT1) by nitrogen dose (N1: 120 kg/ha, N2: 60 kg/ha, N3: 0 kg/ha) and seed rate (S1: 500 seeds/m2, S2: 400 seeds/m2, S3: 300 seeds/m2).

References

    1. Kizilgeci F., Yildirim M., Islam M.S., Ratnasekera D., Iqbal M.A., Sabagh A.E. Normalized difference vegetation index and chlorophyll content for precision nitrogen management in durum wheat cultivars under semi-arid conditions. Sustainability. 2021;13:3725. doi: 10.3390/su13073725. - DOI
    1. Yin Q., Zhang Y., Li W., Wang J., Wang W., Ahmad I., Zhou G., Huo Z. Better inversion of wheat canopy SPAD values before heading stage using spectral and texture indices based on UAV multispectral imagery. Remote Sens. 2023;15:4935. doi: 10.3390/rs15204935. - DOI
    1. Cavalaris C., Megoudi S., Maxouri M., Anatolitis K., Sifakis M., Levizou E., Kyparissis A. Modeling of durum wheat yield based on sentinel-2 imagery. Agronomy. 2021;11:1486. doi: 10.3390/agronomy11081486. - DOI
    1. Pampana S., Mariotti M. Durum wheat yield and N uptake as affected by N source, timing, and rate in two mediterranean environments. Agronomy. 2021;11:1299. doi: 10.3390/agronomy11071299. - DOI
    1. Tedone L., Ali S.A., Verdini L., De Mastro G. Nitrogen management strategy for optimizing agronomic and environmental performance of rainfed durum wheat under Mediterranean climate. J. Clean. Prod. 2018;172:2058–2074. doi: 10.1016/j.jclepro.2017.11.215. - DOI