

Influence of Varied Environment Conditions on the Gut Microbiota of Yaks
- PMID: 38891617
- PMCID: PMC11171014
- DOI: 10.3390/ani14111570
Influence of Varied Environment Conditions on the Gut Microbiota of Yaks
Abstract
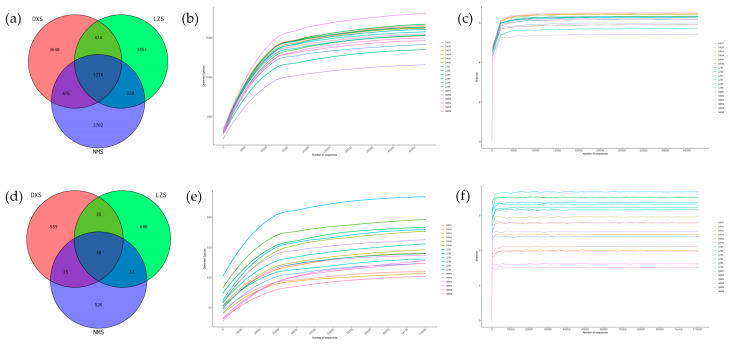
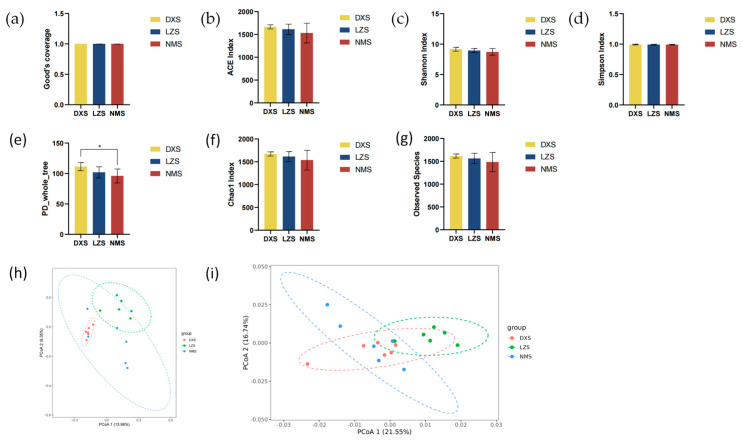
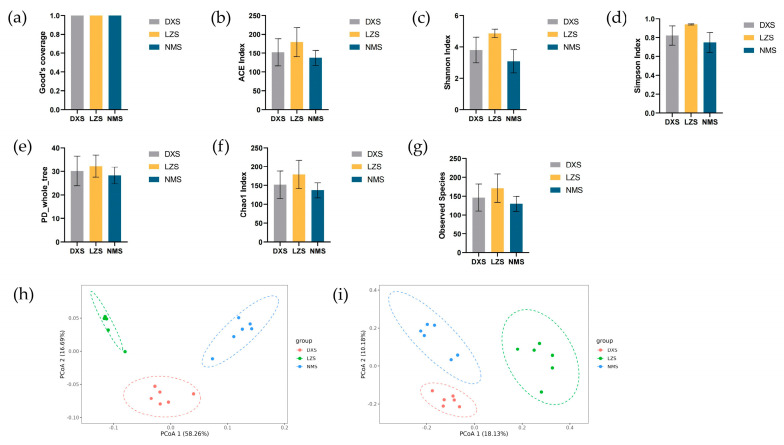
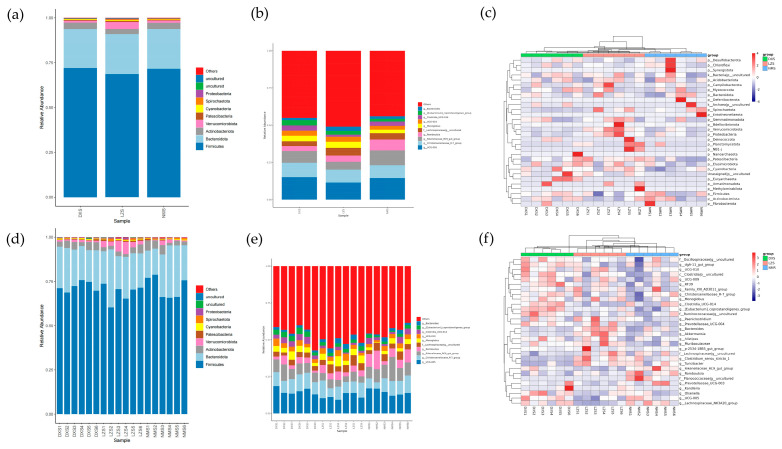
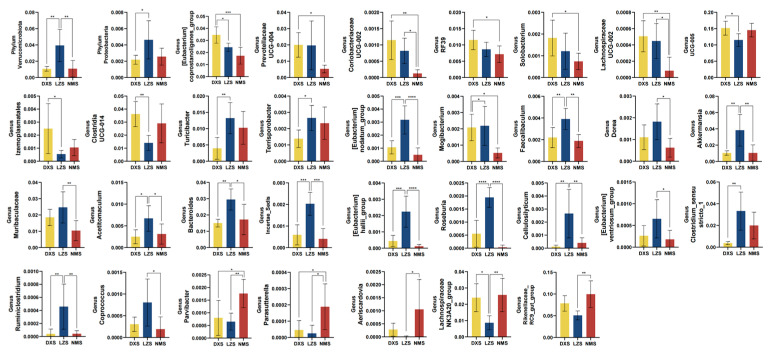
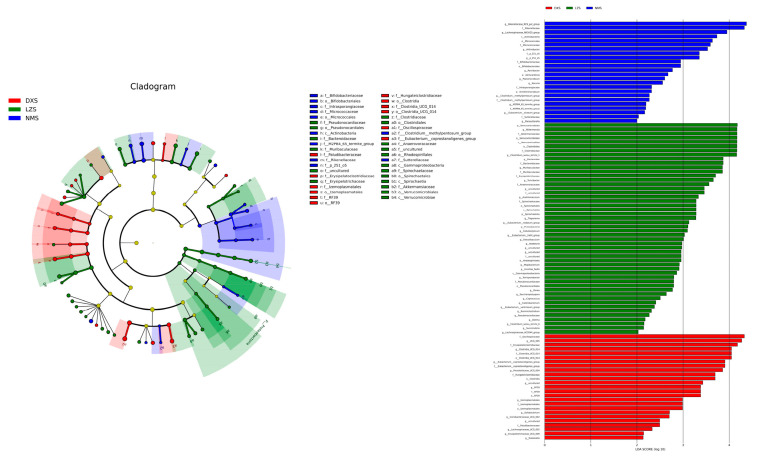
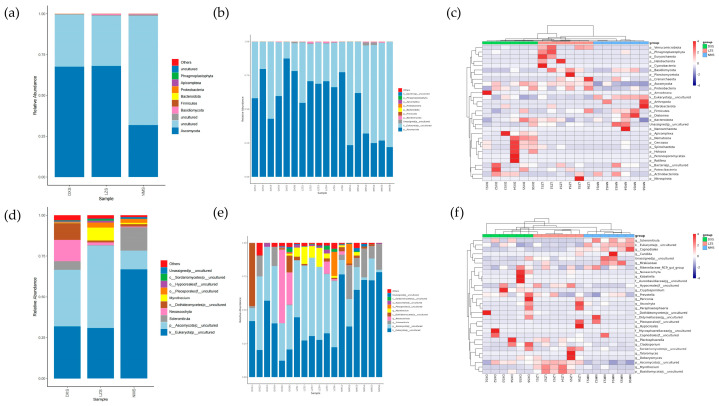
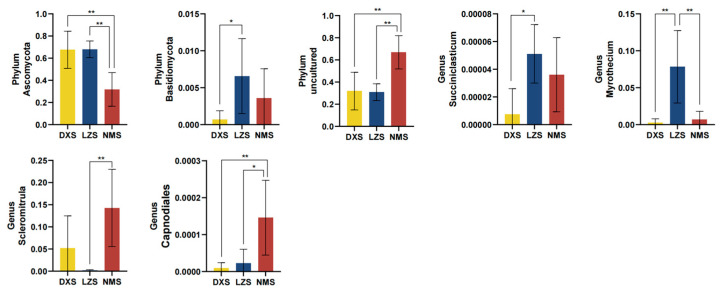
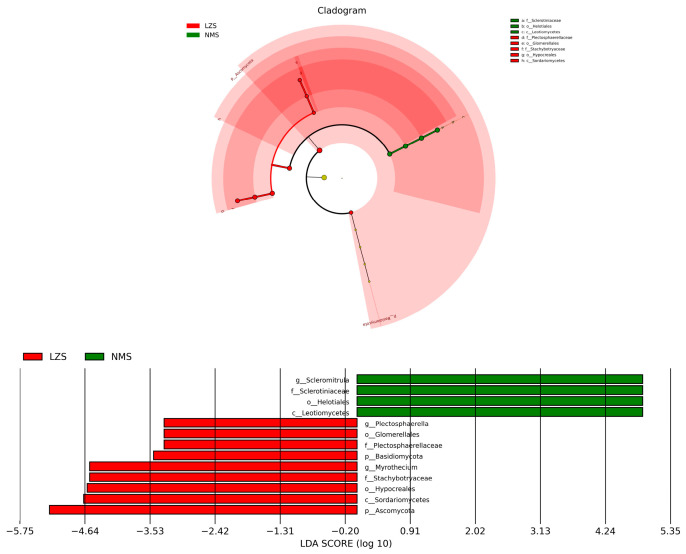
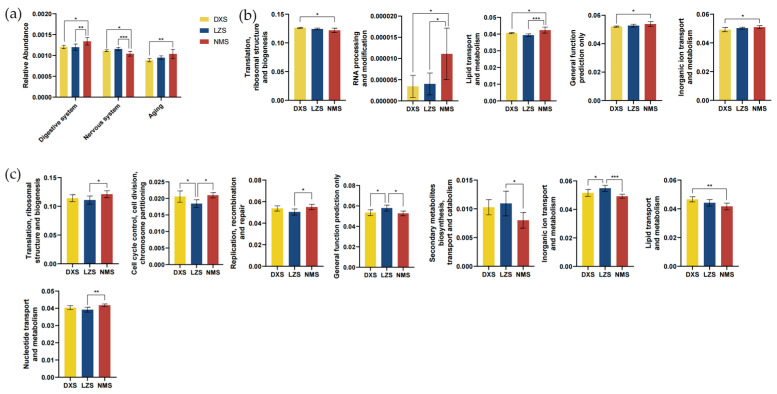
Despite the crucial role of the gut microbiota in different physiological processes occurring in the animal body, reports regarding the gut microbiota of animals residing in different environmental conditions like high altitude and different climate settings are limited. The Qinghai-Tibetan Plateau is renowned for its extreme climatic conditions that provide an ideal environment for exploring the effects of high altitude and temperature on the microbiota of animals. Yaks have unique oxygen delivery systems and genes related to hypoxic response. Damxung, Nyêmo, and Linzhou counties in Tibet have variable altitudes and temperatures that offer distinct settings for studying yak adaptation to elevated terrains. The results of our study suggest that amplicon sequencing of V3-V4 and internal transcribed spacer 2 (ITS2) regions yielded 13,683 bacterial and 1912 fungal amplicon sequence variants (ASVs). Alpha and beta diversity indicated distinct microbial structures. Dominant bacterial phyla were Firmicutes, Bacteroidota, and Actinobacteriota. Genera UCG-005, Christensenellaceae_R-7_group, and Rikenellaceae_RC9_gut_group were dominant in confined yaks living in Damxung county (DXS) and yaks living in Linzhou county (LZS), whereas UCG-005 prevailed in confined yaks living in Nyêmo county (NMS). The linear discriminant analysis effect size (LEfSe) analysis highlighted genus-level differences. Meta-stat analysis revealed significant shifts in bacterial and fungal community composition in yaks at different high altitudes and temperatures. Bacterial taxonomic analysis revealed that two phyla and 32 genera differed significantly (p < 0.05). Fungal taxonomic analysis revealed that three phyla and four genera differed significantly (p < 0.05). Functional predictions indicated altered metabolic functions, especially in the digestive system of yaks living in NMS. This study reveals significant shifts in yak gut microbiota in response to varying environmental factors, such as altitude and temperature, shedding light on previously unexplored aspects of yak physiology in extreme environments.
Keywords: gut microbiota; high altitude; metabolism; temperature; yak.
Conflict of interest statement
The authors declare no conflicts of interest.
Figures
Similar articles
-
Gut Microbial Adaptation to Varied Altitudes and Temperatures in Tibetan Plateau Yaks.Microorganisms. 2024 Jul 1;12(7):1350. doi: 10.3390/microorganisms12071350. Microorganisms. 2024. PMID: 39065118 Free PMC article.
-
Comparative analysis of gut microbiota in free range and house fed yaks from Linzhou County.Sci Rep. 2025 Apr 24;15(1):14317. doi: 10.1038/s41598-025-95357-4. Sci Rep. 2025. PMID: 40274860 Free PMC article.
-
Comparison of Rumen Fermentation Parameters and Microbiota of Yaks From Different Altitude Regions in Tibet, China.Front Microbiol. 2022 Feb 10;12:807512. doi: 10.3389/fmicb.2021.807512. eCollection 2021. Front Microbiol. 2022. PMID: 35222306 Free PMC article.
-
Yaks Are Dependent on Gut Microbiota for Survival in the Environment of the Qinghai Tibet Plateau.Microorganisms. 2024 May 31;12(6):1122. doi: 10.3390/microorganisms12061122. Microorganisms. 2024. PMID: 38930503 Free PMC article. Review.
-
Yak Gut Microbiota: A Systematic Review and Meta-Analysis.Front Vet Sci. 2022 Jun 28;9:889594. doi: 10.3389/fvets.2022.889594. eCollection 2022. Front Vet Sci. 2022. PMID: 35836500 Free PMC article.
Cited by
-
Gut Microbial Adaptation to Varied Altitudes and Temperatures in Tibetan Plateau Yaks.Microorganisms. 2024 Jul 1;12(7):1350. doi: 10.3390/microorganisms12071350. Microorganisms. 2024. PMID: 39065118 Free PMC article.
-
Ecological and Functional Changes in the Hindgut Microbiome of Holstein Cows at High Altitudes.Animals (Basel). 2025 Jan 15;15(2):218. doi: 10.3390/ani15020218. Animals (Basel). 2025. PMID: 39858218 Free PMC article.
References
Grants and funding
LinkOut - more resources
Full Text Sources
