. 2024 May 22;25(11):5618.
doi: 10.3390/ijms25115618.

Combination of FOLFOXIRI Drugs with Oncolytic Coxsackie B3 Virus PD-H Synergistically Induces Oncolysis in the Refractory Colorectal Cancer Cell Line Colo320

Affiliations

Combination of FOLFOXIRI Drugs with Oncolytic Coxsackie B3 Virus PD-H Synergistically Induces Oncolysis in the Refractory Colorectal Cancer Cell Line Colo320

Maxim Girod et al. Int J Mol Sci. .

Abstract

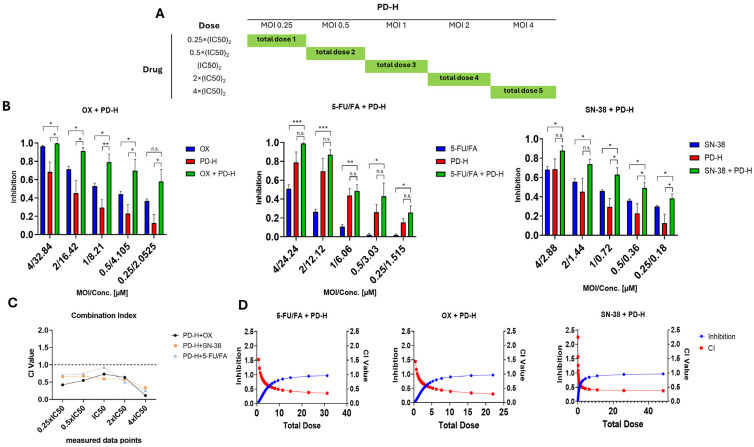
FOLFOXIRI chemotherapy is a first-line therapy for advanced or metastatic colorectal cancer (CRC), yet its therapeutic efficacy remains limited. Immunostimulatory therapies like oncolytic viruses can complement chemotherapies by fostering the infiltration of the tumor by immune cells and enhancing drug cytotoxicity. In this study, we explored the effect of combining the FOLFOXIRI chemotherapeutic agents with the oncolytic coxsackievirus B3 (CVB3) PD-H in the CRC cell line Colo320. Additionally, we examined the impact of the drugs on the expression of microRNAs (miRs), which could be used to increase the safety of oncolytic CVB3 containing corresponding miR target sites (miR-TS). The measurement of cytotoxic activity using the Chou-Talalay combination index approach revealed that PD-H synergistically enhanced the cytotoxic activity of oxaliplatin (OX), 5-fluorouracil (5-FU) and SN-38. PD-H replication was not affected by OX and SN-38 but inhibited by high concentrations of 5-FU. MiR expression levels were not or only slightly elevated by the drugs or with drug/PD-H combinations on Colo320 cells. Moreover, the drug treatment did not increase the mutation rate of the miR-TS inserted into the PD-H genome. The results demonstrate that the combination of FOLFOXIRI drugs and PD-H may be a promising approach to enhance the therapeutic effect of FOLFOXIRI therapy in CRC.

Keywords: chemotherapy; colorectal cancer; combination therapy; coxsackievirus; oncolytic virus.


Conflict of interest statement

The authors declare no conflicts of interest.

Figures

Figure 1
Figure 1
PD-H-induced cell lysis on different CRC cell lines. The CRC cell lines were infected with indicated MOIs of PD-H. Cell viability was measured by an XTT assay 48 and 72 h post infection and set relative to not-infected cells (Mock). Shown are the mean values ± SEM.
Figure 2
Figure 2
Colo320 dose–effect relation of FOLFOXIRI drugs and PD-H. (A) Cell viability of Colo320 cells after treatment with FOLFOXIRI drugs. Colo320 cells were treated with various drugs from the FOLFOXIRI regimen in a concentration range of 1 to 100 μM for OX, 5-FU, FA and 5-FU/FA mixture and in a concentration range of 0.1 to 100 µM for SN-38. The cell survival was measured with XTT assay 72 h after drug application. Shown are the mean values ± SEM from 3 independent experiments. Significance, * p < 0.05, ** p < 0.01, *** p < 0.001 compared to Mock or 5-FU vs. 5-FU/FA. Mock, untreated cells. The structural formulars for each drug have been drawn using the Thermo Scientific chemical structure search tool. (B) IC25 and IC50 values of FOLFOXIRI drugs and cell toxicity of the drugs at IC50. Left table, IC25 and IC50 values were calculated from measurements shown under (A) for each drug. Right images, Brightfield microscopy images of Colo320 cells were treated with the IC50 values of each drug 72 h after application. (C) Susceptibility of Colo320 cells to PD-H. Left diagram, Colo320 cells were treated with PD-H with an MOI of 0.1 to 10. Cell viability was measured with XTT assay 72 h later. Right image, Colo320 cells were treated with 1 MOI PD-H. The image was taken 72 h after infection.
Figure 3
Figure 3
Cell growth inhibition upon combination of OX, SN-38 and 5-FU/FA with PD-H. (A) Application scheme. Shown is the diagonal constant ratio scheme and the resulting data points used for measurement. (B) Cell growth inhibition. Colo320 cells were infected with PD-H for 1 h and treated thereafter with FOLFOXIRI drugs or the cells treated with PD-H or FOLFOXIRI drugs alone. Cell viability was measured by XTT assay 72 h after treatment. Inhibition is shown as 1-% of viable cells. Shown are the mean values ± SEM from 3 independent experiments. Significances, * p < 0.05, ** p < 0.01, *** p < 0.001. n.s., not significant. (C) Combination Index. The CI value for each measured data point is shown for each combination. CI values below the threshold of 1 indicate a synergic interaction, whereas values of 1 indicate additive effects, and values above 1 indicate inhibitory effects. (D) Simulated dose–effect curves. Dose–effect curves with the corresponding CI values were generated by the CompuSyn software (version 1.0) based on the measured data points from (B). The total dose is defined as the sum of the viral MOI and the drugs’ μM concentrations. An inhibition of 1 therefore corresponds to 100% cell death, and an inhibition of 0.5 corresponds to 50% cell death.
Figure 4
Figure 4
Influence of chemotherapeutics on replication of PD-H. (A) Cell viability in the FOLFOXIRI/PD-H combination approach. Colo320 cells were infected with PD-H at an MOI of 1 or were infected with PD-H for 1 h and thereafter incubated with the IC50 of the FOLFOXIRI drugs. Cell viability was measured by the XTT assay 12 h later. Significances, * p < 0.05, ** p < 0.01 vs. PD-H. Mock, untreated cells. (B) Viral replication curve for combinations of FOLFOXIRI drugs with PD-H or with PD-H alone. Colo320 cells were infected as described with FOLFOXIRI drugs and PD-H under (A). Viral titers were determined by plaque assay 0, 4, 8 and 12 h post infection. (C) The slopes (m) of the mean rates of change between the primary uptake and the final titers 8 h post-infection are displayed.
Figure 5
Figure 5
Relative expression level of tissue-specific-expressed miR-1, miR-122, miR-124, miR-375 and tumor-suppressor miR-143 and miR-145 in Colo320 cells after treatment with FOLFOXIRI drugs and PD-H-375TS. (A) MiR expression in Colo320 cells after application FOLFOXIRI drugs. Colo320 cells were incubated with the IC25 or IC50 of the FOLFOXIRI drugs. MiR expression was determined by qRT-PCR and normalized against the expression levels measured for endogenous U6 snRNA. MiR expression values are shown relative to the expression of the miR-143 in mouse heart (set as 1). The data represent means ± SEM of 3 independent experiments, each in triplicate. n.d., not detected; aU, arbitrary units; significance, * p < 0.05, ** p < 0.01. (B) MiR expression in Colo320 cells after combining FOLFOXIRI drugs with PD-H-375TS. Colo320 cells were infected with PD-H-375TS at an MOI of 1 for 1 h and treated with the IC50 of FOLFOXIRI drugs, or the cells were treated with PD-H-375TS at an MOI of 1 alone. MiR expression was determined by qRT-PCR, as described under (A), 48 h after viral infection. The data represent means ± SEM of 3 independent experiments, each in triplicate. n.d., not detected; aU, arbitrary units; significance, * p < 0.05. (C) Sequence alignment of the miR-375TS. Colo320 cells were treated with FOLFOXIRI drugs and PD-H-375TS or PD-H-375 alone, as described under (B). Viral RNA was isolated 48 h after infection, and the miR-375TS was cloned and sequenced.

Similar articles

Cited by

References

    1. Hossain M.S., Karuniawati H., Jairoun A.A., Urbi Z., Ooi D.J., John A., Lim Y.C., Kibria K.M.K., Mohiuddin A.K.M., Ming L.C., et al. Colorectal Cancer: A Review of Carcinogenesis, Global Epidemiology, Current Challenges, Risk Factors, Preventive and Treatment Strategies. Cancers. 2022;14:1732. doi: 10.3390/cancers14071732. - DOI - PMC - PubMed
    1. Krepelkova I. Colorectal Cancer—More People Screened, More Lives Saved. [(accessed on 29 July 2019)]. Available online: https://www.biovendor.com/colorectal-cancer--more-people-screened-more-l....
    1. Edwards B.K., Ward E., Kohler B.A., Eheman C., Zauber A.G., Anderson R.N., Jemal A., Schymura M.J., Lansdorp-Vogelaar I., Seeff L.C., et al. Annual report to the nation on the status of cancer, 1975–2006, featuring colorectal cancer trends and impact of interventions (risk factors, screening, and treatment) to reduce future rates. Cancer. 2010;116:544–573. doi: 10.1002/cncr.24760. - DOI - PMC - PubMed
    1. Xi Y., Xu P. Global colorectal cancer burden in 2020 and projections to 2040. Transl. Oncol. 2021;14:101174. doi: 10.1016/j.tranon.2021.101174. - DOI - PMC - PubMed
    1. Falcone A., Masi G., Allegrini G., Danesi R., Pfanner E., Brunetti I.M., Di Paolo A., Cupini S., Del Tacca M., Conte P. Biweekly chemotherapy with oxaliplatin, irinotecan, infusional Fluorouracil, and leucovorin: A pilot study in patients with metastatic colorectal cancer. J. Clin. Oncol. 2002;20:4006–4014. doi: 10.1200/JCO.2002.12.075. - DOI - PubMed

MeSH terms