Comparative Study
. 2024 May 23;25(11):5668.
doi: 10.3390/ijms25115668.

How Much Do You Fuse? A Comparison of Cell Fusion Assays in a Breast Cancer Model

Affiliations
Comparative Study

How Much Do You Fuse? A Comparison of Cell Fusion Assays in a Breast Cancer Model

Mareike Sieler et al. Int J Mol Sci. .

Abstract

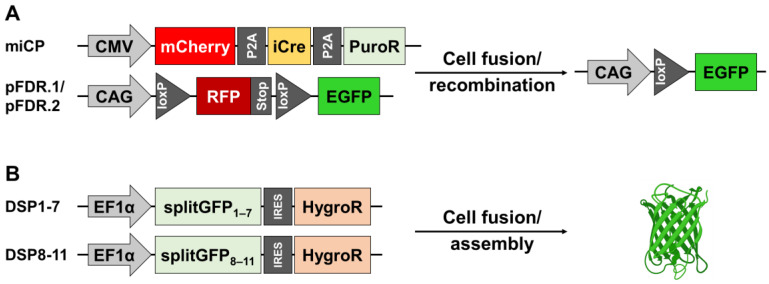
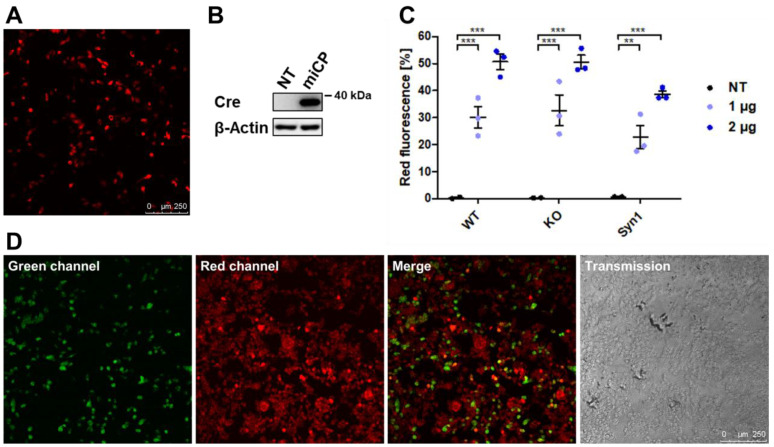
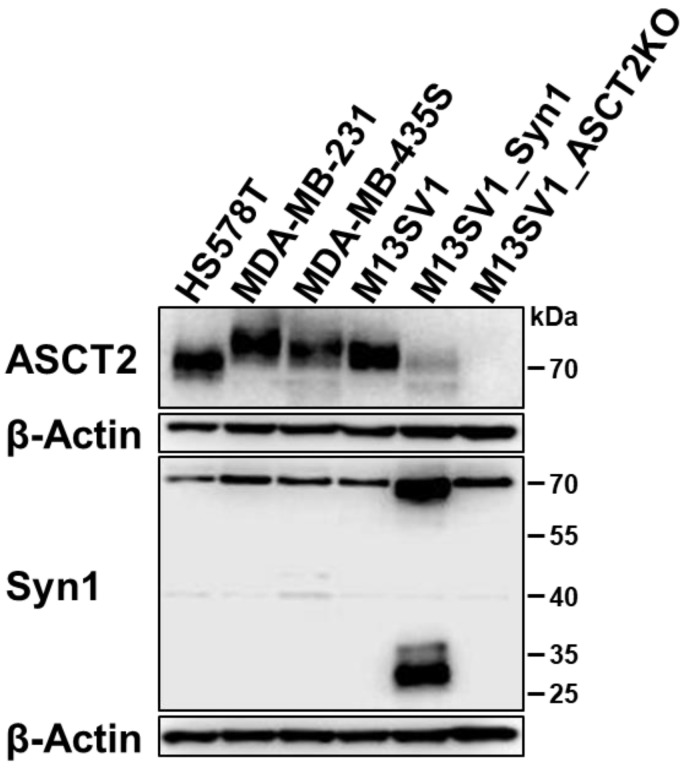
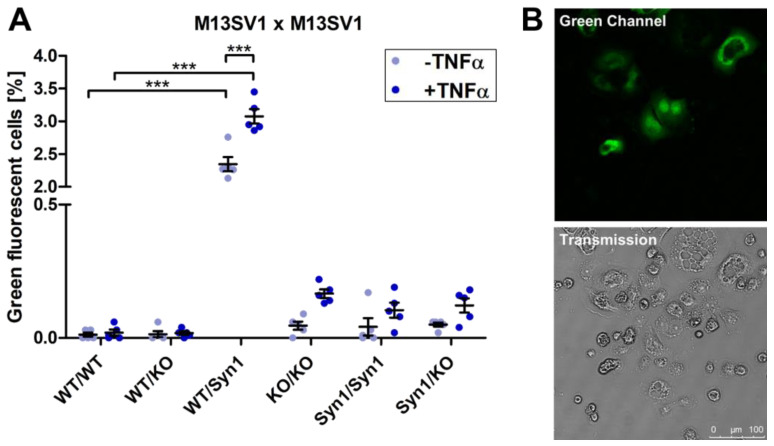
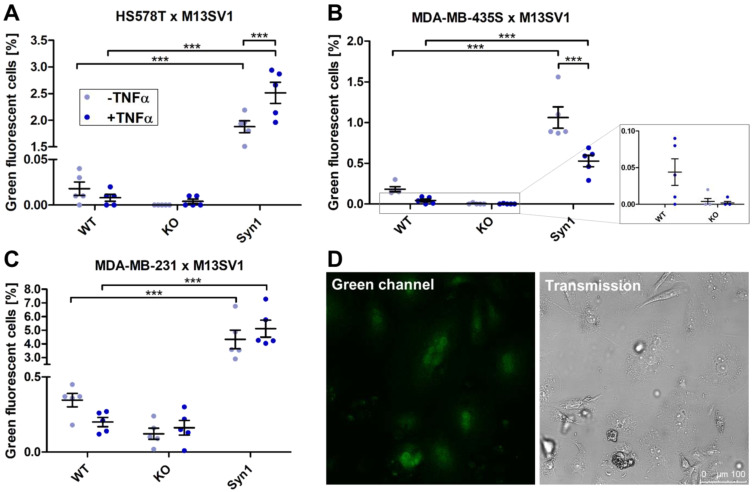
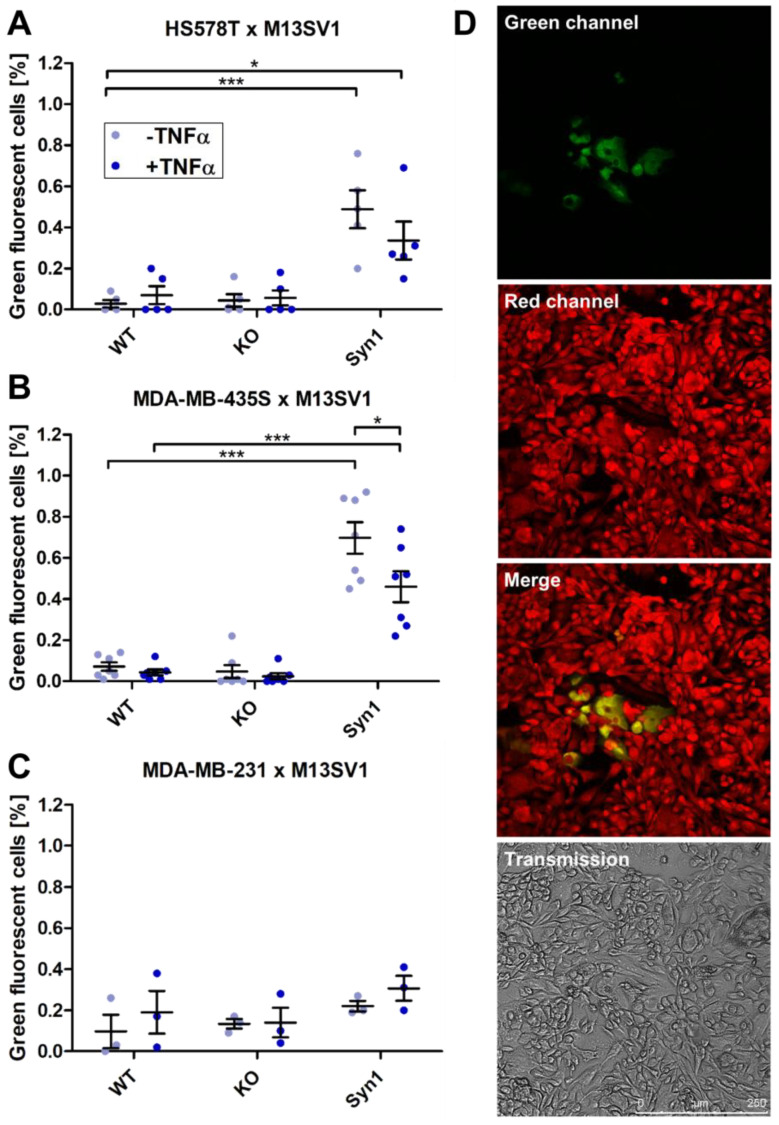
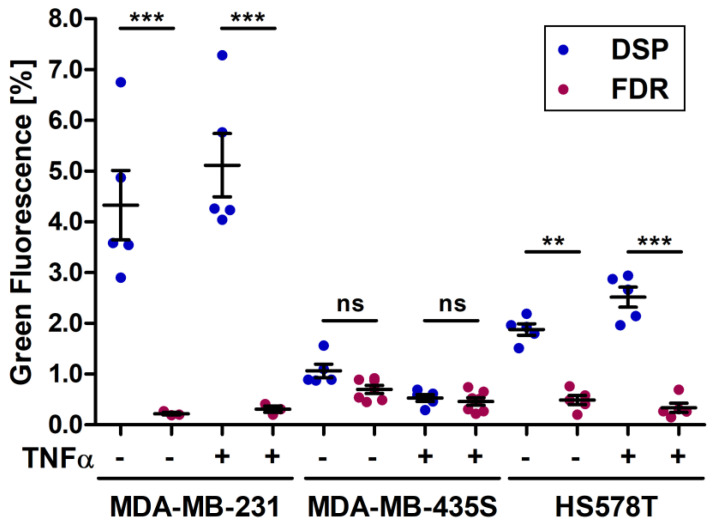
Cell fusion is a biological process that is crucial for the development and homeostasis of different tissues, but it is also pathophysiologically associated with tumor progression and malignancy. The investigation of cell fusion processes is difficult because there is no standardized marker. Many studies therefore use different systems to observe and quantify cell fusion in vitro and in vivo. The comparability of the results must be critically questioned, because both the experimental procedure and the assays differ between studies. The comparability of the fluorescence-based fluorescence double reporter (FDR) and dual split protein (DSP) assay was investigated as part of this study, in which general conditions were kept largely constant. In order to be able to induce both a high and a low cell fusion rate, M13SV1 breast epithelial cells were modified with regard to the expression level of the fusogenic protein Syncytin-1 and its receptor ASCT2 and were co-cultivated for 72 h with different breast cancer cell lines. A high number of fused cells was found in co-cultures with Syncytin-1-overexpressing M13SV1 cells, but differences between the assays were also observed. This shows that the quantification of cell fusion events in particular is highly dependent on the assay selected, but the influence of fusogenic proteins can be visualized very well.

Keywords: ASCT2; Syncytin-1; breast cancer; cell fusion; dual split protein assay; fluorescence double reporter assay; fluorescence-based cell fusion assays; quantification of cell fusion.


Conflict of interest statement

The authors declare no conflicts of interest.

Figures

Figure 1
Figure 1
Functioning of the fluorescence double reporter (FDR) assay and the dual split protein (DSP) assay. (A) For the FDR assay, M13SV1 cell lines are transfected with an miCP vector, coding for a codon-optimized Cre recombinase (iCre), while the breast cancer cell lines stably express pFDR.1 or pFDR.2. The latter are recombined by iCre at the respective loxP sites during a cell fusion event, which leads to a change in fluorescence from red to green in the resulting hybrid cell. (B) For the DSP assay, the two cell lines to be fused each stably express a part of a split green fluorescent protein (GFP), which assemble to a functional GFP after cell fusion. Figure created with BioRender.
Figure 2
Figure 2
Characterization of the functionality of the miCP vector. (A) The confocal laser scanning microscopy picture shows the red fluorescence of the mCherry fluorescent protein in M13SV1 cells transfected with miCP. Bar = 250 µm. (B) Western blot data indicate the overexpression of iCre recombinase 48 h after transfection in M13SV1 cells. (C) Flow cytometry data show different percentages of red fluorescent cells in the different M13SV1 cell lines 48 h after transfection with 1 µg or 2 µg of miCP vector. It is noticeable that the transfection of more vector leads to more uniform results, but the M13SV1_Syn1 cells contain the fewest red fluorescent cells. The flow cytometry measurements were not performed at the emission optimum of mCherry, so the actual number of fluorescent cells could be higher. NT = non-transfected control. ** = p ≤ 0.01; *** = p ≤ 0.001. (D) Confocal laser scanning microscopy pictures of MDA-MB-435S_pFDR.1 cells transfected with miCP show green fluorescent cells 48 h after transfection and thus the functionality of the iCre and the loxP vector system. Bar = 250 µm.
Figure 3
Figure 3
Confocal laser scanning microscopy pictures of M13SV1 cells co-transfected with DSP1-7 and DSP8-11 vectors show the green fluorescence of the cells and thus the functionality of the vectors. Bar = 250 µm.
Figure 4
Figure 4
ASCT2 was successfully knocked-out in M13SV1 cells. (A) Western blot data of several passages (P) of the isolated single cell clone 5 bearing the stable ASCT2 KO. (B) Sequencing data indicate a nucleotide insertion (red) in M13SV1_ASCT2KO clone 5 cells.
Figure 5
Figure 5
Expression levels of ASCT2 and Syncytin-1 in M13SV1 cell lines and breast cancer cell lines used for cell fusion assays.
Figure 6
Figure 6
The measurement of cell fusion with the DSP assay in homotypic cocultures of M13SV1 cell lines. (A) M13SV1 cells with different expression levels of Syncytin-1 and ASCT2 were cocultured in a 1:1 ratio for 72 h with or without the addition of 100 ng/mL TNFα. The amount of green fluorescent cells was measured via flow cytometry. Shown are the means ± S.E.M. of five independent experiments. Statistical significance was calculated using a one-way ANOVA and Bonferroni’s multiple comparison test. *** = p ≤ 0.001. (B) Representative confocal laser scanning microscopy pictures show the green fluorescence of hybrid cells of the homotypic coculture of M13SV1_DSP1-7 wild-type cells and M13SV1_Syn1_DSP8-11 cells. The cells were cocultured in a 1:1 ratio on a chamber slide for 72 h and fixed for microscopy studies. Bar = 100 µm.
Figure 7
Figure 7
Measurement of cell fusion with the DSP assay in cocultures of M13SV1 cell lines expressing DSP8-11 with HS578T_DSP1-7, MDA-MB-435S_DSP1-7 and MDA-MB-231_DSP1-7 breast cancer cell lines. M13SV1_DSP8-11 cells with different expression levels of Syncytin-1 and ASCT2 were cocultured with (A) HS578T_DSP1-7 cells, (B) MDA-MB-435S_DSP1-7 cells or (C) MDA-MB-231_DSP1-7 cells in a 1:3 ratio for 72 h with or without the addition of 100 ng/mL TNFα. The amount of green fluorescent cells was measured by flow cytometry. Shown are the means ± S.E.M. of five independent experiments. Statistical significance was calculated using a one-way ANOVA and Bonferroni’s multiple comparison test. *** = p ≤ 0.001. (D) Representative confocal laser scanning microscopy pictures show the green fluorescence of hybrid cells of the coculture of M13SV1_Syn1_DSP8-11 cells with MDA-MB-231_DSP1-7 cells. The cells were cocultured in a 1:3 ratio on a chamber slide for 72 h and fixed for microscopy studies. Bar = 100 µm.
Figure 8
Figure 8
Measurement of cell fusion with the FDR assay in cocultures of M13SV1_miCP cell lines with breast cancer cell lines HS578T_pFDR.2, MDA-MB-435S_pFDR.1 and MDA-MB-231_pFDR.2. M13SV1_miCP cells with different expression levels of Syncytin-1 and ASCT2 were cocultured with (A) HS578T_pFDR.2 cells, (B) MDA-MB-435S_pFDR.1 cells or (C) MDA-MB-231_pFDR.2 cells in a 1:3 ratio for 72 h with or without the addition of 100 ng/mL TNFα. The amount of green fluorescent cells was measured by flow cytometry. Shown are the means ± S.E.M. of three to seven independent experiments. Statistical significance was calculated using a one-way ANOVA and Bonferroni’s multiple comparison test. * = p ≤ 0.05; *** = p ≤ 0.001. (D) Representative confocal laser scanning microscopy pictures show the green fluorescence of hybrid cells of the coculture of M13SV1_Syn1_miCP cells with MDA-MB-435S_pFDR.1 cells. The cells were cocultured in a 1:3 ratio on a chamber slide for 72 h and fixed for microscopy studies. Bar = 250 µm.
Figure 9
Figure 9
Comparison of the amount of hybrid cells detected in cocultures of M13SV1_Syn1 cells with the breast cancer cell lines MDA-MB-231, MDA-MB-435S and HS578T either in the DSP assay or in the FDR assay measured using green fluorescent cells. The cocultures were set up in a 1:3 ratio for 72 h with (+) or without (−) the addition of 100 ng/mL TNFα. The amount of green fluorescent cells was measured by flow cytometry. Shown are the means ± S.E.M. of three to seven independent experiments. Statistical significance was calculated using a one-way ANOVA and Bonferroni’s multiple comparison test. ns = not significant; ** = p ≤ 0.01; *** = p ≤ 0.001.

Similar articles

Cited by

References

    1. Aguilar P.S., Baylies M.K., Fleissner A., Helming L., Inoue N., Podbilewicz B., Wang H., Wong M. Genetic basis of cell-cell fusion mechanisms. Trends Genet. 2013;29:427–437. doi: 10.1016/j.tig.2013.01.011. - DOI - PMC - PubMed
    1. Dittmar T., Zänker K.S. In: Cell Fusion in Health and Disease; Volume I: Cell Fusion in Health. Dittmar T., Zänker K.S., editors. Springer; Dordrecht, The Netherlands: 2011.
    1. Zhou X., Platt J.L. Molecular and cellular mechanisms of mammalian cell fusion. Adv. Exp. Med. Biol. 2011;713:33–64. doi: 10.1007/978-94-007-0763-4_4. - DOI - PubMed
    1. Brukman N.G., Uygur B., Podbilewicz B., Chernomordik L.V. How cells fuse. J. Cell Biol. 2019;218:1436–1451. doi: 10.1083/jcb.201901017. - DOI - PMC - PubMed
    1. Blond J.L., Besème F., Duret L., Bouton O., Bedin F., Perron H., Mandrand B., Mallet F. Molecular characterization and placental expression of HERV-W, a new human endogenous retrovirus family. J. Virol. 1999;73:1175–1185. doi: 10.1128/jvi.73.2.1175-1185.1999. - DOI - PMC - PubMed

Publication types