. 2024 May 24;25(11):5731.
doi: 10.3390/ijms25115731.

Longitudinal Neuropathological Consequences of Extracranial Radiation Therapy in Mice

Affiliations

Longitudinal Neuropathological Consequences of Extracranial Radiation Therapy in Mice

Kimberly Demos-Davies et al. Int J Mol Sci. .

Abstract

Cancer-related cognitive impairment (CRCI) is a consequence of chemotherapy and extracranial radiation therapy (ECRT). Our prior work demonstrated gliosis in the brain following ECRT in SKH1 mice. The signals that induce gliosis were unclear. Right hindlimb skin from SKH1 mice was treated with 20 Gy or 30 Gy to induce subclinical or clinical dermatitis, respectively. Mice were euthanized at 6 h, 24 h, 5 days, 12 days, and 25 days post irradiation, and the brain, thoracic spinal cord, and skin were collected. The brains were harvested for spatial proteomics, immunohistochemistry, Nanostring nCounter® glial profiling, and neuroinflammation gene panels. The thoracic spinal cords were evaluated by immunohistochemistry. Radiation injury to the skin was evaluated by histology. The genes associated with neurotransmission, glial cell activation, innate immune signaling, cell signal transduction, and cancer were differentially expressed in the brains from mice treated with ECRT compared to the controls. Dose-dependent increases in neuroinflammatory-associated and neurodegenerative-disease-associated proteins were measured in the brains from ECRT-treated mice. Histologic changes in the ECRT-treated mice included acute dermatitis within the irradiated skin of the hindlimb and astrocyte activation within the thoracic spinal cord. Collectively, these findings highlight indirect neuronal transmission and glial cell activation in the pathogenesis of ECRT-related CRCI, providing possible signaling pathways for mitigation strategies.

Keywords: SKH1 mice; cancer treatment; cancer-related cognitive impairment CRCI; neuropathology; radiation-related cognitive impairment.


Conflict of interest statement

The authors declare no conflicts of interest.

Figures

Figure 1
Figure 1
Acute skin radiation toxicity in mice treated with hindlimb radiation. (A) Representative image of the irradiated right hindlimb from a mouse treated with 30 Gy. Focal erythema and mild dermatitis started on day 10 post treatment. (B) Representative image of severe, ulcerative dermatitis within the irradiated right hindlimb of a mouse treated with 30 Gy. Changes shown developed on day 12 post treatment.
Figure 2
Figure 2
Histologic evidence of radiation-induced dermatitis in the hindlimb skin of SKH-1 mice at various timepoints after irradiation. Control skin was obtained from unirradiated right hindlimb skin from age-matched SKH-1 mice at the following timepoints: 6 h (A), 24 h (D), 5 days (G), 12 days (J), and 25 days (M). Representative images from skin on the right hindlimb following 20 Gy at 6 h (B), 24 h (E), 5 days (H), 12 days (K), and 25 days (N) post radiation treatment. Representative images from skin on the right hindlimb following 30 Gy at 6 h (C), 24 h (F), 5 days (I), 12 days (L), and 25 days (O) post radiation treatment. Hyperpigmentation (arrow heads) and epidermal thickening (black line) was evident following 20 Gy at 12 days (K) and following 30 Gy at 12 days (L) and 25 days (O). Images shown at 200×. n = 4; Control = control mice group; 20 Gy RT = mice treated with 20 Gy to hindlimb; 30 Gy RT = mice treated with 30 Gy to hindlimb. H&E.
Figure 3
Figure 3
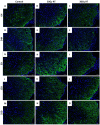
The expression of GFAP within the thoracic spinal cord after ECRT in mice. Representative images depict activated astrocytes (GFAP+ cells) in the thoracic spinal cord from control mice at 6 h (A), 24 h (D), 5 days (G), 12 days (J), and 25 days (M). Representative images depict activated astrocytes (GFAP+ cells) in the thoracic spinal cord from mice treated with 20 Gy at 6 h (B), 24 h (E), 5 days (H), 12 days (K), and 25 days (N) post radiation treatment. Representative images depict activated astrocytes (GFAP+ cells) in the thoracic spinal cord from mice treated with 30 Gy at 6 h (C), 24 h (F), 5 days (I), 12 days (L), and 25 days (O) post radiation treatment. Images shown are at 200×. Control = control mice group; 20 Gy RT = mice treated with 20 Gy to hindlimb; 30 Gy RT = mice treated with 30 Gy to hindlimb.
Figure 4
Figure 4
The expression changes in GFAP and Iba1 within the thoracic spinal cord after ECRT in mice. Line graph (A) depicting the percentage of astrocytes (GFAP+ cells) over time across treatment groups. Line graph (B) depicting the percentage of microglia (Iba1+ cells) over time across treatment groups. Data represent the mean and SEM (n = 4 mice from each group). * p-value < 0.05 compared to control group; # p-value < 0.05 compared to 20 Gy RT group; ~ p-value < 0.05 compared to 30 Gy RT group.
Figure 5
Figure 5
Glial cell activation in the striatum of ECRT-treated mice. Mice treated with 20 Gy demonstrated significant upregulation of CD11b (B), CD163 (C), CD40 (D), GPNMB (F), Ki-67 (G), MAP2 (H), and MHCII (J). Mice treated with 20 Gy demonstrated significant downregulation of S100B (L). Mice treated with 30 Gy demonstrated significant upregulation of Aldh1l1 (A), GFAP (E), MHCII (J), and Synaptophysin (M). Mice treated with 30 Gy demonstrated significant downregulation of Mertk (I), NeuN (K), and TMEM119 (N). Data represent the mean ± SEM and black dots represent individual values (n = 4–8 mice per group). Control = control mice that were euthanized at 6 h and 25 days. 20 Gy = mice treated with 20 Gy to hindlimb; 30 Gy = mice treated with 30 Gy to hindlimb. * p < 0.05; ** p < 0.01; *** p = 0.01–0.001; **** p < 0.001.
Figure 6
Figure 6
Glial cell activation in the retrosplenial cortex of ECRT-treated mice. Retrosplenial cortex from mice treated with 20 Gy demonstrated significant upregulation of CD11b (B), CD163 (C), CD39 (D), CD9 (E), GPNMB (G), Ki-67 (H), MAP2 (I), MHCII (J), and SPP1 (M). Mice treated with 30 Gy demonstrated significant upregulation of Aldh1l1 (A), GFAP (F), MAP2 (I), MHCII (J), S100B (L), SPP1 (M), and Synaptophysin (N). Mice treated with 30 Gy demonstrated significant downregulation of NeuN (K) and TMEM119 (O). Data represent the mean ± SEM and black dots represent individual values (n = 4–8 mice per group). Control = control mice that were euthanized at 6 h and 25 days. 20 Gy RT = mice treated with 20 Gy to hindlimb; 30 Gy RT = mice treated with 30 Gy to hindlimb. * p < 0.05; ** p < 0.01; *** p = 0.01–0.001; **** p < 0.001.
Figure 7
Figure 7
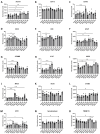
Glial cell activation in the hippocampus of ECRT-treated mice. Hippocampus from mice treated with 20 Gy demonstrated significant upregulation of CD39 (A), CSF1R (B), Ctsd (C), GPNMB (E), IBA1 (F), Ki-67 (G), MAP2 (H), Mertk (I), MHCII (J), MSR1 (K), neurofilament light chain (M), SPP1 (N), and TMEM119 (O). Mice treated with 20 Gy demonstrated significant downregulation of CSF1R (B), GFAP (D), and Vimentin (P). Hippocampus from mice treated with 30 Gy demonstrated significant upregulation of GFAP (D), GPNMB (E), MAP2 (H), and MHCII (J). Mice treated with 30 Gy demonstrated significant downregulation of NeuN (L). Data represent the mean ± SEM and black dots represent individual values (n = 4–8 mice per group). Control = control mice that were euthanized at 6 h and 25 days. 20 Gy RT = mice treated with 20 Gy radiation to hindlimb; 30 Gy RT = mice treated with 30 Gy radiation to hindlimb. * p < 0.05; ** p < 0.01; *** p = 0.01–0.001; **** p < 0.001.
Figure 7
Figure 7
Glial cell activation in the hippocampus of ECRT-treated mice. Hippocampus from mice treated with 20 Gy demonstrated significant upregulation of CD39 (A), CSF1R (B), Ctsd (C), GPNMB (E), IBA1 (F), Ki-67 (G), MAP2 (H), Mertk (I), MHCII (J), MSR1 (K), neurofilament light chain (M), SPP1 (N), and TMEM119 (O). Mice treated with 20 Gy demonstrated significant downregulation of CSF1R (B), GFAP (D), and Vimentin (P). Hippocampus from mice treated with 30 Gy demonstrated significant upregulation of GFAP (D), GPNMB (E), MAP2 (H), and MHCII (J). Mice treated with 30 Gy demonstrated significant downregulation of NeuN (L). Data represent the mean ± SEM and black dots represent individual values (n = 4–8 mice per group). Control = control mice that were euthanized at 6 h and 25 days. 20 Gy RT = mice treated with 20 Gy radiation to hindlimb; 30 Gy RT = mice treated with 30 Gy radiation to hindlimb. * p < 0.05; ** p < 0.01; *** p = 0.01–0.001; **** p < 0.001.
Figure 8
Figure 8
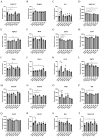
Extracranial radiation causes significant gene changes in the brain of mice. Mice treated with 20 Gy demonstrated significant upregulation of Amigo2 (B), Arc (C), Crem (I), Fcrls (K), Gabra5 (N), Gfap (O), Gpr34 (R), Hspb1 (U), Ifnar2 (W), Lamtor3 (X), Lsr (Y), Map2 (AA), Mertk (CC), Pdgfra (HH), Plekhb1 (KK), Ptpn1 (OO), Shank3 (QQ), Shc3 (RR), Slc8a1 (SS), and Traf3 (ZZ). Mice treated with 20 Gy demonstrated significant downregulation of Al464131 (A), Atp6v1c1 (D), Bub3 (G), Gls (P), Gnai1 (Q), Ifnar1 (V), Mal2 (Z), Map2 (AA), Opalin (FF), Ppp3r1 (MM), Slc9a6 (TT), Sybu (WW), Tomm20 (YY), Trim45 (AAA), and Usp2 (BBB). Mice treated with 30 Gy demonstrated significant upregulation of Atp8a2 (E), Crem (I), Emcn (J), Gabra4 (M), Hspa1a/b (T), Hspb1 (U), Lamtor3 (X), Map3k4 (BB), Mertk (CC), Nrcam (EE), Parp2 (GG), Pias1 (JJ), Rab7 (PP), Tanc2 (XX), and Traf3 (ZZ). Mice treated with 30 Gy demonstrated significant downregulation of Al464131 (A), Atp6v1c1 (D), Brd2 (F), Bub3 (G), Cd47 (H), Fgf13 (L), Gabra5 (N), Gls (P), Gsn (S), Ndufa10 (DD), Opalin (FF), Phyh (II), Ppp3cb (LL), Ppp3r1 (MM), Psma5 (NN), Slc9a6 (TT), Snap25 (UU), Stmn1 (VV), Tomm20 (YY), and Trim45 (AAA). Data represent the mean ± SEM and black dots represent individual values (n = 2–3 mice per group). Control = control mice that were euthanized at 24 h and 12 days. 20 Gy RT = mice treated with 20 Gy radiation to hindlimb; 30 Gy RT = mice treated with 30 Gy radiation to hindlimb. * p < 0.05; ** p < 0.01; *** p = 0.01–0.001. NanoString nCounter® glial profiling panel and neuroinflammation panel.
Figure 8
Figure 8
Extracranial radiation causes significant gene changes in the brain of mice. Mice treated with 20 Gy demonstrated significant upregulation of Amigo2 (B), Arc (C), Crem (I), Fcrls (K), Gabra5 (N), Gfap (O), Gpr34 (R), Hspb1 (U), Ifnar2 (W), Lamtor3 (X), Lsr (Y), Map2 (AA), Mertk (CC), Pdgfra (HH), Plekhb1 (KK), Ptpn1 (OO), Shank3 (QQ), Shc3 (RR), Slc8a1 (SS), and Traf3 (ZZ). Mice treated with 20 Gy demonstrated significant downregulation of Al464131 (A), Atp6v1c1 (D), Bub3 (G), Gls (P), Gnai1 (Q), Ifnar1 (V), Mal2 (Z), Map2 (AA), Opalin (FF), Ppp3r1 (MM), Slc9a6 (TT), Sybu (WW), Tomm20 (YY), Trim45 (AAA), and Usp2 (BBB). Mice treated with 30 Gy demonstrated significant upregulation of Atp8a2 (E), Crem (I), Emcn (J), Gabra4 (M), Hspa1a/b (T), Hspb1 (U), Lamtor3 (X), Map3k4 (BB), Mertk (CC), Nrcam (EE), Parp2 (GG), Pias1 (JJ), Rab7 (PP), Tanc2 (XX), and Traf3 (ZZ). Mice treated with 30 Gy demonstrated significant downregulation of Al464131 (A), Atp6v1c1 (D), Brd2 (F), Bub3 (G), Cd47 (H), Fgf13 (L), Gabra5 (N), Gls (P), Gsn (S), Ndufa10 (DD), Opalin (FF), Phyh (II), Ppp3cb (LL), Ppp3r1 (MM), Psma5 (NN), Slc9a6 (TT), Snap25 (UU), Stmn1 (VV), Tomm20 (YY), and Trim45 (AAA). Data represent the mean ± SEM and black dots represent individual values (n = 2–3 mice per group). Control = control mice that were euthanized at 24 h and 12 days. 20 Gy RT = mice treated with 20 Gy radiation to hindlimb; 30 Gy RT = mice treated with 30 Gy radiation to hindlimb. * p < 0.05; ** p < 0.01; *** p = 0.01–0.001. NanoString nCounter® glial profiling panel and neuroinflammation panel.

Similar articles

References

    1. Feiock C., Yagi M., Maidman A., Rendahl A., Hui S., Seelig D. Central Nervous System Injury—A Newly Observed Bystander Effect of Radiation. PLoS ONE. 2016;11:e0163233. doi: 10.1371/journal.pone.0163233. - DOI - PMC - PubMed
    1. Santos J.C., Pyter L.M. Neuroimmunology of Behavioral Comorbidities Associated With Cancer and Cancer Treatments. Front. Immunol. 2018;9:1195. doi: 10.3389/fimmu.2018.01195. - DOI - PMC - PubMed
    1. Demos-Davies K., Lawrence J., Rogich A., Lind E., Seelig D. Cancer treatment induces neuroinflammation and behavioral deficits in mice. Front. Behav. Neurosci. 2022;16:1067298. doi: 10.3389/fnbeh.2022.1067298. - DOI - PMC - PubMed
    1. Demos-Davies K., Lawrence J., Seelig D. Cancer related cognitive impairment: A downside of cancer treatment. Front. Oncol. 2024;14:1387251. doi: 10.3389/fonc.2024.1387251. - DOI - PMC - PubMed
    1. Janelsins M.C., Kohli S., Mohile S.G., Usuki K., Ahles T.A., Morrow G.R. An update on cancer- and chemotherapy-related cognitive dysfunction: Current status. Semin. Oncol. 2011;38:431–438. doi: 10.1053/j.seminoncol.2011.03.014. - DOI - PMC - PubMed

MeSH terms