. 2024 May 26;25(11):5792.
doi: 10.3390/ijms25115792.

Modulation of the p75NTR during Adolescent Alcohol Exposure Prevents Cholinergic Neuronal Atrophy and Associated Acetylcholine Activity and Behavioral Dysfunction

Affiliations

Modulation of the p75NTR during Adolescent Alcohol Exposure Prevents Cholinergic Neuronal Atrophy and Associated Acetylcholine Activity and Behavioral Dysfunction

Brian T Kipp et al. Int J Mol Sci. .

Abstract

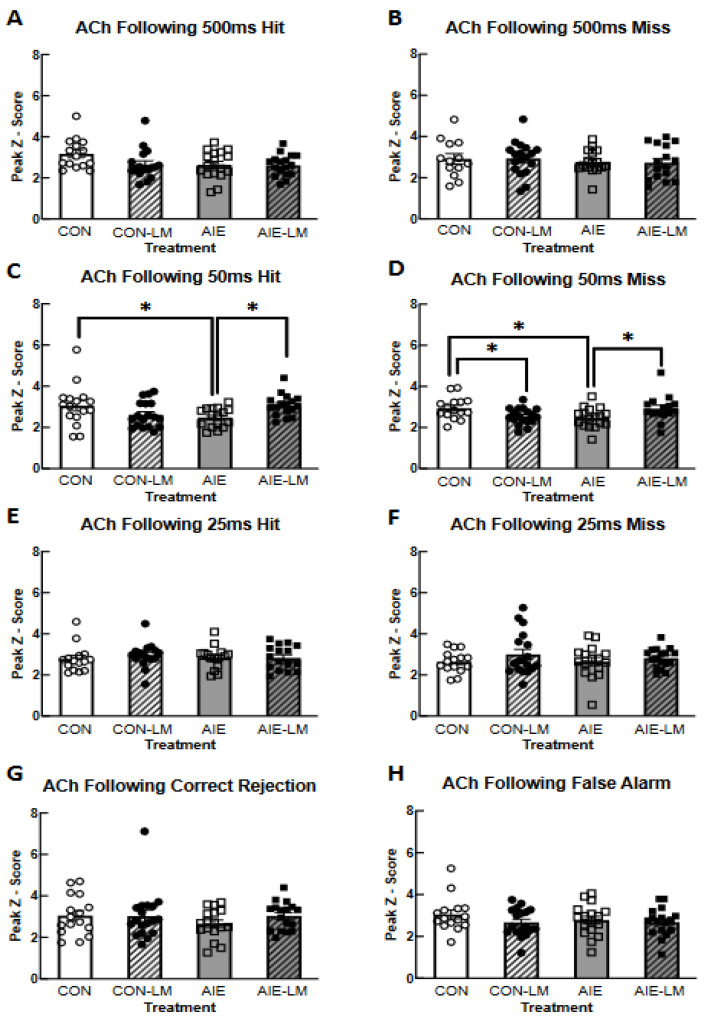
Binge alcohol consumption during adolescence can produce lasting deficits in learning and memory while also increasing the susceptibility to substance use disorders. The adolescent intermittent ethanol (AIE) rodent model mimics human adolescent binge drinking and has identified the nucleus basalis magnocellularis (NbM) as a key site of pathology. The NbM is a critical regulator of prefrontal cortical (PFC) cholinergic function and attention. The cholinergic phenotype is controlled pro/mature neurotrophin receptor activation. We sought to determine if p75NTR activity contributes to the loss of cholinergic phenotype in AIE by using a p75NTR modulator (LM11A-31) to inhibit prodegenerative signaling during ethanol exposure. Male and female rats underwent 5 g/kg ethanol (AIE) or water (CON) exposure following 2-day-on 2-day-off cycles from postnatal day 25-57. A subset of these groups also received a protective dose of LM11A-31 (50 mg/kg) during adolescence. Rats were trained on a sustained attention task (SAT) and behaviorally relevant acetylcholine (ACh) activity was recorded in the PFC with a fluorescent indicator (AChGRAB 3.0). AIE produced learning deficits on the SAT, which were spared with LM11A-31. In addition, PFC ACh activity was blunted by AIE, which LM11A-31 corrected. Investigation of NbM ChAT+ and TrkA+ neuronal expression found that AIE led to a reduction of ChAT+TrkA+ neurons, which again LM11A-31 protected. Taken together, these findings demonstrate the p75NTR activity during AIE treatment is a key regulator of cholinergic degeneration.

Keywords: acetylcholine; adolescence; alcohol; basal forebrain; frontal cortex; neurotrophin.


Conflict of interest statement

The authors declare not conflict of interest.

Figures

Figure 1
Figure 1
Growth curves and blood ethanol concentrations. Graphs depicting the change in body weight of male and female Sprague Dawley rats over the course of AIE or CON treatment with or without LM11A-31 administration. All subjects significantly increased weight gain over the course of treatment. In males, CON-V and CON-LM males gained more weight than AIE-V and AIE-LM males (A). Similarly, female weight gain over the course of treatment did not significantly differ across CON and AIE treatment conditions or with the administration of LM11A-31 (B). Blood ethanol concentration measured from tail bloods collected 1 h following the eighth gavage. Solid grey bars are AIE-V and hashed gray bars are AIE-LM. LM11A-31 treatment did not significantly alter BECs in CON- or AIE-treated animals during treatment in adolescence (C). Data represent group average ± SEM. **** Indicates p < 0.0001.
Figure 2
Figure 2
Performance during pretraining of the sustained attention task. SAT score and signal detection theory measures on the SAT task in the absence of the house light (pSAT). Data represent group mean ± SEM. AIE-V had lower SAT scores, which were recovered in AIE-LM males. However, LM11-31A treatment in CON male rats had the opposite effect; it impaired performance. AIE-V females performed worse than CON-V females on 500 ms trials, an effect not seen in rats that received LM11-31A (A). Under the 50 ms cue duration, AIE-V females performed significantly worse than CON-V and AIE-LM females; however, no group differences were found in male rats (B). At the 25 ms cue duration, only male AIE-V rats performed worse than their CON-V counterparts, an effect not seen in LM11-31A-treated rats (C). Measures of perceptual sensitivity in AIE-V-treated male and female rats were lower than male and female CON-V rats, which was not seen when LM11-31A was given (D). Regardless of sex, AIE-V- and CON-LM-treated rats had a more liberal response bias compared to CON-V and AIE-LM rats (E). Lastly, females overall took significantly more sessions to complete pSAT than males, regardless of treatment (F). * Indicates p < 0.05; ** indicates p < 0.01.
Figure 3
Figure 3
Performance on the sustained attention task. SAT performance and signal detection theory measures during the house light-on condition. Data represent group means ± SEM. In both male and female rats, no significant group differences were found in SAT scores across the 500 ms, 50 ms, and 25 ms cue durations (AC). Groups did not differ in signal detection theory measures of perceptual sensitivity or response bias, nor were there differences in the number of sessions required to complete the SAT task (DF).
Figure 4
Figure 4
Activity of GRAB ACh 3.0 during SAT and area under the curve (AUC) measures. Example of a plot of group-averaged Grab ACh 3.0 activity recorded via fiber photometry during signal (A,C,E,G) and non-signal trials (B,D,F,H) of SAT. Data represent Z-score transformation of signal relative to baseline recording during the previous intertrial interval. Area-under-the-curve measurements during cue presentation, response selection, and the post-reinforcement period during the SAT task (IN). Data represent- the AUC ± SEM. No group differences were observed during the cue presentation on hit and miss trials (I,J). However, CON-V rats had a greater AUC during the post-response period following hits compared to AIE-V- and CON-LM-treated animals. LM11-31A treatment prevented this deficit (K). No group differences were present in the AUC during misses (L). CON rats also had greater AUC compared to AIE rats in the post-response period following correct rejections (M) and false alarms (N), which were not corrected by LM11-31A treatment in AIE-treated rats. * Indicates p < 0.05; ** p < 0.01, *** p < 0.005.
Figure 5
Figure 5
Neural activity assessed by GRAB ACh 3.0 during cue presentation. Grab ACh 3.0 recording during cue presentation on the SAT task. Data represent mean peak Z-score ± SEM. No group differences were found in ACh 3.0 activity during cue presentation on correct 500 ms, 50 ms, or 25 ms cue duration trials (A,C,E). No group differences were found in peak z-score during cue presentation of 500 ms cue miss trials (B). However, during 50 ms cue presentation of miss trials, AIE-V-treated animals had a significantly lower peak z-score relative to CON-V- and AIE-LM-treated animals (D). No group differences were observed on the 25 ms cue trials that resulted in a miss (F). * Indicates p < 0.05; ** p < 0.01.
Figure 6
Figure 6
Activity of GRAB ACh 3.0 in the prefrontal cortex during hits, misses, correct rejections, and false alarms. Grab ACh 3.0 activity measured with fiber photometry during the post-response period of correct and incorrect trials (AF). Data represent the mean peak z-score ± SEM. While no group differences were evident following 500 ms cue trials (A,B), the peak z-score of ACh 3.0 activity was significantly lower in AIE-V-treated rats compared to CON-V and AIE-LM rats following hits and misses on 50 ms trials (C,D). Following a miss on the 50 ms cue trial, peak z-score of GRAB ACh 3.0 was lower in the CON-LM treatment condition compared to CON-V. Groups did not differ in peak z-score following 25 ms hits or misses (E,F). Groups also did not differ in peak z-score following correct rejections and false alarms of non-signal trials (G,H). * Indicates p < 0.05.
Figure 7
Figure 7
Activity of GRAB ACh 3.0 collapsed across cue duration. Average Grab ACh 3.0 activity in the mPFC during cue presentation and the post-response period across all cue durations. Data represent the group mean peak z-score ± SEM. During cue presentation on hit trials, AIE-V-treated animals had significantly lower peak z-score of ACh 3.0 activity compared to CON-V, CON-LM, and AIE-LM treatment conditions (A). During the post-response period of hit trials, CON-V-treated animals had higher peak z-score ACh 3.0 activity compared to CON-LM and AIE-V treatment groups (B). Group differences in peak z-score were not detected during cue presentation of miss trials (C) or during the post-response period of miss trials (D). * Indicates p < 0.05; ** p < 0.01; *** p < 0.005. Sample Grab ACh 3.0 viral expression and fiber optic cannula placement in the mPFC (2.70 AP, ±0.7 ML, −3.0 DV); image from Paxinos and Watson (2014) (E).
Figure 8
Figure 8
Cell counts for ChAT+, TrkA+ neurons in the NbM. The sum number of fluorescently labeled ChAT+ neurons in the NbM and the number of ChAT+TrkA+ and ChAT+TrkA- phenotypes. Data represent group means of the total number of counted cells across four sections ± SEM. Group differences were evident in the ChAT+TrkA+ phenotype of cholinergic neurons in the NbM. In males, AIE-V-treated rats had significantly fewer ChAT+TrkA+ labeled neurons than CON-V, CON-LM, and AIE-LM rats. In females, AIE-V-treated rats also had fewer ChAT+TrkA+ cells than CON-V, CON-LM, and AIE-LM females, while CON-LM-treated rats had fewer ChAT+TrkA+ cells than CON-V females (A). Group differences in ChAT+TrkA- cell counts in males were not evident; however, CON-LM females had fewer ChAT+TrkA- cells in the NbM compared to CON-V females (B). Sample images of NbM sections for ChAT+TrkA+ (Gold) and ChAT+TrkA- (Red) (C). ChAT-TrkA+ cells were not detected in these sections. All images were recorded at 20× magnification. * Indicates p < 0.05; ** p < 0.01; *** p < 0.005.
Figure 9
Figure 9
Experiment 2 treatment timeline. Groups underwent the previously described AIE or CON treatments. Separate AIE + LM11A-31 and CON + LM11A-31 treatment groups received IG gavage of 50 mg/kg LM11A-31, 30 min before and 8 h following each gavage. Animals were trained on SAT 2 weeks following the end of AIE treatment. Following mastery of SAT, subjects underwent ACh GRAB 3.0 viral infusion into the mPFC with fiber optic cannula 2 weeks after the end of AIE. Three weeks following viral infusion and SAT re-training, groups underwent operant pretraining and behavioral testing on the SAT, where mPFC ACh activity is recorded through in vivo fiber photometry.
Figure 10
Figure 10
Sustained attention task and SAT score. Depiction of the SAT pretraining, SAT tasks, and formula for the development of the SAT score. Animals underwent 162 trials per session, 81 of which were non-cue trials, while 27 cue trials were utilized with 500 ms, 50 ms, and 25 ms cue duration (total of 81 cue trials). Attention training (pSAT) occurred in the absence of the house light, but after mastery of the pSAT condition, the house light was introduced. The SAT score was calculated using the above formula consisting of hits at each cue duration and total false alarms.

Update of

Similar articles

Cited by

References

    1. Nunes P.T., Kipp B.T., Reitz N.L., Savage L.M. Aging with alcohol-related brain damage: Critical brain circuits associated with cognitive dysfunction. Int. Rev. Neurobiol. 2019;148:101–168. - PMC - PubMed
    1. Crews F.T., Robinson D.L., Chandler L.J., Ehlers C.L., Mulholland P.J., Pandey S.C., Rodd Z.A., Spear L.P., Swartzwelder H.S., Vetreno R.P. Mechanisms of Persistent Neurobiological Changes Following Adolescent Alcohol Exposure: NADIA Consortium Findings. Alcohol. Clin. Exp. Res. 2019;43:1806–1822. doi: 10.1111/acer.14154. - DOI - PMC - PubMed
    1. Seemiller L.R., Gould T.J. The effects of adolescent alcohol exposure on learning and related neurobiology in humans and rodents. Neurobiol. Learn. Mem. 2020;172:107234. doi: 10.1016/j.nlm.2020.107234. - DOI - PMC - PubMed
    1. Hasselmo M.E., Sarter M. Modes and Models of Forebrain Cholinergic Neuromodulation of Cognition. Neuropsychopharmacology. 2011;36:52–73. doi: 10.1038/npp.2010.104. - DOI - PMC - PubMed
    1. Záborszky L., Gombkoto P., Varsanyi P., Gielow M.R., Poe G., Role L.W., Ananth M., Rajebhosale P., Talmage D.A., Hasselmo M.E., et al. Specific Basal Forebrain-Cortical Cholinergic Circuits Coordinate Cognitive Operations. J. Neurosci. 2018;38:9446–9458. doi: 10.1523/jneurosci.1676-18.2018. - DOI - PMC - PubMed